THE JEWISH POPULATION OF NEW SOUTH WALES - Key findings from the 2011 Census Dr David Graham
←
→
Page content transcription
If your browser does not render page correctly, please read the page content below

THE JEWISH POPULATION
OF NEW SOUTH WALES
Key findings from the 2011 Census
Dr David Graham
All rights reserved
© JCA
First published 2014
JCA
140-146 Darlinghurst Rd
Darlinghurst NSW 2023
http://www.JCA.org.au

ISBN:

This work is copyright. Apart for any use permitted under the
Copyright Act 1968, no part of it may be reproduced by any
process without written permission from the publisher.
Requests and inquiries concerning reproduction rights should
be directed to the publisher.
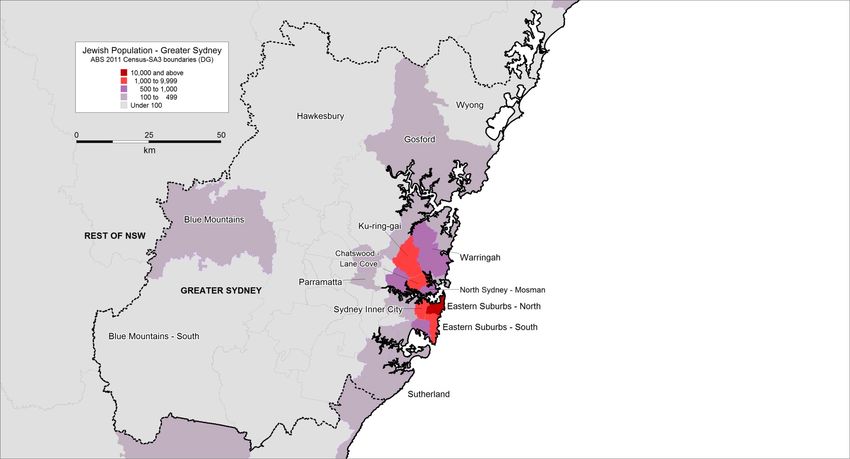
TABLE OF CONTENTS

ACKNOWLEDGEMENTS ..................................................................................................................1
EXECUTIVE SUMMARY.....................................................................................................................2
INTRODUCTION .................................................................................................................................5
   What is a census and who is included?.........................................................................................5
   Why does the census matter? .........................................................................................................5
   About the data ..................................................................................................................................6
NEW SOUTH WALES IN CONTEXT ...............................................................................................7
GEOGRAPHY .......................................................................................................................................9
   Jewish population distribution.......................................................................................................9
DEMOGRAPHY..................................................................................................................................15
   Jewish population change .............................................................................................................15
   Age and sex structure ....................................................................................................................19
       Births.............................................................................................................................................21
       Jewish funerals (communal data).............................................................................................22
JEWISH HOUSEHOLDS....................................................................................................................23
   Household tenure ...........................................................................................................................24
   Household composition ................................................................................................................25
       Family households......................................................................................................................26
       Lone persons................................................................................................................................27
   Partnership status ...........................................................................................................................28
       Current marital status ................................................................................................................28
       De facto and same-sex couple households..............................................................................29
       Marital status and age ................................................................................................................30
INTERMARRIAGE .............................................................................................................................31
   Intermarriage prevalence ..............................................................................................................31
       Change over time ........................................................................................................................31
       Intermarriage and partnership type.........................................................................................32
       Intermarriage by sex...................................................................................................................33
       Intermarriage by age ..................................................................................................................33
       Children of intermarried couples .............................................................................................34
   Core and enlarged Jewish population size, NSW......................................................................34
IMMIGRATION ..................................................................................................................................35
   Place of birth....................................................................................................................................35
   In-migration.....................................................................................................................................37
   Languages........................................................................................................................................39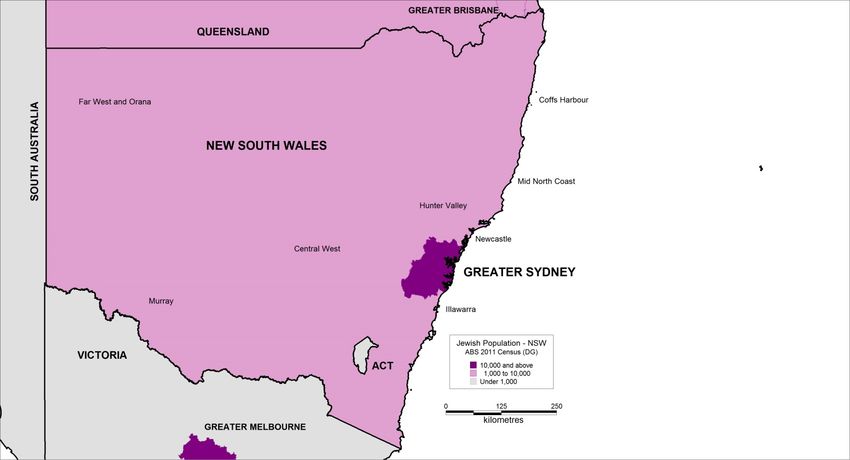
SOCIO-ECONOMICS.........................................................................................................................41
   Educational institutions.................................................................................................................41
       Jewish schools..............................................................................................................................42
       Geography and educational institutions .................................................................................44
   Qualifications ..................................................................................................................................45
   Income, wealth and poverty .........................................................................................................47
       Personal income ..........................................................................................................................47
       Personal income by location......................................................................................................48
       Household income......................................................................................................................49
       Family income .............................................................................................................................51
NON-COMMERCIAL ECONOMY..................................................................................................52
   Volunteering....................................................................................................................................52
   Unpaid domestic work ..................................................................................................................53
   Unpaid childcare ............................................................................................................................54
CARE AND WELFARE .....................................................................................................................55
   Need for care assistance ................................................................................................................55
       Care facilities ...............................................................................................................................55
   Unpaid care provision ...................................................................................................................57
APPENDICES......................................................................................................................................59
   Appendix 1 Adjustments to census data ....................................................................................59
   Appendix 2 Introduction to ABS’s new geographical boundary system...............................61
   Appendix 3 Russian and Hebrew by detailed location ............................................................62
   Appendix 4 Income question wording and data by detailed location ...................................63
   Appendix 5 Age and sex by single years ....................................................................................64
BIBLIOGRAPHY .................................................................................................................................65
ACKNOWLEDGEMENTS
This report was made possible by the investment and forward thinking of JCA, Sydney, an
organisation dedicated to the long-term betterment of the Jewish community in NSW. JCA is an
umbrella organisation comprising 22 constituent members which believes communal planning,
fundraising and investment should be data-driven and has supported such work since its
inception in the 1960s.
This report has benefited from the valuable comments and suggestions made during its drafting
process by Peter Philippsohn OAM (President of JCA), Amanda Goodman (Head of Communal
Planning at JCA), and Dr Gary Eckstein, an independent expert with a wealth of experience in
analysing Australian census data.
It is also the product of collaboration between JCA and the Australian Centre for Jewish
Civilisation at Monash University in Melbourne which contributed financially to the cost of data
procurement from the Australian Bureau of Statistics (ABS) and the production of this report.
We acknowledge the central role Professor Andrew Markus has played in this collaboration.
Dr David Graham was responsible for ordering the customised census data from ABS, analysed
the data and authored this report.
We gratefully acknowledge JCA, Gandel Philanthropy and Jewish Care Victoria for their
generous support in funding the Australia, New South Wales and Victoria reports.

The Jewish Population of New South Wales: Key Findings from the 2011 Census                   1

EXECUTIVE SUMMARY
The census took place on 9th August 2011. Unless otherwise stated, figures in this summary have
been adjusted for undercount and rounded. They refer to Jews and the remainder of the
population in New South Wales, Australia.1

Population overview

•                         There were 45,718 Jewish people in NSW in 2011, or 6 Jews per 1,000 people. The state has
                          the second largest Jewish population in Australia, after Victoria with 51,954 Jews.
•                         The enlarged Jewish population (including non-Jewish partners of Jews and children of Jews
                          not being raised Jewish) is estimated to be 52,855 people.
•                         Between 2006 and 2011 the Jewish population increased by 5%; between 2001 and 2011 it
                          increased by 18%.
•                         Almost all (96%) Jews in NSW live in Sydney; 49% live in Eastern Suburbs–North; Dover
                          Heights accounts for 11% of all Jews in the state.
•                         Between 2001 and 2011 the Jewish population increased by 42% in Eastern Suburbs–South;
                          Upper North Shore contracted by 5% and Lower North Shore contracted by 7%.
•                         The proportion of the general population reporting No Religion increased from 12% in 2001
                          to 18% in 2011. Islam was the largest non-Christian religious group with 219,400 people in
                          2011.

Births and deaths

•                         The average age of Jews is 42 years old compared with 38 years for all others.
•                         Between 2006 and 2011 Jewish births initially rose from 550 per year to 600 per year in
                          2008/09 and dropped back to 550 per year in 2011.
•                         Communal data show there were 2,012 funerals from 2007 to 2011 compared with 2,786 from
                          2002 to 2006.
•                         The community experienced a period of natural increase (excess of births over deaths)
                          during the 2006 to 2011 period—the first time since 1986.

Jewish households2

•                         There were 14,900 Jewish households with an average of 2.7 people per household, similar to
                          the general population at 2.6.
•                         Compared with the general population, Jews are more likely to own their homes outright
                          (39% v 32%) and less likely to rent (25% v 28%).
•                         Compared with the general population, Jews are more likely to live alone (28% v 23%) and
                          less likely to be lone parents (7% v 11%). Even so, there were 1,061 Jewish lone parent
                          families.
•                         Of 9,516 Jewish dependent children (or 1.9 per family), 83% live with married couples and a
                          further 14% live with a lone parent.
•                         4,845 Jewish people live alone; 32% of all people aged 85 and above live alone, compared
                          with 37% in 2006.


1

    Readers interested in Australia-wide data should refer to Graham D 2014 The Jewish Population of Australia: Key findings from the
2011 Census, Monash University, Melbourne and JCA, Sydney

  Data on Jewish households have not been adjusted (see Appendix 1)

2

2                                                                                                                                                                                                                           The Jewish Population of New South Wales: Key Findings from the 2011 Census
Couples3
• Compared with the general population, Jews are more likely to be married (58% v 50%) and
less likely to be in de facto partnerships (6% v 8%).
• In absolute terms, between 2006 and 2011 the number of married Jews increased by 6% to
20,313, de facto Jews by 12% to 2,132 and divorced Jews by 14% to 2,229 Jews.
• 89% of Jews in de facto marriages were in opposite-sex couples; 28% of these people were
divorcees; 237 Jews were in same-sex de facto marriages.
• 30% of people aged 65-69 were currently single, mostly as a result of divorce; women are
more likely to be divorced than men at all ages until their eighties.
Intermarriage4
• Over three quarters (77%) of partnered (married or de facto) Jews are ‘in-married’ i.e. they
have a Jewish partner. Of the 23% (or 4,400 Jewish people) who are ‘intermarried’, most
(66%) have a partner who is not Jewish and 34% have a partner of No Religion.
• Between 2001 and 2011 the proportion of Jews who are ‘intermarried’ increased from 21% to
23%.
• In the same period, the total number of Jewish to Jewish partnerships increased by 12%,
however, the total number of Jewish to non-Jewish/No Religion partnerships increased by
over twice this level (29%).
• 19% of married Jews have a non-Jewish/No Religion spouse compared with 59% of Jews in
de facto marriages.
• Intermarriage is highest among married Jews aged 35-39 years (24%); it is highest among
Jews aged 40-44 in de facto marriages (72%).
• A quarter (25% or 2,731) of all children with at least one Jewish parent are not being raised
Jewish. When only the mother is Jewish 56% of children are raised Jewish; when only the
father is Jewish 15% are raised Jewish.
Immigration
• 48% of Jews in NSW were born in Australia compared with 73% generally.
• 19% of Jews were born in South Africa; 19% in Europe; 5% in Israel.
• 418 Jewish migrants arrived in Australia in the 12 months before the 2011 Census.
• Between 2001 and 2010 Jewish in-migration peaked at 650 in 2001, bottoming out at 350 in
2006 and rose to 418 in 2010. Jewish in-migration has been erratic but generally declining
since the late 1990s.
• Between 2006 and 2011 the largest number of Jewish migrants came from South Africa (398
people) followed by Israel (236 people).
• 43% of Jews in the Upper North Shore were born in South Africa; 25% of Jews in Sydney City
were born in the Former Soviet Union.
• At home, 3,484 Jews speak Russian; 3,075 speak Hebrew. Since 2006 this latter group has
increased by 20%.
3
Data for couples are unadjusted (see Appendix 1)
4
Data for intermarriages are unadjusted (see Appendix 1)
The Jewish Population of New South Wales: Key Findings from the 2011 Census 3Schools and education
• There were 6,441 Jewish children in schools in 2011, up from 6,383 in 2006 and 6,289 in 2001.
• Between 2006 and 2011 the number of Jewish children in the primary sector increased by 8%
while the secondary sector contracted by 7%.
• Primary sector growth was focused on non-Jewish Government schools, up 18% compared
with a 1% increase among Jewish schools. Secondary sector contraction was focused on non-
Jewish Government schools (down 15%) and non-Jewish private schools (down 17%) whilst
Jewish schools experienced a slight increase (up 1%).
• At the primary level 49% of Jewish children go to Jewish schools compared with 57% at the
secondary level.
• Jewish children are nearly twice as likely to attend private schools as the general population
(67% v 36%).
• Jews in their thirties are more than twice as likely to have obtained a bachelor degree or
higher level qualification as the general population (67% v 32%).
Income
• 20% of Jews earn in excess of $104,000 per year compared with 7% generally. Even so, 28% of
Jews earn less than $21,000 per year.
• On average Jewish men earn more than Jewish women at all ages.
• 24% of lone parent families have annual household incomes of less than $31,000, compared
with 5% of couple families with children.
• 41% of people aged 65 and above and who live alone have an annual income of less than
$21,000.
• Jewish household incomes are lowest in Sydney Inner City, suburban Sydney and Country
NSW.
Volunteering, domestic work, child care
• Compared with the general population Jews are more likely to volunteer (27% v 18%).
• Jewish women are over four times as likely to do 15 hours or more unpaid domestic work
per week as Jewish men.
• 71% of women aged 35-39 and 61% of men aged 40-44 do unpaid child care; this is also the
case for 37% of Jewish women in their sixties and 21% in their seventies who are mainly
caring for grandchildren.
Care and welfare
• 2,389 Jewish people are in need of daily care assistance; this is the case for 40% of those aged
85-89 and 62% of those aged 90 and above.
• 863 Jews were living in nursing homes and accommodation for the retired compared with
722 in 2006; however, in relative terms, the increase was modest: in 2006 40% of those aged
90 and above lived in care homes compared with 44% in 2011.
• The average age of people living in care homes increased between 2006 and 2011.
• 533 Jewish people aged 50 and above are in need of daily care assistance and live alone.
• 5,024 Jews provided unpaid care to a family member in need of assistance in the two weeks
prior to the census.
4 The Jewish Population of New South Wales: Key Findings from the 2011 CensusINTRODUCTION The 2011 Census of Australia was conducted on the evening of 9th August 2011 by the Australian Bureau of Statistics (ABS). This produced a rich dataset on the Jewish population of NSW, the key results of which are presented here. WHAT IS A CENSUS AND WHO IS INCLUDED? Ever since the landing of the First Fleet, ‘musters’ were held to count the number of people in the colony and over the years these evolved into formal censuses, the first of which was the New South Wales census of 1828. Following the Federation of Australia in 1901 the first nation-wide or ‘Commonwealth Census’ took place in 1911; thus, 2011 marked 100 years since the first national census was taken. The 2011 Census of Population and Housing is a count of all persons who were present in Australia on the night of 9th August 2011, and also includes information about their dwellings. It is a legal requirement to complete a census form. According to ABS, “The 2011 Census was the largest logistical peacetime operation ever undertaken in Australia, employing over 43,000 field staff to ensure approximately 14.2 million forms were delivered to 9.8 million households.” In 2011, one third of all households submitted their forms online via eCensus. Census data on religion were collected for all household members with the question, What is the person’s religion? and unlike all other census questions, it was voluntary (Figure 1). ‘Judaism’ was listed as one of four examples of write-in options for ‘Other’ religious groups but it was not listed as one of the checkbox categories. No guidance was given as to how the wording of the question ought to be interpreted; it made no direct reference to belief, institutional membership or other types of religious affiliation. The religion question immediately followed questions on language and ancestry. Some data on Jews was also captured in these two questions. Figure 1: The religion question as presented on the 2011 Census form Source: ABS 2011 Census, Household Form (Sample) p6 WHY DOES THE CENSUS MATTER? The census offers a unique opportunity to obtain the broadest possible picture of the Jewish population in NSW. Its breadth is far greater than communal surveys can achieve and it is the only occasion comparative data at the local level is captured for all neighbourhoods across the state at the same time. The data it gathers are vital for community organisations and agencies to help make informed decisions about resource allocation and planning for the future. Census data are used to discern trends and inform decisions and policy making on a host of key areas such as education, welfare, aged care, security, representation and services for the young, elderly, infirm, geographically/socially isolated, disabled, single parents, intermarried families and so on. The Jewish Population of New South Wales: Key Findings from the 2011 Census 5
ABOUT THE DATA
To obtain as much accuracy as possible from the census, two types of data are presented in this
report. Enumerated data refer to raw census counts whereas data which have been adjusted for
possible undercount of the Jewish population are referred to as estimates. Since it is not always
possible or technically feasible to adjust the census data, enumerated figures are used. The
methodology and rationale behind the approaches taken for this report are described in
Appendix 1.
For most geographical breakdowns, the boundary system used here is based on the Australian
Statistical Geography Standard (ASGS). In some instances however, postcode and Local
Government Area (LGA) boundaries are also used, especially for longer term geographical
comparisons. See Appendix 2 for details.
All references to ‘Rest of NSW’ in this report refer to the total population of NSW excluding the
estimated Jewish population.5
All census data relating to individuals for 2006 and 2011 were accessed through ABS’s online
data analytical tool called TableBuilder Pro. Definitions of census categories are based on the ABS
2011 Census Dictionary.
Data on Jewish households and intermarriage were obtained from ABS in the form of specially
customised tables and paid for jointly by JCA in Sydney and the Australian Centre for Jewish
Civilisation at Monash University in Melbourne.


5

   Since the Jewish population constitutes just 0.6% of the total NSW population, the difference between this approach and
comparing Jews with the whole population (i.e. including Jews) makes minimal statistical difference at the state-wide and city
level.

6                                                                                                                                                                                                                           The Jewish Population of New South Wales: Key Findings from the 2011 Census
NEW SOUTH WALES IN CONTEXT
In 2011, almost 4.5 million people reported being Christian in NSW compared with 631,000
people who reported a non-Christian religion and 1.2 million people who reported No Religion.
Despite contracting in relative terms, Christianity, in the broadest sense, therefore continues to
dominate NSW’s religious landscape (Figure 2).

Figure 2: The changing religious identity landscape of NSW, 1991 to 2011 (enumerated)*

                   7,000,000

                   6,000,000

                   5,000,000                                                                                                                                                                                                                                    Not stated

                   4,000,000                                                                                                                                                                                                                                    No Religion

                                                                                                                                                                                                                                                                Other Religions
                   3,000,000
                                                                                                                                                                                                                                                                Christianity
                   2,000,000

                   1,000,000

                                                                 0
                                                                                                                    1991                                                                                      1996               2001     2006      2011


* Data do not include ‘Supplementary codes’ (2006, 2011) and ‘Inadequately described’ (1991, 1996, 2001).


Nevertheless, this landscape has changed in important ways and Table 1 provides details of the
key changes that have occurred since 1991. Although the largest group remains Christianity,
accounting for 65.0% of the population in 2011, in proportionate terms this group has been
steadily declining—by 12 percentage points since 1991 when over three-quarters (77.3%) of the
population reported being Christian. By contrast, 18.1% of people in NSW described themselves
as having ‘No Religion’ in 2011, slightly lower than the national proportion (22.5%) but still a
considerable increase on 10.0% recorded in 1991.
The overall picture in NSW is one of increasing religious diversity with non-Christian
denominations more than tripling in number since 1991. The largest non-Christian religious
group in 2011 was Islam (3.2%) which has almost tripled its presence since 1991. Buddhism is a
close second with 2.9% of the population in 2011. In this context, Jews make up a small
proportion of the total (0.58%)6, a proportion which has increased slightly since 1991 (0.52%), or 6
Jews per 1,000 people. By comparison, there are 32 Muslims per 1,000.

Table 1: Proportionate size of religious groups in NSW - 1991-2011 (enumerated)*

                                                                                                                                                                            1991                                              1996        2001        2006             2011

        Buddhism                                                                                                                                                           1.0%                                               1.4%        2.4%        2.6%             2.9%
        Christianity                                                                                                                                                    77.3%                                                74.7%       72.5%       68.1%            65.0%
        Hinduism                                                                                                                                                           0.4%                                               0.6%        0.8%        1.1%             1.7%
        Islam                                                                                                                                                              1.4%                                               1.7%        2.3%        2.6%             3.2%
        Judaism                                                                                                                                                            0.5%                                               0.5%        0.6%        0.6%             0.6%
        Other Religions                                                                                                                                                    0.2%                                               0.4%        0.5%        0.6%             0.8%
        No Religion                                                                                                                                                     10.0%                                                12.9%       11.9%       14.3%            18.1%
        Not stated                                                                                                                                                         9.1%                                               7.8%        9.1%       10.1%             7.8%
        Total                                                                                                                                                             100%                                               100%        100%         100%            100%
        N                                                                                                                                                      5,717,620                                                    5,977,765   6,230,758   6,511,649       6,869,229

* Columns may not to sum to 100% due to rounding


6

  Based on estimated data the proportion is 0.67%.

The Jewish Population of New South Wales: Key Findings from the 2011 Census                                                                                                                                                                                                       7
In terms of Jewish population size, NSW is the second largest state in Australia with 40.8% of the
total population, after Victoria with 46.4% (Figure 3). The census enumerated 39,729 Jews in
NSW which, following adjustment, gives an estimated population size of 45,718 people.
Figure 3: Size of Australia’s Jewish population by state (estimated)
South Australia Tasmania
Queensland 1,253 Australian Capital 287
5,112 1% Territory >1%
5% 777
1%
Northern Territory
168
>1%
Western Australia
6,735
6%
Victoria
51,955
46%
New South Wales
45,718
41%
8 The Jewish Population of New South Wales: Key Findings from the 2011 CensusGEOGRAPHY JEWISH POPULATION DISTRIBUTION The vast majority (95.6%) of the Jewish population of NSW lives in Greater Sydney (‘Sydney’ from hereon) (Map 1). By comparison, 63.3% of the state’s general population lives in Sydney, an indication of the high concentration of the Jewish population at state level. That said, other religious minority groups are also highly concentrated in Sydney relative to NSW generally (for example, 94.9% of Muslims and 94.6% of Hindus in NSW live in Sydney). Map 1: Jewish population distribution, 2011 NSW (enumerated) The Jewish Population of New South Wales: Key Findings from the 2011 Census 9
The highly concentrated distribution of the NSW Jewish population is not simply confined to
Sydney but is also exhibited at more localised levels. For example, in Sydney itself, just a handful
of places account for more than four out of five (81.8%) Jews in the whole state (Map 2). Indeed,
Eastern Suburbs—North accounts for almost half (46.5%) of the state’s Jewish population (Table
2). Very few Jews live in the west.

Map 2: Jewish population distribution – Greater Sydney* (enumerated)

* Map based on ASGS boundaries (see Appendix 2)


10                                        The Jewish Population of New South Wales: Key Findings from the 2011 Census
But Sydney’s, and therefore NSW’s, Jewish population is even more concentrated than this, and
the majority of Jews in the state live in just a few neighbourhoods to the north (Map 3) and the
east (Map 4) of the city. On the North Shore the population is mainly located in St Ives in Ku-
ring-Gai. There is also a concentration in Hunters Hill (dark red outlier in Map 3), almost entirely
due to the presence of the Montefiore Jewish care home for the elderly.

Map 3: Jewish population distribution, Northern Suburbs* (enumerated)

* Map based on ASGS boundaries (see Appendix 2)


In the Eastern Suburbs concentrations are even higher (Map 4). Indeed, Dover Heights alone
accounts for over one in ten (11.4%) Jews in the whole state. Map 4 also indicates a Jewish
concentration in the north of Randwick (dark red cell)—also due to the location of a Jewish care
home for the aged.

The Jewish Population of New South Wales: Key Findings from the 2011 Census                      11
Map 4: Jewish population distribution, Eastern Suburbs and City* (enumerated)

* Map based on ASGS boundaries (see Appendix 2)


The total Jewish population distribution of NSW for 2011 is shown in Table 2. This highlights the
geographical breakdown of the population used for much of the remainder of this report.7 It
consists of eight ‘broad areas’ and 31 ‘narrow areas’ for more detailed analyses.


7

   Geographical breakdowns of the NSW Jewish population are complicated by the fact that 2011 marked a switch by ABS from
one boundary system to another (see Appendix 2). Therefore it is appropriate that going forward, and where possible, spatial
breakdowns are based on the new system.

12                                                                                                                                                                                                                          The Jewish Population of New South Wales: Key Findings from the 2011 Census
Table 2: Jewish population distribution and percent of total Jewish population in NSW, 2011*
(estimated)
                                                                                            Percent      Percent
                                                                 Narrow         Broad
 Broad areas                Narrow areas                                                   of narrow     of broad
                                                                 subtotal        total
                                                                                              total        total
                            Dover Heights                         5,228                      11.4%
                            North Bondi                           3,368                       7.3%
                            Bellevue Hill                         3,224                       7.0%
                            Bondi Junction                        1,853                       4.0%
                            Vaucluse                              1,672                       3.6%
 Eastern Suburbs -
                            Edgecliff                             1,376         21,300        3.0%         46.5%
 North
                            Rose Bay                              1,299                       2.8%
                            Bondi South                           1,167                       2.5%
                            Bronte                                 914                        2.0%
                            Woollahra                              745                        1.6%
                            Paddington                             455                        1.0%
                            Maroubra                              1,862                       4.1%
                            Randwick                              1,793                       3.9%
 Eastern Suburbs -          Kensington (includes Kingsford)        980                        2.1%
 South (including           Coogee (includes Clovelly)             956          6,880         2.1%         15.0%
 Botany)
                            Botany                                 700                        1.5%
                            Malabar (includes La Perouse -
                                                                   589                        1.3%
                            Chifley)
                            Lower North Shore (includes
                                                                  1,067                       2.3%
                            North Sydney – Mosman)
 Lower North Shore          Lane Cove                              988          2,565         2.2%         5.6%
                            Willoughby (includes Castle
                                                                   510                        1.1%
                            Cove - Northbridge)
                            St. Ives                              2,666                       5.8%
 Upper North Shore          Far Upper North                        662                        1.4%
                                                                                4,425                      9.6%
 (Ku-ring-gai)              Lindfield (includes Roseville)         568                        1.2%
                            Killara                                528                        1.2%
                            City East                             2,037                       4.4%
 Sydney City                                                                    2,635                      5.7%
                            City West                              598                        1.3%
                            Northern Beaches (Manly,
                                                                   978                        2.1%
                            Pittwater, Warringah)
                            Ryde (Pennant Hills - Epping,
                                                                   946                        2.1%
                            Ryde - Hunters Hill)
 Sydney Suburbs Other       Inner West (Canada Bay,                             3,282                      7.2%
                            Leichhardt, Strathfield - Burwood      931                        2.0%
                            - Ashfield)
                            Hornsby                                427                        0.9%
 Sydney Balance             Sydney Balance1                       2,811         2,811         6.1%         6.1%
 Country NSW                Country NSW2                          1,957         1,957         4.3%         4.3%
 TOTAL NSW                                                                      45,856       100%          100%

* Based on ASGS boundaries. See Appendix 2.
1) Sydney Balance = Auburn, Bankstown, Baulkham Hills, Blacktown, Blacktown - North, Blue Mountains, Blue Mountains -
South, Bringelly - Green Valley, Camden, Campbelltown (NSW), Canterbury, Carlingford, Cronulla - Miranda - Caringbah,
Dural - Wisemans Ferry, Fairfield, Gosford, Hawkesbury, Hurstville, Kogarah - Rockdale, Liverpool, Merrylands - Guildford,
Mount Druitt, Parramatta , Penrith, Richmond - Windsor, Rouse Hill - McGraths Hill, St Marys, Sutherland - Menai -
Heathcote, Wollondilly, Wyong
2) Country NSW = Albury, Armidale, Bathurst, Bourke - Cobar - Coonamble, Broken Hill and Far West, Clarence Valley, Coffs
Harbour, Dapto - Port Kembla, Dubbo, Goulburn - Yass, Great Lakes, Griffith - Murrumbidgee (West), Illawarra Catchment
Reserve, Inverell - Tenterfield, Kempsey - Nambucca, Kiama - Shellharbour, Lachlan Valley, Lake Macquarie - East, Lake
Macquarie - West, Lithgow - Mudgee, Lord Howe Island, Lower Hunter, Lower Murray, Maitland, Moree - Narrabri,
Newcastle, Orange, Port Macquarie, Port Stephens, Queanbeyan, Richmond Valley - Coastal, Richmond Valley - Hinterland,
Shoalhaven, Snowy Mountains, South Coast, Southern Highlands, Tamworth - Gunnedah, Taree - Gloucester , Tumut -
Tumbarumba, Tweed Valley, Upper Hunter, Upper Murray exc. Albury, Wagga Wagga, Wollongong

The Jewish Population of New South Wales: Key Findings from the 2011 Census                                            13
As noted, Jews account for less than 1% of the total NSW population and are concentrated in
certain areas. In these places, they make up far greater proportions of the sub-total. Thus in
Dover Heights, 50.2% of the population is Jewish, and over 20% of the population is Jewish in
Rose Bay, Bellevue Hill, Vaucluse, and Bondi South (Table 3). By contrast, just 0.1% of the more
geographically peripheral locations are Jewish.
Table 3: Jewish population distribution as percent of total population by area, 2011* (estimated)
Total population Percent Jewish
Broad areas Narrow areas
Sub total Total Sub total Total
Dover Heights 10,424 50.2%
Rose Bay 4,463 28.5%
Bellevue Hill 12,449 25.7%
Vaucluse 7,249 23.0%
Bondi South 5,467 21.5%
Eastern Suburbs - North North Bondi 19,327 120,553 17.4% 17.6%
Bondi Junction 15,845 11.7%
Edgecliff 11,484 11.6%
Woollahra 7,180 10.4%
Bronte 12,425 7.2%
Paddington 14,240 3.2%
Randwick 27,740 6.5%
Maroubra 29,592 6.3%
Coogee (includes Clovelly) 23,674 4.0%
Eastern Suburbs - South Kensington (includes
26,876 168,352 3.6% 4.1%
(including Botany) Kingsford)
Malabar (includes La
21,112 2.8%
Perouse - Chifley)
Botany 39,358 1.8%
Willoughby (includes Castle
24,320 2.1%
Cove - Northbridge)
Lower North Shore Lane Cove 75,879 188,555 1.3% 1.4%
Lower North Shore (includes
88,356 1.2%
North Sydney – Mosman)
St. Ives 18,643 14.3%
Upper North Shore (Ku- Killara 18,753 2.8%
109,580 4.0%
ring-gai) Lindfield (includes Roseville) 21,173 2.7%
Far Upper North 51,011 1.3%
City East 117,750 1.7%
Sydney City 225,186 1.1%
City West 107,436 0.6%
Ryde (Pennant Hills -
162,843 0.6%
Epping, Ryde - Hunters Hill)
Hornsby 76,535 0.6%
Sydney Suburbs Other Northern Beaches (Manly, 740,578 0.4%
237,639 0.4%
Pittwater, Warringah)
Inner West (Canada Bay,
Leichhardt, Strathfield - 263,561 0.4%
Burwood - Ashfield)
Sydney Balance Sydney Balance1 2,838,872 2,838,872 0.1% 0.1%
2
Country NSW Country NSW 2,512,952 2,512,952 0.1% 0.1%
TOTAL NSW 6,904,628 0.7%
* Calculations based on the estimated Jewish population in an area as a proportion of the total enumerated population in that
area.
1), 2) See note below Table 2
14 The Jewish Population of New South Wales: Key Findings from the 2011 CensusDEMOGRAPHY
JEWISH POPULATION CHANGE
Between 2006 and 2011 the Jewish population of NSW increased by 4.7%, up from an estimated
43,659 to 45,718 people. Sydney’s Jewish population increased by 4.3% during this period, a little
less than the increase experienced by the city overall (6.6%).
These recent increases are part of a longer term trend. During the 30-year period from 1981 to
2011 the Jewish population of NSW increased by 63.0%, up from 24,370 to 39,727 (enumerated)
which equates to an annual growth rate of 1.6% (Figure 4).
Figure 4: Jewish population change 1981 to 2011 with percentage change per decade in parentheses,
NSW (enumerated)*
45,000
39,727
40,000
34,920
35,000
30,000 28,472
24,370 (13.8%)
25,000
(22.6%)
20,000
(16.8%)
15,000
10,000
5,000
0
1981 1991 2001 2011
* Source: 1981 and 1991 Encel and Moss 1995 p9; 2001 ABS customised tables
Of course some areas have grown faster than others and the differences at the broadest level are
shown in Figure 5, which covers change over the last 30 years. It shows that Eastern Suburbs –
North has had the largest Jewish population, by a large margin, since at least 1981. This area has
grown by 43.1% over the 30-year period (or 3.6% per year). However, it is also clear from Figure
5 that Eastern Suburbs – South has become an increasingly important Jewish area, growing by
168.6% over the same 30-year period—that is the equivalent growth rate of over 10% per year, every
year. By contrast, the Jewish population in the Upper North Shore reached its peak size in around
2001 whilst the Lower North Shore Jewish population size has remained relatively flat over the
period.
The Jewish Population of New South Wales: Key Findings from the 2011 Census 15Figure 5: Jewish population change by area*, 1981 to 2011 (enumerated)
20,000
1981
18,000
1991
16,000 2001
14,000 2011
12,000
10,000
8,000
6,000
4,000
2,000
0
Eastern Suburbs - Eastern Suburbs - Ku-ring-gai (Upper Lower North Shore Rest of NSW
North South North Shore)
* Source: 1981 and 1991 Encel and Moss (1995) p9; 2001 ABS customised tables; 2011 TableBuilder Pro; scale based on LGA
boundaries; Lower North Shore = LGAs of Willoughby, North Sydney, Lane Cove, Ryde, and Mosman; Upper North Shore =
LGA of Ku-ring-gai
Examining these changes in greater detail we can see which communities have changed the
most. For example, Table 4 shows that Maroubra grew by 160% in the 20-year period between
1991 and 2011 and all other Eastern Suburbs – South areas grew by over 80%. No areas within
Eastern Suburbs – North grew nearly as much, although Rose Bay and Vaucluse grew by over a
third. Both Bondi and Edgecliff exhibit population declines over the past 15 years and in the case
of Bondi’s Jewish population, it is 13.9% smaller than it was in the mid-1990s. Indeed, the 2011
Census showed that the Jewish population of Vaucluse (Dover Heights) had overtaken Bondi for
the first time.
In other areas, although Waterloo grew by 87.0%, much of that growth was confined to the early
1990s, driven by an influx of immigration from the Former Soviet Union; similarly, St Ives’
growth of 73.3% also seems to have been concentrated in the recent the past, and correlates with
a concomitant slowdown in South African immigration (see Figure 17 on page 43).
Looking more closely at the Lower and Upper North Shore, it is apparent that all areas (Lower
North Shore, Lindfield, St Ives, and Gordon) experienced a Jewish population decline in the most
recent period (2006-2011) and all, excepting St Ives, have experienced declines since 1996 (Table
4).
A summary of the same data based on broad geographical areas is shown in Table 5.
16 The Jewish Population of New South Wales: Key Findings from the 2011 CensusTable 4: Jewish population size by year and percentage change, based on postcode subdivisions -
Narrow areas (estimated)
Percentage change
Postcode
Broad Narrow
area 1991§ 1996‡ 2001* 2006 2011 20 15 10
5 years
areas areas years years years
(POA) 2006-
1991- 1996- 2001-
2011
2011 2011 2011
Bondi 2026 5,329 5,958 5,312 5,383 5,130 -3.7 -13.9 -3.4% -4.7%
Bellevue Hill 2023 2,206 2,501 2,501 2,598 2,856 29.5 14.2 14.2% 9.9%
Waverley 2022 2024 1,645 1,949 2,125 2,205 2,160 31.3 10.8 1.6% -2.0%
Eastern
2025 2027
Suburbs – Edgecliff 2,131 2,316 2,233 2,375 2,198 3.1 -5.1 -1.6% -7.4%
2028
North
Rose Bay 2029 2,256 2,678 2,753 3,002 3,219 42.7 20.2 16.9% 7.2%
Vaucluse 2030 3,751 4,282 4,606 4,719 5,170 37.8 20.7 12.3% 9.6%
2000 2011
Paddington 937 1,002 858 946 938 0.1 -6.4 9.3% -0.9%
2021
Randwick 2031 1,108 1,330 1,498 1,669 2,013 81.7 51.3 34.4% 20.6%
Eastern
2018
Suburbs – Kingsford 1,052 1,492 1,703 1,893 2,077 97.4 39.2 22.0% 9.7%
2032-34
South
Maroubra 2035-2036 1,030 1,257 1,550 1,994 2,677 160.0 112.9 72.7% 34.2%
2010 2016
Waterloo Waterloo 602 1,030 1,102 1,101 1,127 87.0 9.4 2.2% 2.3%
2017
2060-68
Lower North Lower North
2088-90 2,755 2,914 2,873 2,826 2,665 -3.3 -8.5 -7.2% -5.7%
Shore Shore
2092-96
Lindfield 2069 2070 1,001 1,001 870 771 711 -28.9 -29.0 -18.3% -7.7%
Upper North
St Ives 2075 1,538 2,214 2,543 2,754 2,666 73.3 20.4 4.8% -3.2%
Shore
2071-74
Gordon 1,721 1,857 1,686 1,639 1,468 -14.7 -20.9 -12.9% -10.4%
2076-77
Ryde 2110-2122 1,095 1,188 1,113 1,091 -0.4 -8.2% -2.0%
Other
2,172 -4.5
Sydney 2205-14
St George 1,013 936 910 983 -3.0 5.0% 8.0%
2216-34
Balance Balance
Various 3,067 3,525 3,689 4,064 4,594 49.8 30.3 24.5% 13.0%
Sydney Sydney
Country Country
Various 1,327 1,440 1,535 1,630 1,865 40.5 29.5 21.5% 14.4%
NSW NSW
Total 35,629 40,854 41,561 43,592 45,608 28.0% 11.6% 9.7% 4.6%
* 2001 data from Eckstein 2003 p27; ‡ 1996 data from Eckstein 1999 p22; § 1991 data from JCA/Monash University ACJC files
and have been inflated by 20%.
The Jewish Population of New South Wales: Key Findings from the 2011 Census 17Table 5: Jewish population size by year and percentage change, based on postcode subdivisions –
Broad areas (estimated)
Percentage change
Broad areas 1991§ 1996‡ 2001* 2006 2011 20 years 15 years 10 years 5 years
1991- 1996- 2001- 2006-
2011 2011 2011 2011
Eastern Suburbs –
18,256 20,686 20,388 21,228 21,671 18.7% 4.8% 6.3% 2.1%
North
Eastern Suburbs –
3,190 4,079 4,751 5,556 6,766 112.1% 65.9% 42.4% 21.8%
South
Waterloo 602 1,030 1,102 1,101 1,127 87.0% 9.4% 2.2% 2.3%
Lower North Shore 2,755 2,914 2,873 2,826 2,665 -3.3% -8.5% -7.2% -5.7%
Upper North Shore 4,260 5,072 5,099 5,163 4,846 13.8% -4.5% -5.0% -6.1%
Other Sydney 2,172 2,108 2,124 2,023 2,074 -4.5% -1.6% -2.4% 2.5%
Balance Sydney 3,067 3,525 3,689 4,064 4,594 49.8% 30.3% 24.5% 13.0%
Country NSW 1,327 1,440 1,535 1,630 1,865 40.5% 29.5% 21.5% 14.4%
Total 35,629 40,854 41,561 43,592 45,608 28.0% 11.6% 9.7% 4.6%
* 2001 data from Eckstein 2003 p27; ‡ 1996 data from Eckstein 1999 p22; § 1991 data from JCA/Monash University ACJC files
and have been adjusted by 20%
18 The Jewish Population of New South Wales: Key Findings from the 2011 CensusAGE AND SEX STRUCTURE
Jews are older on average than the general NSW population (42 years for Jews compared with 38
years for all others). This is also evident in the age structure of the population as shown in Figure
6 which indicates that in the younger age groups (aged under 20 and 20 to 39 years) there are
proportionately fewer Jewish people whereas in the older age groups (60-79 and 80+) there are
proportionately more Jewish people.
Figure 6: Jewish population structure compared with the rest of NSW, 2011 (estimated)
Jewish (N=45,717)
7.7%
80+ All others (N=6.8m)
4.2%
20.1%
60-79
16.1%
Age group
26.5%
40-59
26.8%
22.9%
20-39
27.2%
22.8%
0-19
25.7%
0% 5% 10% 15% 20% 25% 30%
Despite this relatively older age structure, the Jewish population of NSW increased in size by an
estimated 18.3% between 2001 and 2011. In the same period, the proportion of the population
aged under 15 increased slightly (from 16.9% to 17.7%) as did the proportion aged 85 and above
(from 3.4% to 4.6%).
Figure 7 shows how the Jewish population has changed in terms of age structure between 2001
and 2011. Although we might have expected to see an increase across all age groups, this is not
the case. Some groups increased significantly such as 0-14 years (up by 24.1%), 55-64 years (up
by 77.0%) and 85 years and above (up 59.3%). By contrast, some cohorts contracted in relative
terms such as the 45-54 age group (down by 6.0%) and the 75-84 year age group (down by 9.2%).
These changes are mainly a result of the age/sex structure of the Jewish population and can be
used to indicate the likely size of age groups in the near future.
Figure 7: Jewish population change, NSW, 2001*, 2006 and 2011 (estimated)
2011 (N=45,718)
85+
2006 (N=43,659)
75-84
2001 (N=38,660)
65-74
55-64
45-54
35-44
25-34
15-24
0-14
0
500
1,000
1,500
2,000
2,500
3,000
3,500
4,000
4,500
5,000
5,500
6,000
6,500
7,000
7,500
8,000
8,500
* Data for 2001 have been inflated by a factor of 9.7% to account non-response
The Jewish Population of New South Wales: Key Findings from the 2011 Census 19
The age/sex structure is best examined by means of a ‘population pyramid’ which shows the
overall ‘shape’ of the population. Looking at the pyramid for Jews in NSW (Figure 8) it is
apparent there is a protrusion of people aged in their late fifties and early sixties—these are (post
WWII) ‘baby-boomers’ who are now beginning to enter retirement. There is also a smaller
protrusion of people in their late thirties—this represents the ‘echo’ of the baby-boomer
generation, i.e. the relative increase in births which occurred when the baby-boomer group first
formed families. Indeed, Figure 8 also shows that there is an ‘echo of an echo’ with a relatively
large group under 5 years old, i.e. the grandchildren of the baby-boomers. In some respects this
increase, though real in absolute terms, is illusory since it is a direct result of ‘structural’
change—i.e. more women in the peak reproductive age group (the early thirties). This is distinct
from change resulting from increased birth rates, which, as shown below, have been declining,
not increasing. In other words, it is unlikely this baby boom will continue to the next census.

Figure 8: Jewish population pyramid, NSW (estimated)

       100+
                               Males
                                                                                                                        Females

       95-99                                                                                  113

       90-94                                                                            206          384

       85-89                                                                            499                            841

       80-84                                                                            608                        820

       75-79                                                                            665                      758

       70-74                                                                            865                                  978

       65-69                                                                          1174                                             1252

       60-64                                                                          1672                                                                      1808

       55-59                                                                          1632                                                              1627

       50-54                                                                          1464                                                                1655

       45-49                                                                          1326                                                           1501

       40-44                                                                          1397                                                           1513

       35-39                                                                          1602                                                            1575

       30-34                                                                          1278                                                    1402

       25-29                                                                          1062                                            1238

       20-24                                                                           1112                                         1203

       15-19                                                                           1171                                        1153

       10-14                                                                          1307                                            1239

         5-9                                                                          1436                                                 1287

         0-4                                                                          1467                                                   1367
               2,000

                       1,800

                                  1,600

                                           1,400

                                                   1,200

                                                           1,000

                                                                   800

                                                                         600

                                                                                400

                                                                                      200

                                                                                              0

                                                                                                    200

                                                                                                           400

                                                                                                                 600

                                                                                                                         800

                                                                                                                                   1,000

                                                                                                                                             1,200

                                                                                                                                                      1,400

                                                                                                                                                               1,600

                                                                                                                                                                       1,800

                                                                                                                                                                               2,000

                                                                               Number of Jewish people


Data on the size of the Jewish population based on age in single years by sex is presented in
Appendix 5.

20                                                                   The Jewish Population of New South Wales: Key Findings from the 2011 Census
Births
In the absence of circumcision data8, census figures can be used to provide an estimate of the size
of the Jewish birth cohort since it records the total number of babies aged under 1 on the night of
the census (9th August 2011). It should be stressed that this is only an indication and therefore
these data represent a proxy for Jewish ‘births’ rather than an actual measure.9
There are various ways to examine the data, three of which are presented in Table 6. This shows
augmented* estimates for 2006 and 2011 as well as period averages for Australia-born children
only. It suggests there were 543 Jewish ‘births’ in NSW in the year to the 2011 Census night. This
is 7.5% lower than the equivalent number of 587 recorded in 2006.
However, if the data are analysed in terms of averages (ameliorating the possibility of either the
2006 or 2011 point estimates being anomalous), then an increase of about 21% can be seen over
the two halves of the decade.
Table 6: Jewish ‘births’ in NSW, Australia-born, various measures, augmented estimates*
Time period Total ‘births’ Percent change
Point estimate for ‘births’ in the 12 2006 587
months prior to the census
2011 543 -7.5%
Total number of under 5s for five-year 2002 to 2006 2,362
period prior to census
2007 to 2011 2,860 21.1%
Five-year average number of ‘births’ for 2002 to 2006 472
period prior to census
2007 to 2011 572 21.1%
* Augmented estimates attempt to take account of excess underreporting of the religion of the very young (i.e. under 2 years
old) based on religion non-response data. They take no account of possible underreporting of very young children generally.
This rather confused picture, showing a decrease and an increase, can be explained by looking at
the data for children by individual ages (Figure 9). This suggests that Jewish births peaked at
about 600 per year around 2008/09 and subsequently fell back. Data from other sources (i.e.
JCA’s own database and figures on Jewish preschool enrolments) also point to a peak in births
occurring around 2008/09. (Again, circumcision data would significantly improve our
confidence in the validity of these figures.)
Figure 9: Number of children in the 2011 Census by age, NSW, augmented estimate*
700
600
500
400
300
200
100
0
9 years 8 years 7 years 6 years 5 years 4 years 3 years 2 years 1 year 0 years
Age of child
* These data take no account of child deaths although these will have been tiny in number. It also takes no account of migration
outflows which may have occurred (such as a family making Aliya). Both factors would imply these figures slightly
underreport actual Jewish births. See Table 6 for a definition of augmented estimate.
8
The JCA is currently setting up procedures to regularly collect circumcision data. Such figures are very useful for
triangulating census data and providing an indication of intercensal birth trends whilst retaining strict confidentiality.
9
In practice, there is some uncertainty about the accuracy of the census data relating to very young children where under-
reporting appears to be slightly higher than for other groups. Figures for children under two years old should be treated with
caution.
The Jewish Population of New South Wales: Key Findings from the 2011 Census 21
Jewish funerals (communal data)
The census does not provide information about Jewish deaths, therefore, to complete the
demographic picture of the community it is necessary to turn to communal statistics on Jewish
funerals. Jewish burial and cremation figures gathered by JCA from Sydney Chevra Kadisha,
North Shore Temple Emanuel and Emanuel Synagogue indicate that 2,012 Jewish funerals took
place in NSW between 2007 and 2011, an average of 402 per year (Table 7). By comparison, 2,786
deaths were recorded for the 2001 to 2006 period (557 per year).10
In 2011, a total 447 Jewish funerals were recorded in NSW, a relatively high number given the
five yearly average of 402. Although not all Jews choose to have a Jewish funeral (implying that
the data in Table 7 may understate the true number of Jewish deaths), these figures, taken at face
value, suggest that the community may have experienced a period of natural increase (i.e. an
excess of births over deaths) during the 2006 to 2011 period (see Table 6 on births in 2011).
Indeed, this was predicted by Eckstein in his report on the 2006 census:
                                                     “The small excess of deaths over births has reduced from almost 1,000 over the period
                                                     1996 to 2001 but is still negative caused by the deaths of the first wave of immigrants
                                                     who arrived immediately following the war. Our next report [i.e. this one] should record
                                                     an excess of births over deaths for the first time since 1986.” (Eckstein, 2008 p13)


Table 7: Total Jewish burials and cremations recorded, NSW, 2007-2011

        Year                                                                                                                                                                                           Total funerals

        2007                                                                                                                                                                                                                407
        2008                                                                                                                                                                                                                392
        2009                                                                                                                                                                                                                378
        2010                                                                                                                                                                                                                388
        2011                                                                                                                                                                                                                447
        Average 2007-2011                                                                                                                                                                                                   402

Source: Sydney Chevra Kadisha, North Shore Temple Emanuel and Emanuel Synagogue


In summary, the first decade of the 21st century saw considerable demographic dynamism in the
NSW Jewish population. In the first half of the decade (2001-2006) deaths outpaced births, on
average by about 85 persons per year—i.e. natural decrease occurred. But in the second half of
the decade (2007-2011), births outpaced deaths on average by about 170 persons per year—so
natural increase occurred. Note this does not reflect other population changes due to net
migration (see below) nor assimilation.


10

  Eckstein G., 2008 p20

22                                                                                                                                                                                                                            The Jewish Population of New South Wales: Key Findings from the 2011 Census
JEWISH HOUSEHOLDS
Other than individuals, the most important unit of analysis in the census is the household.
However, the concept of a ‘Jewish household’ is complicated since there are various ways in
which it can be defined. A narrow definition includes any household with a Jewish Household
Reference Person11
(there are 11,358 Jewish households based on this definition); alternatively, a
broader mid-range definition includes any household with at least one Jewish person but where
all other people either reported Jewish or No Religion or their religion was Not Stated (14,900
Jewish households). Finally, a broad definition includes any household with at least one Jewish
person but where all other people may or may not be Jewish (18,130 Jewish households in total)
(see Table 8). In the following section the mid-range definition is the basis of all Jewish
household calculations, unless stated otherwise.12
The average (enumerated) Jewish household size in NSW was 2.7 people per household,
compared with 2.6 people per household in general.13
Table 8: Total Jewish households in NSW and average size by various definitions (enumerated)
Definition Number of 'Jewish households'
Narrow: household reference person (HRP) is Jewish 11,358
Mid-range: at least one person is Jewish and all others are either
14,900
Jewish, religion Not Stated or No Religion
Broad: at least one person is Jewish 18,130*
* This is based on 12,449 couples in which at least one person is Jewish, plus 4,208 Jewish lone persons and 1,061 Jewish lone-
parent households. It also includes 412 Jews living in households with unrelated persons whose religion is Not Stated or No
Religion (i.e. not including Jews living with unrelated non-Jews).
11
The Household Reference Person “is usually the person who has identified himself/herself as person one on the Household
form. […] This variable is to be used with caution as it is not an indication that a person is 'head of the household'.” (ABS 2011
Census Dictionary p162)
12
Since this definition was not used in the past it is not possible to draw comparison with previous censuses. Further,
household data are based on enumerated figures only (see Appendix 1).
13
Based on estimated (i.e. adjusted) data, average Jewish household size is calculated to be 3.1pph, however, since the
adjustment for individuals is not replicated for households (see Appendix 1) this figure cannot be relied upon.
The Jewish Population of New South Wales: Key Findings from the 2011 Census 23You can also read