State and trends in the diversity, abundance and distribution of birds in Wellington City - April 2021 - Wellington City Council
←
→
Page content transcription
If your browser does not render page correctly, please read the page content below
State and trends in the diversity,
abundance and distribution of birds in
          Wellington City

                      April 2021

     Authors:
     NIKKI MCARTHUR, IAN FLUX AND ANNETTE HARVEY
State and trends in the diversity, abundance and distribution of birds in Wellington City.

Nikki McArthur1, Ian Flux2 and Annette Harvey3

1
  17A Ida Street, Redwoodtown, Blenheim 7201
2
  PO Box 40694, Upper Hutt 5140
3
  35 Havelock Street, Mornington, Wellington 6021

This report was prepared for Greater Wellington Regional Council in fulfilment of the Contract for
Services dated 12th November 2020.

8th April 2021.

Citation:

This report should be cited as:

McArthur, N.; Flux, I. and Harvey, A. 2021. State and trends in the diversity, abundance and
distribution of birds in Wellington City. Client report prepared for Greater
Wellington Regional Council, Wellington.

All photographs in this report are copyright © N. McArthur unless otherwise credited, in which case
the person or organization credited is the copyright holder.

Cover Image: Male hihi (Notiomystis cincta) at Zealandia. Image credit: Rob Brown/photonewzealand.
Executive Summary

Five-minute bird counts have been carried out at 100 bird count stations in forest habitat throughout
Wellington City’s parks and reserves network each year between 2011 and 2020. The aim of these
surveys is to monitor trends in the diversity, abundance and distribution of native forest birds
throughout Wellington City’s parks and reserves network, in order to provide a measure of local
biodiversity management outcomes.

Since 2011, the mean number of native bird species being counted during each bird count has risen
by 50%, and the mean number of introduced bird species being counted per count has increased by
61%. Between 2011 and 2020, mean annual counts for kākā have increased by 250%, mean counts
for kererū have increased by 186%, mean counts for tūī have increased by 121%, mean counts for
tīeke / NI saddleback have increased by 29% and mean counts for pīwakawaka / NZ fantail have
increased by 20%.

The predator-free Zealandia sanctuary is having a measurable ‘halo’ effect on native forest bird
communities throughout Wellington City. The mean number of native bird species recorded per five-
minute bird count station declines with increasing distance from Zealandia’s predator-proof fence. A
mean of 6.5 native bird species has been recorded at count stations closest to Zealandia’s boundary
between 2011 and 2020, whereas only 3.2 native bird species on average was recorded at those count
stations situated furthest from Zealandia’s boundary over the same period. In contrast, the mean
number of introduced species recorded per five-minute bird count station increases with increasing
distance from Zealandia’s predator-proof fence. A mean of 2.2 introduced bird species has been
recorded at count stations closest to Zealandia between 2011 and 2020, whereas an average of 2.4
introduced bird species was recorded at count stations situated furthest away from the sanctuary over
the same period.

These results suggest that the presence of large ‘source’ populations of native forest birds in
Zealandia, together with the increasing extent and intensity of mammalian predator control being
carried out in Wellington City, is driving spectacular recoveries in several previously rare or locally
extinct native forest bird species in Wellington City. As a consequence, bird communities in native
forest habitats in Wellington City parks and reserves are becoming more diverse and increasingly
dominated by native species, creating improved opportunities for local residents and visitors alike to
encounter a wider range of New Zealand’s native forest bird species in the heart of New Zealand’s
capital city. One clear sign of this increasing level of engagement is the large number of citizen science
bird records that are being collected in Wellington City, with a total of 47,332 observations of native
forest birds having been reported to date by local residents and visitors since 2011.

It is recommended that Wellington City Council continues to carry out these five-minute bird counts
on an annual basis, to monitor further improvements in the city’s native bird communities as
Wellington continues on its journey towards becoming the world’s first predator-free capital city.

Keywords: Citizen science, eBird, encounter rate, five-minute bird count, generalised linear mixed-
effect models, iNaturalist, New Zealand Bird Atlas, Predator Free Wellington, Wellington City,
Zealandia

                                                                                                        2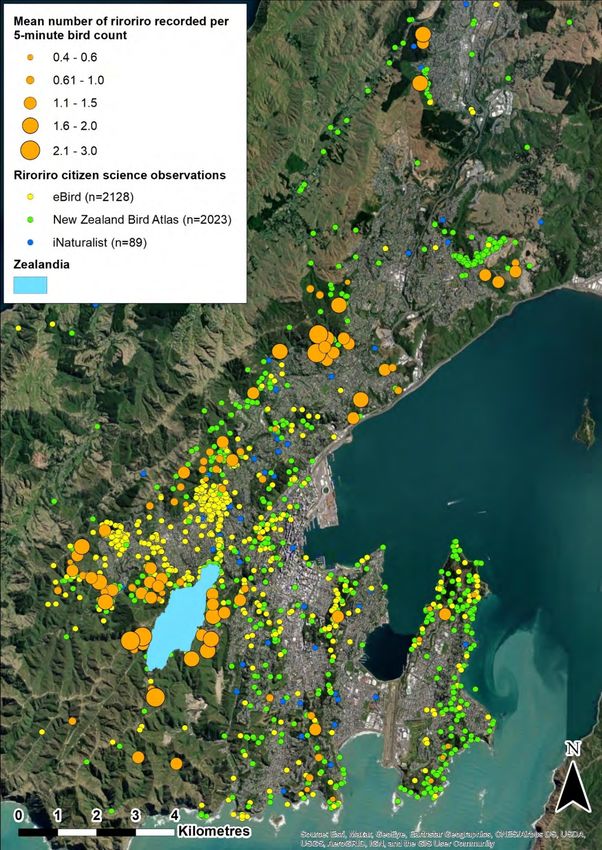
Wellington City forest reserves
                     bird health check

                          Tūī, Tauhou / Silvereye, Riroriro / Grey warbler,
                          Pīwakawaka / NZ fantail, Kākā, Kererū, Kōtare / NZ kingfisher
Low Concern
    Large, stable or
increasing populations.
   Low to moderate
     predator risk.

                          Pīpīwharauroa / Shining cuckoo, Tīeke / NI saddleback,
   Moderate               Kākāriki / Red-crowned parakeet, Pōpokotea / Whitehead,
                          Korimako / Bellbird, Kārearea / NZ falcon, Tōtōwai / NI robin, Hihi
   Concern
  Small, localised or
 sparse populations.
 Moderate predator
          risk.

                          Tītitipounamu / Rifleman
     High
    Concern
  Tiny or declining
    populations.
  Moderate to high
   predator risk.

                           Ruru / Morepork

     Data
   deficient
 Population size and
   trends poorly
      known.
                                                                 Image credits: NZ Birds Online
                                                                   (http://nzbirdsonline.org.nz/)

                                                                                                    i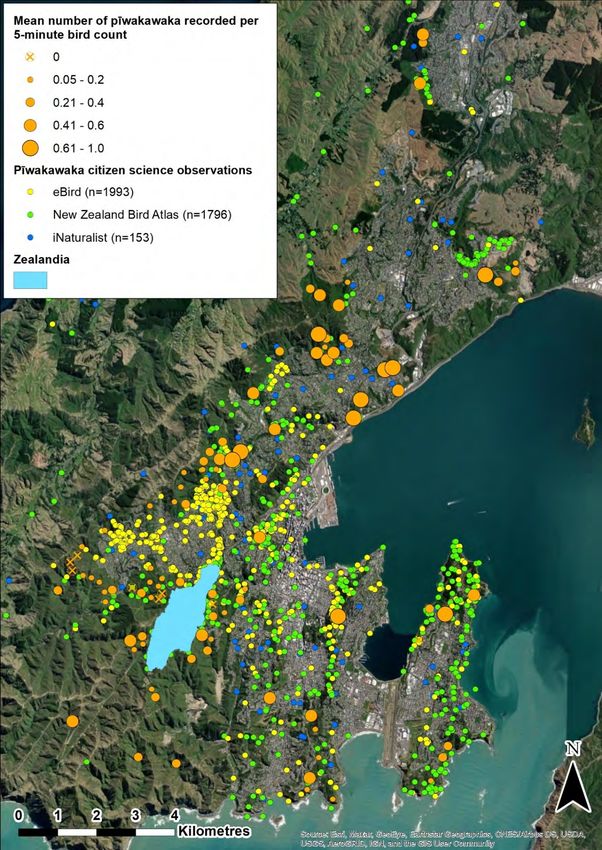
1.       Introduction

Over the past twenty years there has been a conspicuous increase in the species richness, abundance
and distribution of native forest birds in Wellington City (Miskelly et al, 2005; McArthur et al, 2019).
These changes are likely to be due to two improvements in the management of indigenous forest
habitats in and around the city that have occurred in recent decades. Firstly, a series of species
reintroductions to local predator-free sites such as Zealandia, Matiu/Somes Island and Mana Island
have successfully established healthy source populations from which previously locally extinct or near-
extinct bird species have been dispersing into nearby forested reserves in the city (Miskelly &
Powlesland, 2013; McArthur et al, 2017). These species include kākā (Nestor meridionalis),
kākāriki / red-crowned parakeet (Cyanoramphus novaezelandiae), pōpokotea / whitehead
(Mohoua albicilla) and korimako / bellbird (Anthornis melanura) (Miskelly et al, 2005; Froude, 2009;
McLaughlin & Harvey, 2013; Miskelly, 2018). Secondly, ongoing multi-species mammalian predator
control being carried out by Wellington City Council, Greater Wellington Regional Council and
community conservation groups in many Wellington City parks and reserves has resulted in local
increases in resident native bird species such as tūī (Prosthemadera novaeseelandiae) (Bell, 2008;
Froude, 2009; Brockie & Duncan, 2012; McArthur et al, 2019) and is creating an opportunity for
recently reintroduced species to establish functional populations away from their original
reintroduction sites.

Within Zealandia itself, eleven endemic forest bird species have been reintroduced to the sanctuary
since the eradication of mammalian predators in 2000, and a further two species have recolonised of
their own accord (Miskelly 2018 1). This has led to the re-establishment of a diverse and abundant
endemic forest bird community within Zealandia’s predator-proof fence, which in turn has led to
substantial declines in the abundance of three of the four native forest bird species that had been
resident in Zealandia prior to the eradication of mammalian predators, namely tauhou / silvereye
(Zosterops lateralis), riroriro / grey warbler (Gerygone igata) and pīwakawaka / fantail
(Rhipidura fuliginosa) (Miskelly, 2018). At least six introduced bird species have also experienced
similar, substantial declines within Zealandia over this time period, including pahirini / chaffinch
(Fringilla coelebs), dunnock (Prunella modularis) and song thrush (Turdus philomelos) (Miskelly, 2018).
These changes to Zealandia’s bird community over the past two decades may foreshadow the changes
that may occur in forest habitats in other Wellington City parks and reserves, as efforts to control
and/or eradicate mammalian predators continue to expand and intensify.

Mammalian predator control and eradication efforts in Wellington City are continuing to grow in both
intensity and coverage. Dozens of community groups across Wellington City are now participating in
predator control activities, and in recent years the concept of creating ‘predator free suburbs’ has
emerged. Following central government’s announcement in July 2016 to work towards the goal of a
Predator Free New Zealand by 2050, these Wellington City predator control efforts have further
crystallised into the Predator Free Wellington initiative. Predator Free Wellington is being co-funded
by Wellington City Council, Greater Wellington Regional Council and the NEXT Foundation and plans
to build on the proliferation of pest-free suburb projects with the aim of eradicating rats, mustelids

1
  Miskelly (2018) lists 10 forest bird species reintroduced to Zealandia. In March 2019, an 11th species,
tītitipounamu / rifleman (Acanthsitta chloris) was also reintroduced to the sanctuary
(https://www.facebook.com/ZEALANDIA/posts/10156377249456401; accessed 04/04/2021).
                                                                                                            2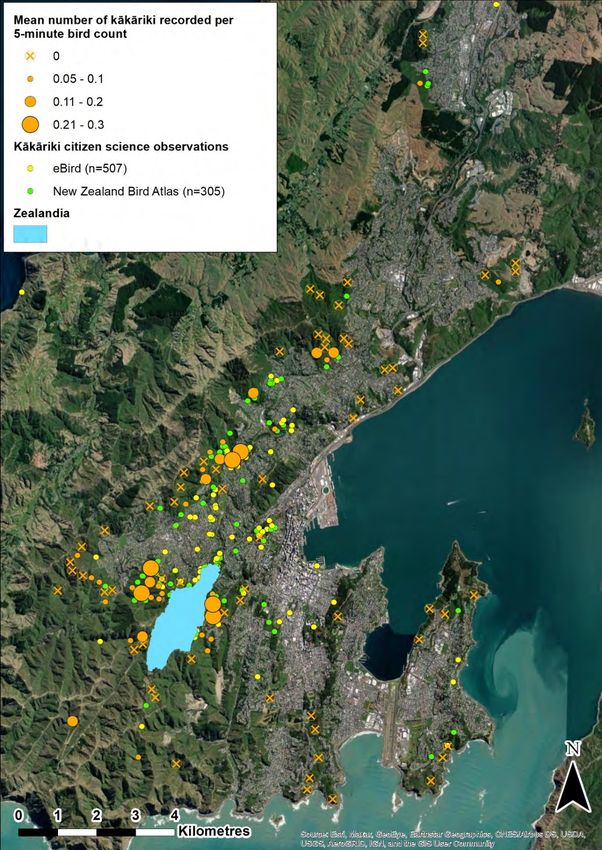
and possums from Wellington City. The first stage of this project commenced in July 2019 with an
effort to eradicate rats and mustelids from Miramar Peninsula, and preparations are now underway
to begin an eradication of rats, possums and mustelids from an additional 19 suburbs from Island Bay
to the CBD (https://www.pfw.org.nz/; accessed 04/04/2021). If successful, these efforts could result
in further dramatic improvements in the distribution and abundance of several native bird species
that are currently locally rare or extinct in Wellington City.

Monitoring the ongoing changes that are occurring to native bird populations in the city provides a
useful means by which the outcome of the considerable time and effort being spent on improving
Wellington City’s biodiversity can continue to be measured. For this reason, Wellington City Council
has identified a need to monitor local bird populations to provide one measure of the success or
otherwise of their recently adopted Biodiversity Strategy & Action Plan (WCC, 2015). Goal 4.2.2a of
this Biodiversity Strategy involves setting up a “consistent terrestrial outcome monitoring
framework…incorporating existing monitoring work in a collaborative approach with other key
organisations” (WCC, 2015).

Five-minute bird count monitoring has been carried out between 2001 and 2009 in nine selected parks
and reserves in Wellington City by Pacific Eco-Logic Ltd (Froude, 2009). These counts were successful
in detecting substantial increases in the local abundance of tūī at a key time during which a large
expansion in pest control efforts in Wellington City was underway. These counts also provided some
of the earliest evidence that bird species re-introduced to Zealandia were dispersing and settling in
nearby reserves (Froude, 2009). In 2011 this bird monitoring programme was replaced with a new
survey designed to monitor changes in the distribution and abundance of native forest birds in forest
habitats across the entire network of Wellington City parks and reserves, rather than only a selected
subset of reserves (McArthur et al, 2012).

These counts have now been carried out each year since 2011 and have demonstrated the important
influence that Zealandia has had on the native forest bird community in the wider Wellington City.
Approximately a third of the native forest bird species detected in Wellington City parks and reserves
each year are species that have been re-introduced to Zealandia and have subsequently expanded
their range to include a number of other parks and reserves in the city (McArthur et al, 2019). Many
of these species were found to have very localised distributions beyond Zealandia’s predator-proof
fence however, indicating that mammalian predators are continuing to limit the ability of these
species to colonise other native forest habitats in the city’s parks and reserves (McArthur et al, 2019).
Another key result from this work is that mean encounter rates for tūī, kākā, kākāriki / red-crowned
parakeet, kererū and tīeke / NI saddleback have increased significantly since 2011, suggesting that
these species have increased in abundance and/or conspicuousness in Wellington City parks and
reserves over this time (McArthur et al, 2019). This suggests that the expansion and intensification of
mammalian predator control efforts over this time have led to measurable improvements in the
population health of these particular bird species.

The incorporation of bird observations collected by local ‘citizen scientists’ into the distribution maps
created as part of this bird monitoring programme has allowed us to map the distribution of native
birds in Wellington City in unprecedented detail. These maps have helped document the range
expansion of recently re-introduced species such as kākā and kākāriki / red-crowned parakeet in
Wellington City virtually in real time and have documented a number of local re-colonisation events
that have occurred in recent years in several individual parks and reserves (McArthur et al, 2019).

This report provides an update on the emerging trends in the diversity, abundance and distribution of
birds in forest habitats in parks and reserves throughout Wellington City, by analysing and reporting a

                                                                                                       3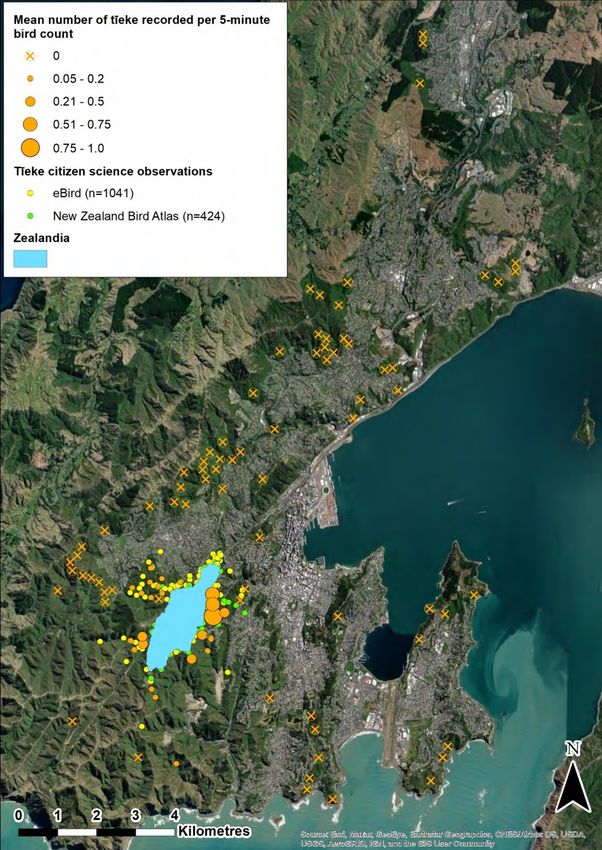
tenth year of five-minute bird count data, together with additional citizen-science data collected since
the publication of the previous bird monitoring report in June 2020.

                                                                                                      4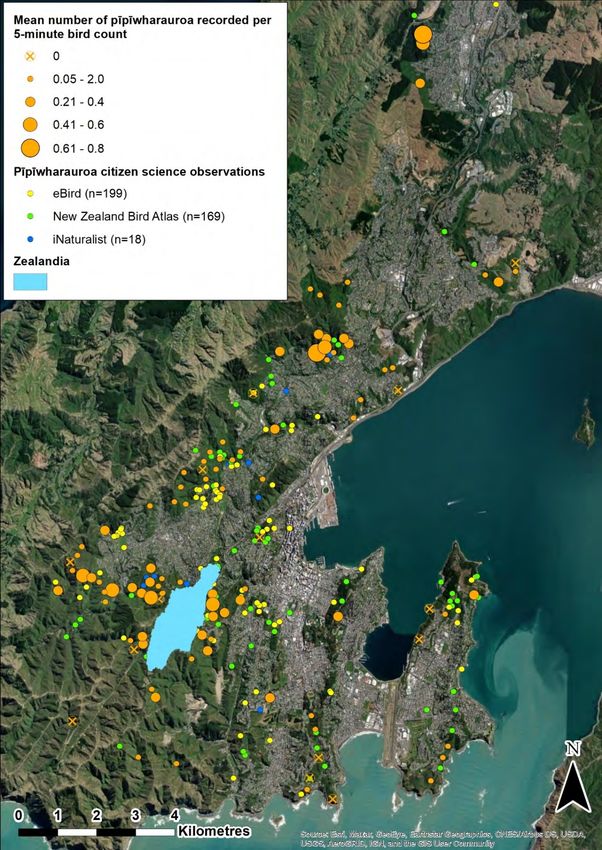
2.      Methods

2.1     Five-minute bird count data collection

One hundred bird count stations were established at randomly selected locations in forest habitat in
Wellington City parks and reserves in November 2011 and have been surveyed annually between 2011
and 2020 (Figure 2.1). Bird count stations were established at a minimum distance of 200 metres from
one another and each station has been marked with either a blue triangle affixed to a living tree, or
with pink flagging tape if situated in plantation forest.

Two five-minute bird counts have been carried out at each station each year, with the two counts at
each station being carried out on a different day. All counts were carried out between early November
and early January each year and counts were made only on fine, calm days between 1.5 hours after
sunrise and 1.5 hours before sunset (approximately 7.30 am to 6.30 pm). At each station, an observer
spent five minutes recording the number of individuals of all species seen or heard from the count
station (i.e., an unbounded count as per Dawson & Bull, 1975 and Hartley & Greene, 2012). Care was
taken not to record the same bird twice during a count. Two experienced observers conducted the
counts each year, with each observer surveying approximately half of the bird count stations.

Bird conspicuousness can vary in response to external variables such as time of year, weather, time of
day and change in observer (Bibby et al, 2000). Because of this, every effort was made to standardise
or sample the range of variation in each of these factors to ensure that as much as possible any
changes in the mean number of birds counted per station from one year to the next would be more
likely to reflect changes in bird abundance rather than conspicuousness. Precautions taken include
carrying out these counts during the same months each year and in similar weather conditions. Counts
were carried out throughout the day, so sampled any variation in bird conspicuousness that occurred
during the day.

Variation in the methods and abilities of observers can have a substantial impact on five-minute bird
count results and can sometimes either mask or be mistaken for true changes in bird abundance or
conspicuousness from one survey to the next (McArthur et al, 2013a). For this reason, we’ve
endeavoured to minimise the number of observers used to collect this five-minute bird count data,
with only two changes being made so far during the ten-year duration of this project. In each case,
when one observer has been replaced with another, the second observer has remained the same
across both years, thus providing us with some ability to differentiate observer-related variation in
bird encounter rates from those caused by true changes in bird conspicuousness or abundance from
one year to the next.

                                                                                                    5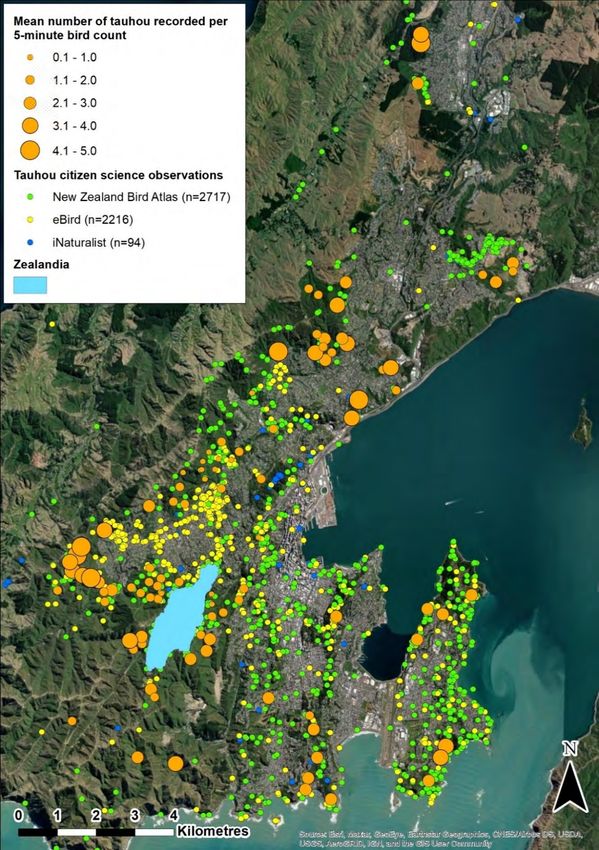
Figure 2.1: Locations of five-minute bird count stations surveyed annually in Wellington City parks
and reserves between 2011 and 2020.

                                                                                                  6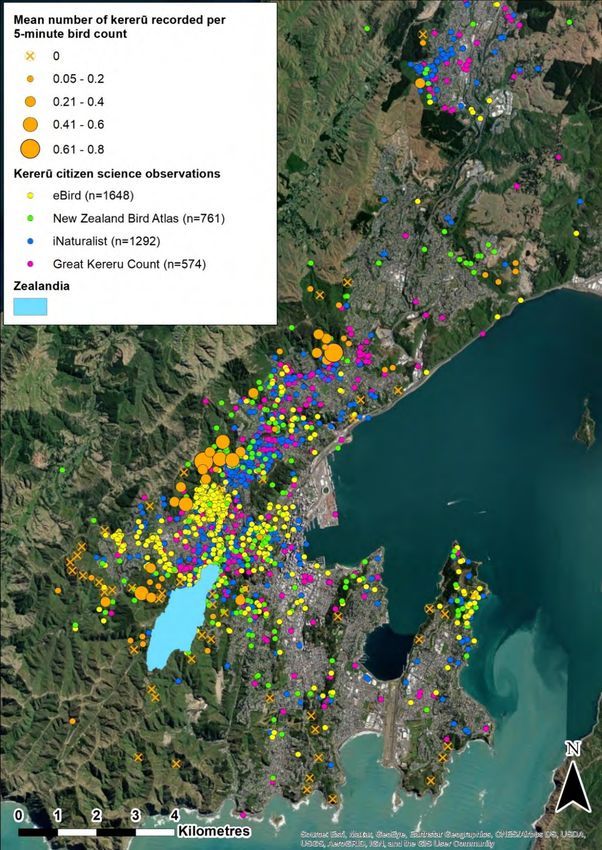
2.2       Five-minute bird count data analysis

The Wellington City five-minute bird count data were first entered into a Microsoft Excel spreadsheet
and then imported into the statistical package R (R Core Team 2021) for statistical analysis. Three
separate analyses were carried out, the first of which looked at overall trends in the encounter rates
of native and introduced birds over time; the second of which investigated temporal trends in the
encounter rates of any individual species that occurred in at least 2.5% of counts (i.e., there were at
least 50 individual detections during counts carried out between 2011 and 2020); and the third of
which investigated the influence that Zealandia’s proximity has on the diversity of native and
introduced bird species recorded at a bird count station.

For all three analyses, generalised linear mixed-effects models with a Poisson error were used to
investigate temporal and spatial trends in bird encounter rates. For each analysis, we compared
models from a candidate set to determine which of the plausible relationships between the number
of birds encountered and time best explained the data. The model that fitted the data best was
selected using Akaike’s Information Criterion corrected for small sample size (AICc; Burnham and
Anderson, 2002), with the model with the lowest AICc value providing the best fit to the data using
the lowest number of model parameters. We then used our preferred models to assess whether
trends in bird encounter rates were increasing or decreasing over time by calculating estimates of
slope, and 95% confidence intervals (CIs) around estimates. Positive estimates of slope indicated
increases in bird encounter rates, while negative estimates of slope indicated decreases in bird
encounter rates. We used the ‘Ime4’ package (Bates et al, 2015) in the statistical package R (R Core
Team 2021) for all three analyses.

2.2.1 Trends in the encounter rates of native versus introduced species

To analyse overall trends in the encounter rates of native versus introduced birds over time, three
plausible models were considered:

      1. No change: Bird encounter rates have not changed between 2011 and 2020 but encounter
         rates of native and introduced species have differed. This model included the number of
         individuals of all species detected during a count in a given year as a response variable, and
         the status of each species (native or introduced) as a predictor variable.

      2. Same population trend for both native and introduced species: Bird encounter rates have
         changed between 2011 and 2020, at the same rate for both native and introduced species.
         This model consisted of the same response variable as the “no change” model above, but
         included both species status and year as predictor variables.

      3. Different population trends for native versus introduced species: Bird encounter rates have
         changed between 2011 and 2020, but at different rates for native versus introduced species.
         This model consisted of the same response and predictor variables as the “same population
         trend” model above, but included an additional interaction term between the status and year
         predictor variables to allow for the slope of the relationship with time to vary between native
         and introduced species.

                                                                                                      7
For each of these three models, a random intercept term was included for each station to account for
the repeated-measures design. We did not include observer in the model because observer was partly
confounded with station. However, only four observers have been used over the ten-year series of
counts, and generally at least five levels of a random effect (in this case, the observer) are required to
achieve robust estimates of variance (Gelman & Hill, 2007).
2.2.2 Trends in the encounter rates of individual native forest bird species
To analyse trends in the encounter rates of individual bird species between 2011 and 2020, two
plausible models were considered:
1. No trend: Bird encounter rates have not changed between 2011 and 2020.
2. Trend over time: Bird encounter rates have either increased or decreased between 2011 and
2020.
Both models included the number of individuals of each species detected during a count in a given
year as a response variable, an intercept term and a random intercept term for each station to account
for the repeated-measures design. The “trend over time” model also included year as a predictor
variable. As with the first analysis, observer was not included as a random effect. Where it was
necessary, an observation-level random effect was also included to account for overdispersion, i.e., a
higher error variance than assumed by the Poisson error distribution for these models (Harrison,
2014).
2.2.3 Zealandia’s influence on native and introduced species richness
To analyse how proximity to Zealandia influences the number of native or introduced species recorded
at a bird count station, three plausible models were considered:
1. No spatial trend: Differences in species richness occur between native and introduced species
at any given location, but show no relationship with distance from Zealandia.
2. Same spatial trend for native and introduced species: Differences in species richness occur
between native and introduced species at any given location, and these differences vary in
relation to the distance of the count station from Zealandia at the same rate for both native
and introduced species.
3. Different spatial trends for native versus introduced species: Differences in species richness
occur between native and introduced species at any given location, and these differences vary
in relation to the distance of the count station from Zealandia but at different rates for native
and introduced species.
All three models contained species richness (i.e., the mean number of species detected at each
station) as a response variable, an intercept term, and a random intercept term for each station (to
account for the repeated-measures design) and for year (to account for variation between years). All
models also included a log-transformed offset term consisting of the number of native and introduced
8species included, to account for there being more native than introduced species included in the
analysis. A linear relationship between species richness and distance to Zealandia was also assumed.
Model one (no spatial trend) included status (whether a species is native or introduced) as a predictor
variable. Model 2 (same spatial trend for native and introduced species) included status and distance
to the nearest point of Zealandia’s boundary as predictor variables. Model three (different spatial
trends for native and introduced species) included the same predictor variables as model two, but also
included an interaction term between status and distance to Zealandia as an additional predictor
variable to allow for the spatial trend in species richness to vary between native and introduced
species.
Patterns in the distribution of native birds among Wellington City reserves were also examined by
mapping the relative frequency at which each native forest bird species was detected at each bird
count station using ArcMap version 10.8.1. Although this technique does not explicitly take into
account relative differences in abundance (e.g., less common species present within sight or earshot
of a bird count station are less likely to be detected) or variation in detection probabilities between
species (e.g., less conspicuous species will also be less likely to be detected), it should be sufficient to
detect relatively conspicuous patterns in species’ distributions and habitat use (Mackenzie et al, 2006).
92.3 Citizen science data analysis
As a result of the increasing popularity of citizen science, there is a rapidly growing pool of bird
observation data collected by citizen scientists available online which can be combined with our more
systematic five-minute bird count data to help detect changes in bird distribution in Wellington City
over time. To date, residents and visitors to the Wellington region have contributed over 384,000 bird
observations to online databases and citizen science projects such as the New Zealand eBird database,
the New Zealand Bird Atlas, iNaturalist and the Great Kererū Count.
The New Zealand eBird database (http://ebird.org/content/newzealand/), which in turn hosts the
New Zealand Bird Atlas dataset, is run by the Cornell Lab of Ornithology in partnership with Birds New
Zealand (formerly the Ornithological Society of New Zealand). It provides a facility for recreational
birdwatchers and professional ornithologists to permanently record their bird observations in a
standard format and in one centralised location and makes these observations available to
researchers, conservation managers and environmental policy makers (Scofield et al, 2012). Globally,
the eBird database is now the largest and fastest growing biodiversity database in the world, with over
668,000 unique users having so far contributed over 915 million bird records describing the
distribution of 98% of the world’s bird species (Sullivan et al, 2014; https://ebird.org/news/2020-year-
in-review, accessed 01/04/2021).
Within the eBird database, automated data filters and an expert review process ensure that these
data are of high quality and accuracy (Sullivan et al, 2014). We used eBird’s “download data” tool to
access the February 2021 release of the eBird Basic Dataset (EBD) and to build custom datasets
containing citizen science records of all native forest bird species recorded in Wellington City between
2011 and 2021. We formatted these datasets using Microsoft Excel, including removing any
extraneous data fields and converting latitude/longitude coordinates to NZTM coordinates. We then
saved these files as .csv files so that they could be imported into ArcMap and converted into
shapefiles. Once in ArcMap, we visually inspected these eBird records to locate and remove any
records containing obvious location errors (e.g., records placed offshore, or for which location
descriptions didn’t match the coordinates provided) or absence records, before adding these records
to the distribution maps created from the five-minute bird count data. A total of 44,397 records of
native forest birds observed in Wellington City was retrieved from eBird using this process,
representing 94% of all of the citizen science bird observations included in this report.
The iNaturalist database is the second-largest online source of citizen science bird data for the
Wellington region. iNaturalist is a database that allows citizen scientists to submit, share and store
natural history observations online, and unlike eBird it is designed to accept records for almost any
taxon of plant or animal rather than just birds. iNaturalist (https://inaturalist.nz/) is run by a charitable
trust called the New Zealand Bio-recording Network Trust and was established using funding from the
New Zealand Government’s Terrestrial Freshwater Biodiversity Information System Fund.
Within the iNaturalist database, a community peer-review process is used to validate records, with
records tagged as either “research grade” or “casual grade” depending on whether or not the original
species identifications have been verified by another iNaturalist user. Because most of the bird
observations submitted to iNaturalist are not accompanied by photographs, the majority of records
cannot be verified and remain tagged as “casual grade” records. We used the search tool on the
Global Biodiversity Information Facility website (https://www.gbif.org/) to download all bird
observations recorded in Wellington City between 2011 and 2021. We formatted this dataset using
Microsoft Excel, including extracting records of all native forest bird species recorded in Wellington
10City, then saved the resulting file as a .csv file so that it could be imported into ArcMap and converted
to a shapefile. We then displayed the data on a map and visually inspected them and removed records
with obvious location errors, before adding these records to the distribution maps created from the
five-minute bird count data. A total of 2,360 records of native forest birds observed in Wellington City
were retrieved from iNaturalist using this process, representing 5% of all of the citizen science bird
observations included in this report.
Kererū Discovery’s Great Kererū Count project is the third-largest source of citizen science bird data
available for Wellington. The Great Kererū Count is billed as New Zealand’s “largest citizen science
project” and is a nationwide kererū survey that takes place over a 10-day period in September each
year (Hartley, 2017). Observers from around the country are encouraged to record the presence or
absence of kererū at locations of their choosing over a 10-day period. In 2020, a total of 10,279 reports
were received nationwide, with a total of 21,509 kererū counted (https://www.greatkererucount.nz/;
accessed 05/04/2021). We made a request for access to the Great Kererū Count data from Kererū
Discovery and received a .csv file containing 574 observations for the city. We imported this .csv file
into ArcMap and visually inspected the records to locate and remove any records containing obvious
location errors before adding these records to the distribution maps created from the five-minute bird
count data. The 574 kererū observations sourced from the Great Kererū Count dataset represents 1%
of all of the citizen science bird observations included in this report.
A key difference between these citizen science datasets and the five-minute bird count data is that
the temporal and spatial distribution of search effort spent by citizen scientists varies unpredictably
from year to year, whereas this search effort is standardised during these five-minute bird counts.
Nonetheless, accurate bird observations submitted by citizen scientists have the potential to
complement distribution data derived from our five-minute bird count dataset by providing
information describing the presence of native forest birds at locations and in habitats not sampled by
these five-minute bird counts. By collecting bird observation data all year round, local citizen scientists
are also better placed to record local colonisation events, prior to the colonising species being
detected during these five-minute bird counts.
113. Results
3.1 Species diversity
Forty-seven bird species have been detected during five-minute bird counts carried out in Wellington
City parks and reserves between 2011 and 2020, including one species (kawau paka / little shag,
Phalacrocorax melanoleucos) that was detected for the first time in 2020. A full list of the 47 bird
species detected, along with their current national and regional New Zealand Threat Classification
rankings, can be found in Appendix One of this report.
Of these 47 bird species, 23 are typically found in native forest habitats, including 16 native or endemic
species and seven introduced and naturalised species. The remaining 24 bird species recorded during
these counts are marine, coastal or open country species such as kororā / little penguin (Eudyptula
minor), tōrea tai / variable oystercatcher and kāhu / swamp harrier (Circus approximans) and are not
included in any of the individual species analyses reported below. Among the 16 native or endemic
bird species recorded during these counts, one is ranked as ‘Nationally Vulnerable’, two are ranked as
‘At Risk Declining’, one is ranked as ‘At Risk Relict’, three are ranked as ‘At Risk Recovering’, and nine
are ranked as ‘Not Threatened’ under the New Zealand Threat Classification Scheme (Appendix One;
Robertson et al, 2017).
The best model to describe the overall trends in encounter rates of native versus introduced birds in
native forest habitat in Wellington City parks and reserves over time was the model that assumed that
population trends would differ between native versus introduced species. This model had a
considerably lower AICc value compared to the next closest model considered (ΔAICc = 8.63).
According to this model, the mean number of native birds encountered per count has increased
between 2011 and 2020 (the coefficient of year on log abundance was 0.04; 95% CI 0.04 - 0.22). Fifty
percent more native birds were encountered in 2020 than in 2011, with a mean of 7.3 (± 0.3 SE) native
birds encountered per bird count in 2020 compared to 4.9 (± 0.2 SE) native birds per count in 2011.
The mean number of introduced birds encountered per count has also increased between 2011 and
2020 (the coefficient of year on log abundance was 0.02; 95% CI 0.01–0.03). Sixty-one percent more
introduced birds were counted in 2020 than in 2011, with a mean of 6.2 (± 0.3 SE) introduced birds
encountered per bird count in 2020 compared to 3.8 (± 0.1 SE) introduced birds per count in 2011.
Over the entire period between 2011 and 2020, native species have increased in abundance at a faster
rate than introduced species, as the coefficient of year on log abundance was larger for native species
(0.04) than it was for introduced species (0.02) (Figure 3.1.1).
12Figure 3.1.1: Trends in the mean number of native and introduced birds encountered per bird count
in Wellington City parks and reserves between 2011 and 2021. Individual data points (± standard
error) represent the mean number of native and introduced bird species detected per count each
year. Solid orange and dashed blue lines (± 95% Confidence Intervals) represent the modelled trend
in the number of native and introduced bird species recorded per count each year.
133.2 Abundance and distribution of native forest bird species
Of the 19 native forest bird species that have been recorded in Wellington City since 2011 (comprising
16 recorded during these five-minute bird counts and a further three species reported by citizen
scientists), 11 species were encountered on at least 50 occasions during these five-minute bird counts
(2.5% of all counts). Based on the lowest AICc values of the two candidate models, seven of these 11
species showed trends over time, whereas four species showed no trend. For species where year has
an effect on mean encounter rates, a coefficient estimate >0 indicates an increase in encounter rates
over time, with greater coefficient estimates indicating faster rates of increase. Conversely, a negative
coefficient estimate indicates a decrease in encounter rates over time. Based on the coefficient
estimates for the seven native forest bird species that showed trends over time, six of these species
(tūī, pīwakawaka / fantail, kākā, kererū (Hemiphaga novaeseelandiae), tīeke / NI saddleback
(Philesturnus rufusater) and kākāriki / red-crowned parakeet) showed an increase in mean encounter
rates over time, and one species (pīpīwharauroa / shining cuckoo (Chrysococcyx lucidus) showed a
decrease in encounter rates (Table 3.2.1).
The following individual species accounts are listed in decreasing order of their current or recent
abundance in Wellington City. Species that are most frequently encountered during the five-minute
bird counts are covered first, and the species that are only seldom encountered, or not encountered
at all during these five-minute bird counts are treated last. Every species of native forest bird that has
been observed in Wellington City outside of Zealandia since 2011 is included in this section of the
report. A separate summary table of annual native forest bird encounter rates can be found in
Appendix Two of this report.
14Table 3.2.1: Summary of models of population change in 11 native forest bird species detected on
at least 50 occasions in Wellington City parks and reserves since 2011, and trend if detected. The
‘selected model’ column indicates which model was selected for each species. The ‘trend’ column
indicates if the change in abundance was increasing, decreasing, or if no trend was detected (‘-‘)
based on estimates of slope.
Coefficient
AICc AICc
Species ∆ AICc Selected model Trend estimate
model 1 model 2
(95% CIs)
Model 2 0.084
Tūī 7043.02 6848.52 194.49 Increasing
(Trend over time) (0.071 – 0.094)
Pīwakawaka Model 2 0.058
2779.04 2765.06 13.98 Increasing
NZ fantail (Trend over time) (0.030 – 0.086)
Model 2 0.156
Kākā 1619.26 1563.35 55.92 Increasing
(Trend over time) (0.116 – 0.200)
Model 2 0.146
Kererū 1343.03 1315.46 27.57 Increasing
(Trend over time) (0.088 – 0.196)
Tīeke Model 2 0.083
621.69 617.68 4.02 Increasing
NI saddleback (Trend over time) (0.008 – 0.143)
Kākāriki
Model 2 0.178
Red-crowned 521.95 520.91 1.04 Increasing?
(Trend over time) (-0.385 – 0.697)
parakeet
Model 1
Tauhou
7392.30 7393.88 1.58 (No change over - -
Silvereye
time)
Model 1
Riroriro
5309.00 5310.57 1.57 (No change over - -
Grey warbler
time)
Model 1
Pōpokotea
611.09 612.00 0.91 (No change over - -
Whitehead
time)
Model 1
Kōtare
512.07 513.78 1.71 (No change over - -
NZ kingfisher
time)
Pīpīwharauroa Model 2 -0.070
1528.33 1518.89 9.44 Decreasing
Shining cuckoo (Trend over time) (-0.114 - -0.027)
153.2.1 Tūī (Prosthemadera novaeseelandiae)
National conservation status: Not Threatened
(Robertson et al, 2017).
Regional conservation status: Not Threatened
(Crisp, 2020).
The tūī is the native forest bird species that is
most frequently encountered during these five-
minute bird counts. Tūī encounter rates have
increased by 121% since 2011, from a mean of
1.35 tūī recorded per five-minute bird count in
2011 to a mean of 2.98 tūī per count in 2020
(the coefficient of year on log abundance was
0.084; 95% CI 0.071–0.094; Figure 3.2.1). Tūī is
Image courtesy of Tony Whitehead/NZ Birds Online
the native forest bird species most commonly
reported by citizen scientists in Wellington City.
Between 2011 and 2021, citizen scientists reported a total of 16,236 encounters with tūī,
demonstrating that this species is now common and widespread in native forest, suburban and urban
habitats throughout the city (Figure 3.2.2).
Figure 3.2.1: Mean (±SE) number of tūī recorded per five-minute bird count station in Wellington
City between 2011 and 2020.
16Figure 3.2.2: Distribution of tūī in Wellington City between 2011 and 2021. Orange circles represent
tūī detections at five-minute bird count stations, with the size of the circle corresponding to the
mean annual number of tūī detected per station between 2011 and 2020. Yellow, green and blue
circles represent tūī observations reported by local citizen scientists via eBird, the New Zealand Bird
Atlas or iNaturalist between 2011 and 2021.
173.2.2 Tauhou / Silvereye (Zosterops lateralis)
National conservation status: Not Threatened
(Robertson et al, 2017).
Regional conservation status: Not Threatened
(Crisp, 2020).
The tauhou / silvereye is the second most frequently
encountered native forest bird species in these
five-minute bird counts. Despite some minor year-to-
year fluctuations, tauhou / silvereye encounter rates
have not changed significantly between 2011 and
2020. Tauhou / silvereye encounter rates have varied
between a low of 1.86 tauhou / silvereyes per count in
2011 and a high of 2.40 per count in 2016 (Figure
3.2.3). Tauhou / silvereye is the second most
Image courtesy of Ormond Torr/NZ Birds Online
frequently reported native forest bird species by
citizen scientists in Wellington City. Between 2011 and
2021, citizen scientists reported a total of 5,027 encounters with tauhou / silvereyes, demonstrating
that this species is common and widespread in native forest, suburban and urban habitats throughout
the city (Figure 3.2.4).
Figure 3.2.3: Mean (±SE) number of tauhou / silvereyes recorded per five-minute bird count station
in Wellington City between 2011 and 2020.
18Figure 3.2.4: Distribution of tauhou / silvereyes in Wellington City between 2011 and 2021. Orange
circles represent tauhou / silvereye detections at five-minute bird count stations, with the size of
the circle corresponding to the mean annual number of tauhou / silvereyes detected per station
between 2011 and 2020. Yellow, green and blue circles represent tauhou / silvereye observations
reported by local citizen scientists via eBird, the New Zealand Bird Atlas or iNaturalist between 2011
and 2021.
193.2.3 Riroriro / Grey warbler (Gerygone igata)
National conservation status: Not Threatened
(Robertson et al, 2017).
Regional conservation status: Not Threatened
(Crisp, 2020).
The riroriro / grey warbler is the third most frequently
encountered native forest bird species in these
five-minute bird counts. Despite some minor year-to-
year fluctuations, riroriro / grey warbler encounter
rates have not changed significantly between 2011 and
2020. Riroriro / grey warbler encounter rates have
varied between a low of 0.84 riroriro / grey warblers per
count in 2011 and a high of 1.45 per count in 2015
(Figure 3.2.5). Riroriro / grey warbler is the fifth most
Image courtesy of Bartek Wypych/NZ Birds Online
frequently reported native forest bird species by citizen
scientists in Wellington City. Between 2011 and 2021,
citizen scientists reported a total of 4,240 encounters with riroriro / grey warblers, demonstrating that
this species is common and widespread in native forest and suburban habitats, but is largely absent
from urban habitats throughout the city (Figure 3.2.6).
Figure 3.2.5: Mean (±SE) number of riroriro / grey warblers recorded per five-minute bird count
station in Wellington City between 2011 and 2020.
20Figure 3.2.6: Distribution of riroriro / grey warblers in Wellington City between 2011 and 2021.
Orange circles represent riroriro / grey warbler detections at five-minute bird count stations, with
the size of the circle corresponding to the mean annual number of riroriro / grey warblers detected
per station between 2011 and 2020. Yellow, green and blue circles represent riroriro / grey warbler
observations reported by local citizen scientists via eBird, the New Zealand Bird Atlas or iNaturalist
between 2011 and 2021.
213.2.4 Pīwakawaka / NZ fantail (Rhipidura fuliginosa)
National conservation status: Not Threatened
(Robertson et al, 2017).
Regional conservation status: Not Threatened
(Crisp, 2020).
The pīwakawaka / NZ fantail is the fourth most
frequently encountered native forest bird species in
these five-minute bird counts. Pīwakawaka / NZ fantail
encounter rates have increased by 20% since 2011,
from a mean of 0.35 pīwakawaka / NZ fantails recorded
per five-minute bird count in 2011 to a mean of 0.42
pīwakawaka / NZ fantails per count in 2020 (the
coefficient of year on log abundance was 0.058; 95% CI
Image courtesy of Cheryl Marriner/NZ Birds Online 0.030–0.086; Figure 3.2.7). Moreover, pīwakawaka / NZ
fantails have increased by 100% over the past five years,
from a low of 0.21 bird per count in 2015, to 0.42 birds per count in 2020 (Figure 3.2.7). Pīwakawaka
/ NZ fantail is the sixth most frequently reported native forest bird species by citizen scientists in
Wellington City. Between 2011 and 2021, citizen scientists reported a total of 3,942 encounters with
pīwakawaka / NZ fantails, demonstrating that this species is common and widespread in native forest,
suburban and urban habitats throughout the city (Figure 3.2.8).
During New Zealand’s March-April 2020 Covid-19 national lockdown, reports in the media suggested
that native forest birds such as pīwakawaka / NZ fantails were occurring more frequently in urban
habitats in Wellington’s CBD as a result of reduced levels of human disturbance during lockdown 2.
Citizen science records collected in Wellington City over the past ten years however show that
pīwakawaka / fantails had been regularly recorded in Wellington’s CBD for a number of years, so it’s
more likely that these birds had become more conspicuous to the general public during the lockdown,
rather than more numerous.
2
https://www.stuff.co.nz/environment/120828367/native-birds-explore-empty-wellington-during-
coronavirus-lockdown; accessed 04/04/2021.
22Figure 3.2.7: Mean (±SE) number of pīwakawaka / fantails recorded per five-minute bird count
station in Wellington City between 2011 and 2020.
23Figure 3.2.8: Distribution of pīwakawaka / fantails in Wellington City between 2011 and 2021.
Orange circles represent pīwakawaka / fantail detections at five-minute bird count stations, with
the size of the circle corresponding to the mean annual number of pīwakawaka / fantails detected
per station between 2011 and 2020. Yellow, green and blue circles represent pīwakawaka / fantail
observations reported by local citizen scientists via eBird, the New Zealand Bird Atlas or iNaturalist
between 2011 and 2021.
243.2.5 Kākā (Nestor meridionalis)
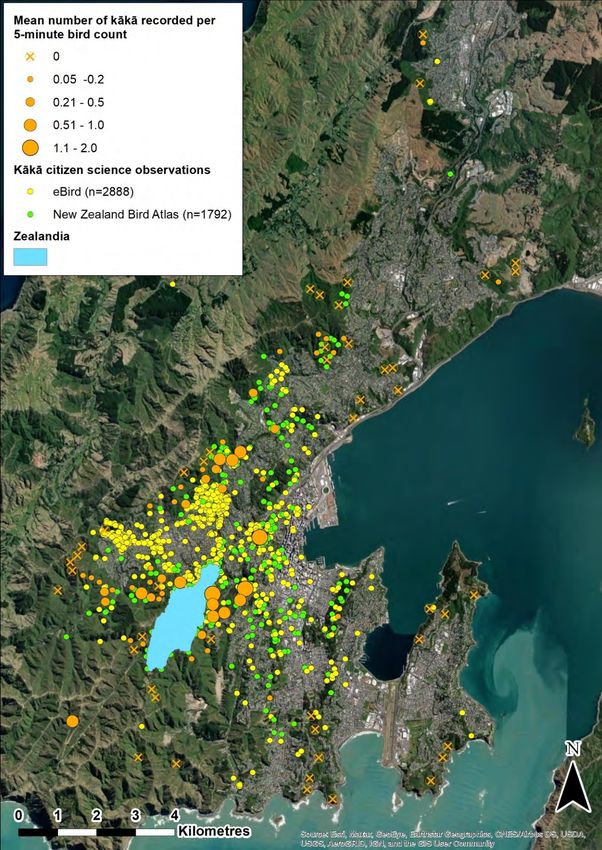
National conservation status:
At Risk, Recovering (Robertson et al, 2017).
Regional conservation status:
At Risk, Recovering (Crisp, 2020).
The kākā was reintroduced to Zealandia
between 2002 and 2007 (Miskelly, 2018) and
is now the fifth most frequently encountered
native forest bird species in these five-minute
bird counts. Kākā encounter rates have
increased by 250% since 2011, from a mean of
0.10 kākā recorded per five-minute bird count Image courtesy of Jean-Claude Stahl/NZ Birds Online
in 2011 to a mean of 0.35 kākā per count in
2020 (the coefficient of year on log abundance
was 0.156; 95% CI 0.116–0.200; Figure 3.2.9). Kākā is now the third most frequently reported native
forest bird species by citizen scientists in Wellington City. Between 2011 and 2021, citizen scientists
reported a total of 4,680 encounters with kākā, demonstrating that this species is now common and
widespread in native forest and suburban habitats in the central and southern suburbs of Wadestown,
Ngaio, Karori, Te Aro, Brooklyn, Newtown and Island Bay. Kākā are also continuing to spread gradually
northwards into Khandallah, and eastwards onto Miramar Peninsula (Figure 3.2.10).
Figure 3.2.9: Mean (±SE) number of kākā recorded per five-minute bird count station in Wellington
City between 2011 and 2020.
25Figure 3.2.10: Distribution of kākā in Wellington City between 2011 and 2021. Orange circles
represent kākā detections at five-minute bird count stations, with the size of the circle
corresponding to the mean annual number of kākā detected per station between 2011 and 2020.
Yellow and green circles represent kākā observations reported by local citizen scientists via eBird or
the New Zealand Bird Atlas between 2011 and 2021.
263.2.6 Kererū (Hemiphaga novaeseelandiae)
National conservation status: Not Threatened
(Robertson et al, 2017).
Regional conservation status: At Risk, Recovering
(Crisp, 2020).
The kererū is the sixth most frequently encountered
native forest bird species in these five-minute bird counts.
Kererū encounter rates have increased by 186% since
2011, from a mean of 0.07 kererū recorded per five-
minute bird count in 2011 to a mean of 0.20 kererū per
count in 2020 (the coefficient of year on log abundance
was 0.146; 95% CI 0.088–0.196; Figure 3.2.11). Significant
‘hotspots’ in kererū encounter rates occur in Ōtari-
Wilton’s Bush and in Khandallah Park, two Wellington City
reserves that contain areas of old-growth native forest Image courtesy of Arindam Bhattacharya
NZ Birds Online
(Figure 3.2.12). Kererū is the fourth most frequently
reported native forest bird species by citizen scientists in
Wellington City. Between 2011 and 2021, citizen scientists reported a total of 4,275 encounters with
kererū, demonstrating that kererū are widespread in areas of native forest habitat in the city, and in
adjacent suburban habitats (Figure 3.2.12).
Figure 3.2.11: Mean (±SE) number of kererū recorded per five-minute bird count station in
Wellington City between 2011 and 2020.
27Figure 3.2.12: Distribution of kererū in Wellington City between 2011 and 2021. Orange circles
represent kererū detections at five-minute bird count stations, with the size of the circle
corresponding to the mean annual number of kererū detected per station between 2011 and 2020.
Yellow, green, blue and purple circles represent kererū observations reported by local citizen
scientists via eBird, the New Zealand Bird Atlas, iNaturalist or the Great Kererū Count between 2011
and 2021.
283.2.7 Pīpīwharauroa / Shining cuckoo (Chrysococcyx lucidus)
National conservation status: Not Threatened
(Robertson et al, 2017).
Regional conservation status: Not Threatened
(Crisp, 2020).
The pīpīwharauroa / shining cuckoo is the seventh
most frequently encountered native forest bird
species in these five-minute bird counts.
Pīpīwharauroa / shining cuckoo encounter rates
have declined by 53% since 2011, from a mean of
0.17 pīpīwharauroa / shining cuckoos recorded per
five-minute bird count in 2011 to a mean of 0.08
pīpīwharauroa / shining cuckoos per count in 2020
Image courtesy of Rob Lynch/NZ Birds Online
(the coefficient of year on log abundance was
-0.070; 95% CI -0.114 - -0.027; Figure 3.2.13). The
majority of this decline occurred between 2018 and
2019, with encounter rates during the 2019 and 2020 counts significantly lower than encounter rates
recorded between 2011 and 2018. Up until 2018, these bird counts were typically carried out between
early November and early December each year, whereas the 2019 and 2020 counts extended into late
December and early January. Pīpīwharauroa / shining cuckoo call rates are known to decline steadily
from December onwards (Heather & Robertson, 2015), so the decline in pīpīwharauroa / shining
cuckoo encounter rates observed during these five-minute bird counts almost certainly reflects
differences in the conspicuousness of pīpīwharauroa / shining cuckoos between the 2011-2018 and
2019-2020 counts, rather than a decline in numbers over this time.
Pīpīwharauroa / shining cuckoos are sparsely distributed throughout Wellington City, though
‘hotspots’ in encounter rates appear to occur in forested reserves adjacent to Zealandia, and in
Khandallah Park (Figure 3.2.14). Pīpīwharauroa / shining cuckoo is the sixteenth most frequently
reported native forest bird species by citizen scientists in Wellington City. Between 2011 and 2021,
citizen scientists reported a total of 386 encounters with pīpīwharauroa / shining cuckoos,
demonstrating that these birds are sparsely distributed in native forest and surburban habitats
throughout the city (Figure 3.2.14).
29Figure 3.2.13: Mean (±SE) number of pīpīwharauroa / shining cuckoos recorded per five-minute bird
count station in Wellington City between 2011 and 2020.
30Figure 3.2.14: Distribution of pīpīwharauroa / shining cuckoos in Wellington City between 2011 and
2021. Orange circles represent pīpīwharauroa / shining cuckoo detections at five-minute bird count
stations, with the size of the circle corresponding to the mean annual number of pīpīwharauroa /
shining cuckoos detected per station between 2011 and 2020. Yellow, green and blue circles
represent pīpīwharauroa / shining cuckoo observations reported by local citizen scientists via eBird,
the New Zealand Bird Atlas or iNaturalist between 2011 and 2021.
313.2.8 Tīeke / North Island Saddleback (Philesturnus rufusater)
National conservation status:
At Risk, Recovering (Robertson et al, 2017).
Regional conservation status:
Regionally Vulnerable (Crisp, 2020).
The tīeke / NI saddleback was reintroduced to
Zealandia between 2002 and 2003 (Miskelly,
2018) and is now the eighth most frequently
encountered native forest bird species in these
five-minute bird counts. Tīeke / NI saddleback
encounter rates have increased by 29% since
2011, from a mean of 0.07 tīeke / NI
saddleback recorded per five-minute bird
Image courtesy of Rob Lynch/NZ Birds Online
count in 2011 to a mean of 0.09 tīeke / NI
saddleback per count in 2020 (the coefficient of
year on log abundance was 0.083; 95% CI 0.008 - 0.143; Figure 3.2.15). Tīeke / NI saddleback are
largely restricted to Zealandia and to forested reserves less than 1-2 km from Zealandia’s pest-proof
boundary fence, so this increase in encounter rates may be an indication that the recent intensification
of mammalian predator control efforts in Polhill Reserve is benefitting this species. Tīeke / NI
saddleback is the seventh most frequently reported native forest bird species by citizen scientists in
Wellington City. Between 2011 and 2021, citizen scientists reported a total of 1465 encounters with
tīeke / NI saddlebacks and the majority of these sightings were reported from native forest habitats
within 1 km of Zealandia’s boundary fence (Figure 3.2.16). This localised distribution of tīeke / NI
saddleback observations strongly suggests that one or more environmental factors are severely
limiting the ability of this species to colonise forest habitats beyond Zealandia’s predator-proof fence.
32Figure 3.2.15: Mean (±SE) number of tīeke / NI saddlebacks recorded per five-minute bird count
station in Wellington City between 2011 and 2020.
33Figure 3.2.16: Distribution of tīeke / NI saddlebacks in Wellington City between 2011 and 2021.
Orange circles represent tīeke / NI saddleback detections at five-minute bird count stations, with
the size of the circle corresponding to the mean annual number of tīeke / NI saddlebacks detected
per station between 2011 and 2020. Yellow and green circles represent tīeke / NI saddleback
observations reported by local citizen scientists via eBird or the New Zealand Bird Atlas between
2011 and 2021.
343.2.9 Kākāriki / Red-crowned parakeet (Cyanoramphus novaezelandiae)
National conservation status: At Risk, Relict (Robertson
et al, 2017).
Regional conservation status: At Risk, Recovering (Crisp,
2020).
The kākāriki / red-crowned parakeet was reintroduced to
Zealandia between 2010 and 2011, although it is likely that
this species has been colonising Wellington City since at
least 1999, following the eradication of rats from Kāpiti
Island in 1996, and the introduction of kākāriki / red-
crowned parakeets to Matiu/Somes Island in 2003
(Miskelly et al, 2005). Kākāriki / red-crowned parakeets
are now the ninth most frequently encountered native
forest bird species in these five-minute bird counts.
Image courtesy of Laurie Ross/NZ Birds Online
Kākāriki / red-crowned parakeet encounter rates have
increased by 500% since 2011, from 0.01 kākāriki / red-
crowned parakeets recorded per bird count in 2011 to 0.06 kākāriki / red-crowned parakeets per
count in 2020 (the coefficient of year on log abundance was 0.178; 95% CI -0.385 – 0.697; Figure
3.2.17). The confidence limits around the coefficient estimate for this estimate are very large and
include a lower CIFigure 3.2.17: Mean (±SE) number of kākāriki / red-crowned parakeets recorded per five-minute
bird count station in Wellington City between 2011 and 2020.
36Figure 3.2.18: Distribution of kākāriki / red-crowned parakeets in Wellington City between 2011 and
2021. Orange circles represent kākāriki / red-crowned parakeet detections at five-minute bird count
stations, with the size of the circle corresponding to the mean annual number of kākāriki / red-
crowned parakeets detected per station between 2011 and 2020. Yellow and green circles
represent kākāriki / red-crowned parakeet observations reported by local citizen scientists via eBird
or the New Zealand Bird Atlas between 2011 and 2021.
373.2.10 Pōpokotea / Whitehead (Mohoua albicilla)
National conservation status: At Risk, Declining
(Robertson et al, 2017).
Regional conservation status: Not Threatened
(Crisp, 2020).
The pōpokotea / whitehead was reintroduced to
Zealandia between 2001 and 2002 (Miskelly,
2018) and is now the tenth most frequently
encountered native forest bird species in these
five-minute bird counts. Despite some minor
year-to-year fluctuations, pōpokotea /
Image courtesy of Tony Whitehead/NZ Birds Online whitehead encounter rates have not changed
significantly between 2011 and 2020. Pōpokotea
/ whitehead encounter rates have varied
between a high of 0.09 pōpokotea / whiteheads per count in 2012 and a low of 0.04 per count in 2013
(Figure 3.2.19). Pōpokotea / whitehead is the ninth most frequently reported native forest bird species
by citizen scientists in Wellington City. Between 2011 and 2021, citizen scientists reported a total of
1057 encounters with pōpokotea / whiteheads. These records show that whiteheads are largely
restricted to Zealandia and to forest reserves within 1-2 km of Zealandia’s boundary fence, however
they have been recorded further afield on occasions, including in Trelissick Park, Ōtari-Wilton’s Bush,
Tinakori Hill, Wellington Botanical Gardens, Mākara Peak and Prince of Wales Park (Figure 3.2.20). This
localised distribution of pōpokotea / whitehead observations strongly suggests that one or more
environmental factors are severely limiting the ability of this species to colonise forest habitats beyond
Zealandia’s predator-proof fence.
38You can also read