The Mitogenome Relationships and Phylogeography of Barn Swallows (Hirundo rustica)
←
→
Page content transcription
If your browser does not render page correctly, please read the page content below

The Mitogenome Relationships and Phylogeography of Barn
Swallows (Hirundo rustica)
Gianluca Lombardo ,1 Nicola Rambaldi Migliore ,1 Giulia Colombo ,1 Marco
Rosario Capodiferro ,1 Giulio Formenti ,2 Manuela Caprioli,3 Elisabetta Moroni,1
Leonardo Caporali ,4 Hovirag Lancioni ,5 Simona Secomandi ,6 Guido Roberto Gallo ,6
Alessandra Costanzo ,3 Andrea Romano ,3 Maria Garofalo ,7 Cristina Cereda ,7 Valerio Carelli
  ,4,8 Lauren Gillespie ,9 Yang Liu ,10 Yosef Kiat ,11 Alfonso Marzal ,12 Cosme López-Calderón
  ,13 Javier Balbontín ,14 Timothy A. Mousseau ,15 Piotr Matyjasiak ,16 Anders Pape Møller ,17
Ornella Semino ,1 Roberto Ambrosini ,3 Andrea Bonisoli-Alquati ,18 Diego Rubolini ,3
Luca Ferretti ,1 Alessandro Achilli ,1 Luca Gianfranceschi ,6 Anna Olivieri ,* ,1 and
Antonio Torroni * ,1

                                                                                                                                                           Downloaded from https://academic.oup.com/mbe/article/39/6/msac113/6591937 by guest on 20 June 2022
 1
   Dipartimento di Biologia e Biotecnologie “Lazzaro Spallanzani”, Università di Pavia, 27100 Pavia, Italy
 2
   Vertebrate Genome Laboratory, The Rockefeller University, New York, NY 10065, USA
 3
   Dipartimento di Scienze e Politiche Ambientali, Università degli Studi di Milano, 20133 Milan, Italy
 4
   IRCCS Istituto delle Scienze Neurologiche di Bologna, Programma di Neurogenetica, 40139 Bologna, Italy
 5
   Dipartimento di Chimica, Biologia e Biotecnologie, Università di Perugia, 06123 Perugia, Italy
 6
   Dipartimento di Bioscienze, Università degli Studi di Milano, 20133 Milan, Italy
 7
   Genomic and Post-Genomic Unit, IRCCS Mondino Foundation, 27100 Pavia, Italy
 8
   Dipartimento di Scienze Biomediche e Neuromotorie, Università di Bologna, 40139 Bologna, Italy
 9
   Department of Academic Education, Central Community College, Columbus, NE 68601, USA
10
  State Key Laboratory of Biocontrol, School of Ecology, Sun Yat-sen University, Guangzhou 510275, China
11
  Israeli Bird Ringing Center (IBRC), Israel Ornithological Center, Tel Aviv, Israel
12
  Department of Zoology, University of Extremadura, 06071 Badajoz, Spain
13
  Department of Wetland Ecology, Estación Biológica de Doñana CSIC, 41092 Seville, Spain
14
  Department of Zoology, University of Seville, 41012 Seville, Spain
15
  Department of Biological Sciences, University of South Carolina, Columbia, SC 29208, USA
16
  Institute of Biological Sciences, Cardinal Stefan Wyszyński University in Warsaw, 01-938 Warsaw, Poland
17
  Ecologie Systématique Evolution, Université Paris-Sud, CNRS, AgroParisTech, Université Paris-Saclay, 91405, Orsay Cedex, France
18

                                                                                                                                                          Article
  Department of Biological Sciences, California State Polytechnic University - Pomona, Pomona, CA 91767, USA
*Corresponding authors: E-mails: antonio.torroni@unipv.it; anna.olivieri@unipv.it.
Associate editor: Xuming Zhou

Abstract
The barn swallow (Hirundo rustica) poses a number of fascinating scientific questions, including the taxonomic status
of postulated subspecies. Here, we obtained and assessed the sequence variation of 411 complete mitogenomes,
mainly from the European H. r. rustica, but other subspecies as well. In almost every case, we observed subspe-
cies-specific haplogroups, which we employed together with estimated radiation times to postulate a model for
the geographical and temporal worldwide spread of the species. The female barn swallow carrying the Hirundo rus-
tica ancestral mitogenome left Africa (or its vicinity) around 280 thousand years ago (kya), and her descendants ex-
panded first into Eurasia and then, at least 51 kya, into the Americas, from where a relatively recent (,20 kya) back
migration to Asia took place. The exception to the haplogroup subspecies specificity is represented by the sedentary
Levantine H. r. transitiva that extensively shares haplogroup A with the migratory European H. r. rustica and, to a
lesser extent, haplogroup B with the Egyptian H. r. savignii. Our data indicate that rustica and transitiva most likely
derive from a sedentary Levantine population source that split at the end of the Younger Dryas (YD) (11.7 kya). Since
then, however, transitiva received genetic inputs from and admixed with both the closely related rustica and the ad-
jacent savignii. Demographic analyses confirm this species’ strong link with climate fluctuations and human activities
making it an excellent indicator for monitoring and assessing the impact of current global changes on wildlife.

© The Author(s) 2022. Published by Oxford University Press on behalf of Society for Molecular Biology and Evolution.
This is an Open Access article distributed under the terms of the Creative Commons Attribution License (https://creativecommons.org/
licenses/by/4.0/), which permits unrestricted reuse, distribution, and reproduction in any medium, provided the original work is properly
cited.                                                                                                                                      Open Access
Mol. Biol. Evol. 39(6):msac113             https://doi.org/10.1093/molbev/msac113                      Advance Access publication May 25, 2022        1
Lombardo et al. · https://doi.org/10.1093/molbev/msac113                                                                 MBE

Key words: barn swallow phylogeny, Hirundo rustica subspecies, mitogenome, haplogroups.

Introduction                                                       clustering that generally corresponds with the subspecies,
                                                                   a certain level of differentiation of the UK population
The barn swallow (Hirundo rustica) is one of the most
widely distributed bird species (Turner and Rose 2010),            (H. r. rustica) from eastern European and Turkish popula-
possibly due to the switch from natural nesting sites, espe-       tions of the same subspecies and genomic covariance of
cially caves, to nesting in human-made structures (Zink            the latter H. r. rustica populations with non-migratory
et al. 2006). This commensal and iconic species for numer-         H. r. transitiva specimens from Israel (Safran et al. 2016).
ous human groups and cultures is portrayed in art, myths,          With a similar approach, molecular evidence of hybridiza-
legends, and poetry for millennia (Green 1988) and com-            tion between subspecies was also obtained (Scordato et al.
prises at least six subspecies, all with breeding ranges in        2017; 2020).

                                                                                                                                        Downloaded from https://academic.oup.com/mbe/article/39/6/msac113/6591937 by guest on 20 June 2022
the Holarctic (but see Areta et al. 2021). The subspecies             In the last few years, whole genome sequencing data have
differ in several morphometric characteristics, such as            been reported for a few subspecies (H. r. erythrogaster,
body size, length of outer tail streamers, ventral coloration,     H. r. savignii) (Safran et al. 2016; Smith et al. 2018), including
and extent of the dark breast band (Turner 2006). The sub-         the first reference genome draft (H. r. rustica) (Formenti
species include H. r. rustica (Europe, North Africa and            et al. 2019). Recently, in the framework of the Vertebrate
Western Asia), H. r. savignii (Egypt), H. r. transitiva (Israel,   Genomes Project, an effort to generate complete and accur-
Lebanon, Jordan and Syria), H. r. tytleri (southern-central        ate genome assemblies for all vertebrate species, a new ref-
Siberia, Mongolia), H. r. gutturalis (central-eastern China,       erence genome for H. r. rustica as well as the first
Japan), and H. r. erythrogaster (North America). Additional        pangenome for the species was released. This allowed the
subspecies such as H. r. saturata and H. r. mandshurica            assessment of the extent of conservation and acceleration
have been postulated in north-eastern Asia, but their dis-         in the barn swallow genome and the identification of a cata-
tinct subspecies status relative to the other Asian subspecies     logue of genetic markers and candidate genomic regions
                                                                   under selection (G. Formenti, data not shown).
is debated (Cheng 1987; Brown and Brown, 1999; Dickinson
                                                                      So far, however, most genetic studies concerning the re-
and Dekker, 2001; Dickinson et al. 2002; Turner 2006; Liu
                                                                   lationships between barn swallow subspecies have focused
et al. 2020). While the Hirundo rustica species complex is
                                                                   on the maternally transmitted and fast-evolving mito-
not endangered, local populations or even subspecies
                                                                   chondrial DNA (mtDNA), particularly on the sequence
show declines due to specific threats, mostly related to agri-
                                                                   variation of single mitochondrial genes, such as ND2 and
cultural intensification (Ambrosini et al. 2012; Møller 2019).
                                                                   CYB (Sheldon et al. 2005; Zink et al. 2006; Dor et al.
Most subspecies are migratory, and their wintering grounds
                                                                   2010, 2012; Malaitad et al. 2016). They confirmed that
cover much of the southern hemisphere as far south as cen-         the barn swallow species complex is monophyletic, and re-
tral Argentina, the Cape province of South Africa, and nor-        vealed that the different subspecies cluster into two major
thern Australia (Turner 2006; Hobson et al. 2015; Liechti          phylogenetic branches, which might have diverged ap-
et al. 2015; Winkler et al. 2017). Adult swallows are highly       proximately 100 thousand years ago (kya) and geographic-
philopatric (Møller 1994), whereas natal dispersal is relative-    ally correspond to Europe-Middle East and Asia-America
ly large, with some individuals, especially females, dispersing    (Zink et al. 2006; Dor et al. 2010), thus substantially predat-
up to several hundreds of kilometers from their natal site         ing human agriculture and the new nesting opportunities
(Turner 2006; Balbontín et al. 2009; Scandolara et al.             provided by human settlements. Moreover, the close rela-
2014). However, H. r. savignii and H. r. transitiva are seden-     tionship between one of the Asian subspecies (H. r. tytleri)
tary throughout the year (Shirihai et al. 1996; Turner 2006;       and the American one (H. r. erythrogaster) has raised the
Turner and Rose 2010), or make short-distance movements            possibility of a secondary dispersal event, possibly about
during the non-breeding period (Kiat, unpublished data).           27 kya, from North America back into Asia (Zink et al.
    The earliest study of barn swallow nuclear DNA vari-           2006). Finally, the potential lack of differentiation between
ation (MUSK gene) did not detect a genetic structure with-         the migratory H. r. rustica and the sedentary H. r. transitiva
in the species, suggesting a rather recent subspecies              was also observed with the fast-evolving mtDNA (Dor et al.
differentiation (Zink et al. 2006). More recent and exten-         2010), suggesting intermingling between the two
sive surveys of microsatellite and double digest                   subspecies.
Restriction-site Associated DNA (ddRAD) sequence data                 Despite the valuable genetic insights provided by these
in H. r. rustica revealed a lack of population structure           studies, the assessment of only a rather short segment of
among breeding populations from Sweden, Germany,                   the barn swallow mtDNA limits their phylogenetic reso-
and Switzerland with no evidence of genomic selection be-          lution and the understanding of this species’ origin and
tween phenotypic migratory types (Santure et al. 2010;             spread. A finer phylogenetic resolution can be achieved
von Rönn et al. 2016). In contrast, genotyping of over             by sequencing the entire mitogenome, an approach
9,000 Single-Nucleotide Polymorphisms (SNPs) in 350                that has been employed for humans and many other ani-
barn swallows from four subspecies revealed genome-wide            mal species (Achilli et al. 2008, 2012; Behar et al. 2012;
2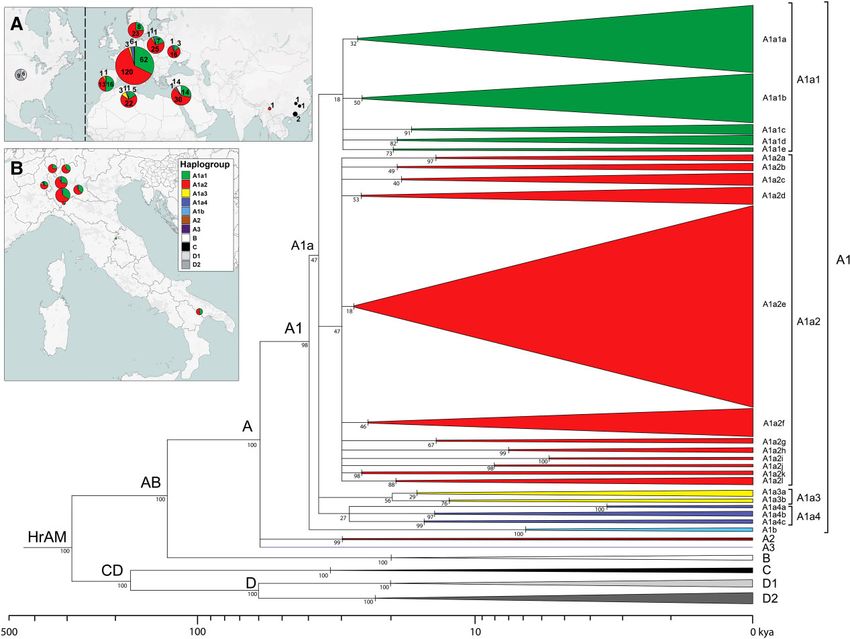
The Barn Swallow Mitogenome Relationships · https://doi.org/10.1093/molbev/msac113                                               MBE
Miao et al. 2013; Morin et al. 2015; Battaglia et al. 2016;              mitogenome (MZ905359), employed as H. r. rustica
Barth et al. 2017; Peng et al. 2018; Cole et al. 2019; de                Reference Sequence (HrrRS), was Sanger sequenced to-
Manuel et al. 2020; Niedziałkowska et al. 2021) and recent-              gether with four additional H. r. rustica mitogenomes
ly pursued also in H. rustica (Carter et al. 2020). Here, we             from Italy (nos. 1, 35, 136, and 302). The mitogenome is
exploited next generation sequencing (NGS) to obtain                     18.143 bps in length and harbors 37 genes: 13 protein-
411 complete mitogenomes, mainly from the European                       coding, 22 tRNA, and two rRNA genes, as well as two non-
H. r. rustica, but also from other subspecies. Phylogenetic              coding regions, CR1 and CR2, following the GO-II gene or-
and Bayesian analyses allowed us to 1) obtain a high-                    der (Mackiewicz et al. 2019; Urantówka et al. 2020)
resolution mitogenome phylogeny of the species, 2) better                (supplementary fig. S1 and supplementary table S2,
define the matrilineal relationships and links between sub-               Supplementary Material online).
species and their divergence times, and 3) assess demog-                    NGS technology was employed to sequence additional
raphy through time.                                                      405 entire barn swallow mitogenomes and another was ex-
                                                                         trapolated from Formenti et al. (2019). These mitogen-

                                                                                                                                                Downloaded from https://academic.oup.com/mbe/article/39/6/msac113/6591937 by guest on 20 June 2022
                                                                         omes were from four putative subspecies (336
Results and Discussion                                                   H. r. rustica, 50 H. r. transitiva, 5 H. r. gutturalis, and 15
                                                                         H. r. erythrogaster); for H. r. rustica, they were from numer-
Organization of the Barn Swallow Mitogenome                              ous sampling locations (fig. 1; supplementary fig. S2 and
Our first complete mitogenome was obtained from a                         supplementary table S1, Supplementary Material online).
H. r. rustica specimen (no. 20) from Italy (supplementary                A total of 387 distinct haplotypes were detected, with
table S1, Supplementary Material online). This                           1,385 variable sites in the coding region (15,601 bps; nps

FIG. 1. Schematic MP phylogeny of Hirundo rustica mitogenomes. This tree was built using the entire mitogenome coding-region (15,601 bps; nps
1–14,859, nps 16,068–16740, nps 18,075–18,143) of 411 barn swallows. It was rooted using H. angolensis (NC_050287) and H. aethiopica
(NC_050293) reference mitogenomes (not displayed). Haplogroups are represented as triangles whose bases are proportional to the number
of mitogenomes. HrAM refers to the Hirundo rustica Ancestral Mitogenome. Different colors were assigned only to major branches.
Bootstrap values (1000 iterations) are shown. The timeline (log10) at the bottom refers to the Bayesian coalescence times of supplementary
table S3, Supplementary Material online. The insets (A) and (B) illustrate the frequencies of the major haplogroups in the different sampling
locations. Inset (B) details frequencies in Italy and Switzerland.

                                                                                                                                           3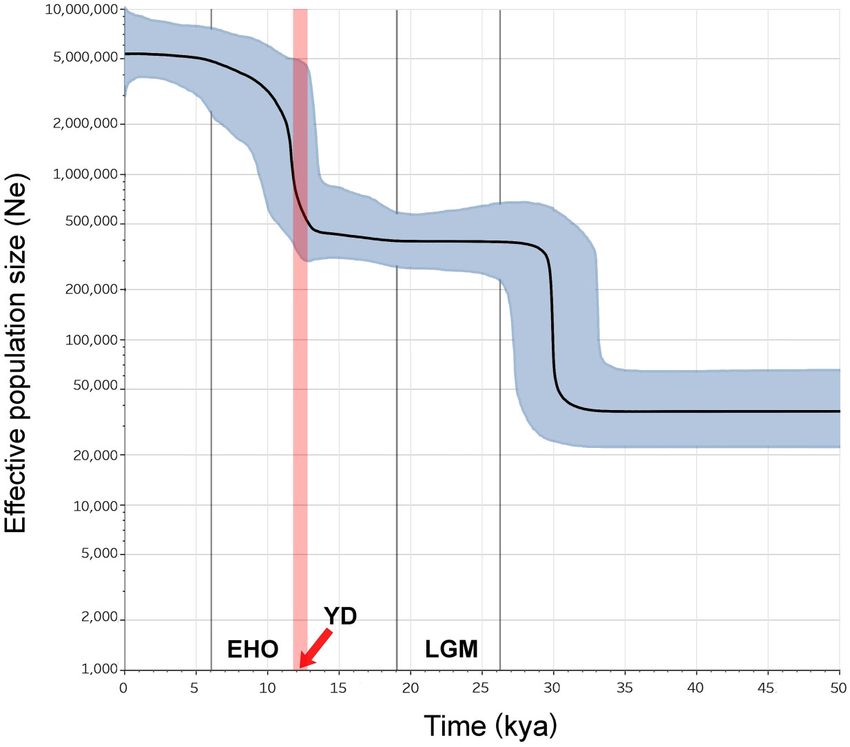
Lombardo et al. · https://doi.org/10.1093/molbev/msac113                                                                   MBE
1–14,859, nps 16,068–16,740, nps 18,075–18,143). On aver-            haplogroups originated from its initial split, the largely pre-
age, 32.8 + 1.0 nucleotide differences were found between            dominant A1 and the rare A2 and A3, with the former har-
any two coding-region sequences. The average π value for             boring two very common sub-branches detected in all
the 411 entire mitogenomes is 0.226% (+0.018%) with the              European locations as well as in Algeria (fig. 1), with mito-
highest variability in the two control regions                       genomes from each location generally scattered and inter-
(Supplementary fig. S3, Supplementary Material online).               mingled with those from the other European locations.
A total of 1102 synonymous and 156 non-synonymous                    Furthermore, we observed that the 46 mitogenomes
mutations were identified in the 13 protein-coding genes              from H. r. transitiva belonging to A (black dots in fig. 2)
(PCGs) (supplementary fig. S4, Supplementary Material                 are also scattered among the H. r. rustica mitogenomes.
online). As expected, all loci harbor more synonymous                   These observations tend to confirm the rather poor gen-
than non-synonymous mutations indicating the action                  etic differentiation of H. r. rustica populations at a high level
of purifying selection (Stewart et al. 2008).                        of molecular and phylogenetic resolution and of
                                                                     H. r. transitiva too, at least for the predominant haplogroup

                                                                                                                                          Downloaded from https://academic.oup.com/mbe/article/39/6/msac113/6591937 by guest on 20 June 2022
                                                                     A component. Our H. r. transitiva sample from Israel would
The Phylogeography of Barn Swallow Mitogenomes                       be essentially indistinguishable from the European
and Haplogroup Ages                                                  H. r. rustica populations, if not for the detection of four hap-
Phylogenetic analyses reveal that all 411 Hirundo rustica            logroup B (8.0%) mitogenomes (fig. 1; supplementary table S1
mitogenomes cluster into four main branches that we                  and supplementary fig. S5, Supplementary Material online). A
named haplogroups A, B, C, and D (fig. 1; supplementary               diffuse and broad overlap of the mtDNA variation between
fig. S5, Supplementary Material online). These mitogen-               H. r. rustica and H. r. transitiva is also confirmed by the hap-
omes derive from a common female ancestor that har-                  logroup A diversity values in the two subspecies, which are
bored the H. rustica ancestral mitogenome (HrAM).                    identical (0.13%) (supplementary table S4, Supplementary
Consistent with previous results, the four haplogroups               Material online). Three possible explanations can be envi-
are included in two primary branches (Zink et al. 2006;              sioned for the extensive mtDNA overlap between rustica
Dor et al. 2010) resulting from the first split in the phyl-          and transitiva. First, the two adjacent subspecies derive
ogeny. One of the branches includes haplogroups A and                from the same ancestral source in which A was the only
B, and the other encompasses haplogroups C and D. We                 (or predominant) haplogroup and was already differentiated
thus named them AB and CD, respectively. As previously               into sub-haplogroups at the time of the initial rustica-
noted (Dor et al. 2010), this division is supported by a             transitiva split. Alternatively, rustica and transitiva maternal
plumage trait, the dark breast band, which is broad and              lineages underwent gene flow, possibly continuously over
complete in the subspecies clustering within the AB                  time. Finally, rustica and transitiva derive from the same an-
branch (H. r. rustica, H. r. transitiva, H. r. savignii), and nar-   cestral population, but also admix; a process that is still going
row or incomplete in those with CD mitogenomes                       on, despite the (growing) differences in migratory behavior,
(H. r. gutturalis, H. r. erythrogaster, H. r. tytleri).              moult strategy (Kiat et al. 2019) and morphology, when mi-
   For all nodes in the phylogeny and the derived hap-               grant rustica individuals pass through the transitiva breeding
logroups and sub-haplogroups, we obtained age estimates              areas at the main time of their breeding season.
both with maximum likelihood (ML) and Bayesian ap-                      Nevertheless, because of the abundance of haplogroup
proaches. The estimates obtained with the two methods                A mitogenomes in our collection, we also detected a cer-
are very similar (supplementary table S3, Supplementary              tain amount of genetic differentiation among populations.
Material online). Thus, for brevity we report here only              Indeed, a number of subclades harbor rather localized geo-
the Bayesian ages.                                                   graphic distributions and appear to be population-specific.
   According to our data, the female barn swallow carrying           These subclades are not uncommon and sometimes they
the HrAM lived 276.9 + 24.3 kya, an almost three-fold age            are relatively ancient: four were found in Spain (2–3 hap-
increase relative to earlier estimates (Zink et al. 2006; Dor        lotypes each) with the oldest (A1a1b3b) dating
et al. 2010). A result of this type was not unexpected.              11.4 ky; 20 in Italy (2–5 haplotypes each) with the oldest
Indeed, by improving the molecular and phylogenetic                  (A1a2g) dating 11.6 ky; one (A1a2d1, 2 haplotypes) in
resolution of mtDNA to the level of entire (or almost en-            Switzerland dating 8.0 ky; two (2 haplotypes each) in
tire) mitogenomes, important age changes for the most re-            Ukraine with the oldest subclade (A1a2e1a2a2) dating
cent common female ancestor were reported in different               7.6 ky; and one (3 haplotypes) in Poland
species (Achilli et al. 2012), including humans (Torroni             (A1a2e1a1a2a1b) dating 6.0 ky. This feature is not exclu-
et al. 2006; Behar et al. 2012).                                     sive to H. r. rustica, but it characterizes also H. r. transitiva:
   Of the four main haplogroups, haplogroup A is by far              two subclades (2–3 haplotypes) with the oldest
the best represented (n = 388) in our sample (figs. 1 and             (A1a2e1a3) dating 11.6 ky (supplementary table S3,
2). It began to radiate 57.1 + 6.4 kya and comprises all mi-         Supplementary Material online).
togenomes from Europe and Algeria (H. r. rustica) as well               With a lower degree of specificity, some geographic
as 46 of the 50 H. r. transitiva mitogenomes from Israel             clustering characterizes also a few more common and
and one from H. r. gutturalis (no. 258) sampled in China             sometimes older branches. For example, sub-haplogroups
(Nujiang Prefecture, Yunnan Province). Three sub-                    A1a1a1a (19.5 ky), A1a2e1a1a5 (11.5 ky), and
4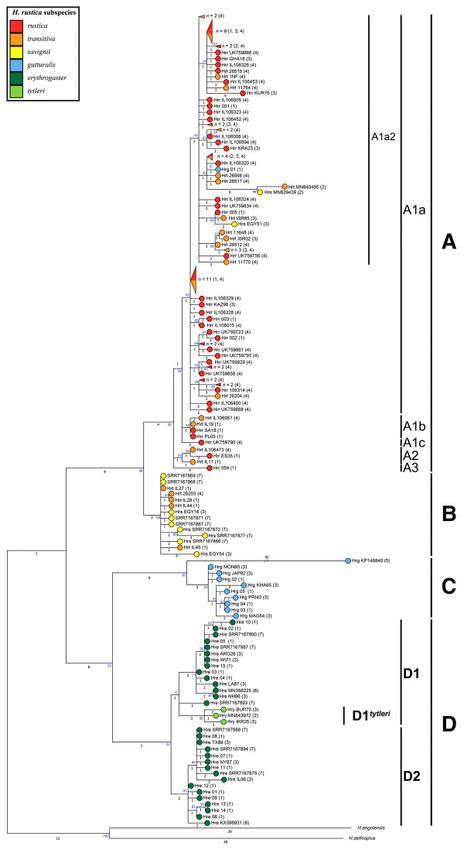
The Barn Swallow Mitogenome Relationships · https://doi.org/10.1093/molbev/msac113                                                    MBE

                                                                                                                                                      Downloaded from https://academic.oup.com/mbe/article/39/6/msac113/6591937 by guest on 20 June 2022
FIG. 2. Schematic MP phylogeny of haplogroup A mitogenomes. This tree was built using the coding regions of 388 mitogenomes belonging to
haplogroup A (fig. 1) and was rooted with the available H. angolensis (NC_050287) and H. aethiopica (NC_050293) reference mitogenomes (not
displayed). Mitogenomes marked in black are from H. r. transitiva specimens sampled in Israel, the one in white (see also red arrow) is from a
H. r. gutturalis sample (no. 258) from China, while all others are from H. r. rustica. Main haplogroup affiliations are shown, with branches colored
according to fig. 1. Branch lengths are proportional to the number of nucleotide substitutions. Bootstrap values (1000 iterations) are shown only
for the deepest nodes. Six country-specific sub-haplogroups are also shown. They are the oldest found in the reported country. Additional details
about samples and mitogenomes are provided in supplementary table S1, Supplementary Material online.

A1a2f1b (11.1 ky) are over-represented in the Danish                        dispersal between populations occurs, in agreement with
population (χ2 [24] = 10.276, 29.752 and 14.970; P =                         observations concerning the behavioral flexibility and
0.0028, 0.0001 and 0.0032, respectively) compared to other                   adaptability of the species (Mead 2002; Turner 2006;
European locations (supplementary fig. S6, Supplementary                      Romano et al. 2017; Teglhøj 2020).
Material online).                                                               While limited by the relatively small size of our popula-
   At the other extreme, we also observed a couple of in-                    tion samples and restricted to haplogroup A mitogen-
stances in which specimens sampled at very distant loca-                     omes, the complete or partial clustering of some
tions harbored the same haplotype (no. 177 from                              sub-haplogroups of A would fit with the generally re-
Denmark and no. 178 from Italy; no. 200 from Poland                          ported short-distance dispersal of offspring from natal to
and no. 201 from Italy). They suggest that long-distance                     breeding sites, although this feature is less extreme in
                                                                                                                                                 5
Lombardo et al. · https://doi.org/10.1093/molbev/msac113 MBE
females compared to males (Balbontín et al. 2009;
Scandolara et al. 2014), thus less detectable in terms of
mtDNA. On the other hand, the general overall sharing
of the haplogroup A branches among H. r. rustica popula-
tions and between H. r. rustica and H. r. transitiva can be at
least in part explained when considering that even short-
distance dispersal can lead to extensive and long-distance
gene flow over the course of generations. Moreover, if the
instances of long-distance dispersal from natal to breeding
sites are confirmed, even at a low percentage, they would
further speed up the loss of genetic structure in European
barn swallow populations.
As for the remaining three major haplogroups, B, C, and
Downloaded from https://academic.oup.com/mbe/article/39/6/msac113/6591937 by guest on 20 June 2022
D (fig. 1; supplementary fig. S5, Supplementary Material
online), the former encompasses only the four
H. r. transitiva mitogenomes already mentioned above
and is dated at 18.9 + 3.9 kya. It shares an ancestral
node (AB; 115.6 + 13.3 kya) with the sister haplogroup
A, which is approximately 40 ky younger than the CD
node (156.4 + 18.0 kya) from which C and D derive.
Haplogroup C includes only H. r. gutturalis samples, four
of the five sampled in China and is dated at 31.1 + 5.7 kya,
while the fifth is a member of haplogroup A. The detection
of haplogroup A in the gutturalis individual might indicate
past or present admixture with rustica, especially when
considering that it was collected in the westernmost
(Nujiang Prefecture) of the sampling locations in China,
the closest to the breeding range of H. r. rustica.
Finally, haplogroup D, dated at 51.1 + 7.9 kya, charac-
terizes all 15 H. r. erythrogaster specimens from North
America (USA, Nebraska), in either one or the other of
its sub-haplogroups (D1 and D2). Haplogroup D age pro-
vides a minimum time for the spread of H. rustica from
Asia to the Americas and indicates that North America
was most likely the nesting ground of the ancestors of FIG. 3. MP phylogeny of Hirundo rustica ND2 and CYB gene se-
H. r. erythrogaster since at least 51 ky ago. quences. This tree includes 155 barn swallows from different subspe-
cies for which both ND2 and CYB gene sequences were available. A
total of 119 are from the literature and the remaining were selected
Subspecies Specificity of the Major Haplogroups from our mitogenome dataset as follows: the first five mitogenomes
To gain a broader view of the haplogroup distribution in that we obtained from H. r. rustica (nos. 1, 20, 35, 136, 302) and the
one from Formenti et al. (2019) (no. 151), all mitogenomes from the un-
the different subspecies, including some not included in common sub-haplogroups of A (A1b, A2, A3; nos. 383–388) and all mi-
our study, we compared the combined ND2 and CYB togenomes belonging to haplogroups B, C and D (nos. 389–411)
gene variation of our mitogenomes with that reported in (supplementary table S1, Supplementary Material online). Sequences
119 barn swallow mtDNAs available from previous studies encompass 2,075 bps, 1,017 bps of ND2 (nps 3,980–4,996) and
(Dor et al. 2010, 2012; Liu et al. 2015, direct submission; 1,058 bps of CYB (nps 13,696–14,753). The tree was rooted using the
H. aethiopica and H. angolensis reference mitogenomes. Main hap-
Keepers et al. 2016, direct submission; Smith et al. 2018; logroup and sub-haplogroup affiliations are shown. Colors identify the
Feng et al. 2020; Carter et al. 2020) (fig. 3). different subspecies. The numbers on the branches indicate the number
The phylogeny of fig. 3 confirms that haplogroup A is typ- of distinguishing mutations while the numbers in parentheses refer to
ical of both H. r. rustica and H. r. transitiva, with H. r. transitiva the following publication sources: 1) this study; 2) Carter et al. (2020);
mitogenomes scattered among those of H. r. rustica in virtu- 3) Dor et al. (2010); 4) Dor et al. (2012); 5) Liu et al. (2015), direct sub-
mission; 6) Keepers et al. (2016), direct submission; 7) Smith et al. (2018);
ally all sub-haplogroups of A. Moreover, it reveals that the 8) Feng et al. (2020). Sequences not covering the aforementioned ND2
four haplogroup B mitogenomes observed in H. r. transitiva and CYB gene ranges were not included, as well as sequences that har-
form a clade that is defined by the transitions at nps bored gaps at informative nucleotides. The two mtDNAs forming the
14,235 and 14,243 in CYB. This branch encompasses also an rather long sub-branch (6 mutations) within A1a2, one from
additional H. r. transitiva specimen (Dor et al. 2012) and H. r. savignii, and one from H. r. transitiva (Carter et al. 2020), most likely
contain erroneous mutations as their mitogenome sequences harbored
nine of eleven H. r. savignii (Dor et al. 2010; Smith et al. NUMTs (see Materials and Methods). A similar problem characterizes
2018). This high frequency of haplogroup B in H. r. savignii in- the H. r. gutturalis sequence KP148840 (Liu et al. 2015, direct submission)
dicates that haplogroup B is typical of the sedentary Egyptian with its 81 mutations branch.
6The Barn Swallow Mitogenome Relationships · https://doi.org/10.1093/molbev/msac113 MBE
subspecies. Moreover, the detection of some B mitogenomes Population expansion has been documented during
in transitiva and some A mitogenomes in savignii (fig. 3) ap- postglacial periods of many other bird populations, in par-
pears to indicate that gene flow of maternal lineages is not allel with and thanks to their northward range expansion
restricted to transitiva and rustica, but it also occurs between (Milá et al. 2006; Zink and Gardner 2017). Migratory be-
transitiva and savignii, and possibly also between rustica and havior might have both resulted from and played a role
savignii. These and other alternative scenarios cannot be dis- in this population expansion. Glacial cycles act as switches
tinguished without nuclear genome data. for the evolutionarily labile migratory behavior. Lacking a
As for haplogroup C (n = 10), the phylogeny confirms suitable habitat, species would retreat to their wintering
instead its complete subspecies specificity. It includes ranges during glacial maxima and revert back to long-
only H. r. gutturalis specimens: the four from China of distance migration during interglacial periods (Zink and
this study (nos. 393–396), one from Japan, three from Gardner 2017). Our results on haplogroup A mitogenomes
Russia, one from Mongolia (Dor et al. 2010), and one of are consistent with H. r. rustica ancestors expanding north-
an undefined Asian origin (Liu et al. 2015, direct ward from the eastern Mediterranean basin, which might
Downloaded from https://academic.oup.com/mbe/article/39/6/msac113/6591937 by guest on 20 June 2022
submission). have acted as a refugium during the LGM and the YD.
A more complex situation concerns haplogroup D. The H. r. transitiva would then have mainly derived from speci-
phylogeny of fig. 3 supports the exclusive affiliation of all mens/populations that maintained their sedentary behav-
H. r. erythrogaster specimens (n = 30) to haplogroup D: ior, while H. r. rustica would descend from those that
the 15 from Nebraska of this study (nos. 397–411), add- differentiated and re-acquired a long-distance migratory
itional 14 from the USA (Dor et al. 2010; Keepers et al. behavior while expanding northward at the end
2016, direct submission; Smith et al. 2018), and one from (11.7 kya) of the YD. These climatic changes, and pos-
Argentina (Dor et al. 2010). As already shown by the phyl- sibly the increase in energy consumption associated with
ogeny of entire mitogenomes, they all belong to either sub- the re-acquisition of the long-distance migratory behavior,
haplogroups D1 or D2, whose ages are estimated at 19.7 + appear to strongly affect the extent to which selection
3.9 kya and 20.6 + 3.4 kya, respectively (supplementary modulates the evolution of mitochondrial PCGs
table S3, Supplementary Material online). (supplementary fig. S4, Supplementary Material online).
However, ND2 and CYB sequences are available also for Taking the end of the YD (11.7 kya) as a cut-off in the
three H. r. tytleri specimens (Dor et al. 2010; Carter et al. phylogeny, it is evident that the ratio of divergence at non-
2020), an Asian subspecies that was not included in our synonymous and synonymous sites (dN/dS) is much high-
survey of entire mitogenomes. The three H. r. tytleri partial er when considering only variants accumulated after the
mtDNA sequences appear to form a private sub- YD (0.19 vs. 0.08, Fisher exact test P-value = 0.0001). This
haplogroup within D1, which we named D1tytleri (fig. 3). is particularly evident for genes encoding subunits of
It is a sister branch to the D1 branches of OXPHOS complexes I and V, thus supporting scenarios
H. r. erythrogaster, thus supporting the previously pro- linking heat production and avian flight ability with mito-
posed close relationship between H. r. tytleri and genome variation (Shen et al. 2009; Zhong et al. 2020).
H. r. erythrogaster as well as an American origin of the an- Such a scenario would explain the sharing of hap-
cestral mitogenomes of H. r. tytleri (Zink et al. 2006; Dor logroup A by rustica and transitiva and many of its sub-
et al. 2010, 2012). Moreover, taking into consideration branches and the “intermingling” of their haplotypes with-
that D1 arose approximately 20 kya, we have now a max- in these clades (fig. 2). However, it would also explain the
imum age boundary for the back migration from North detection of A sub-haplogroups within localized popula-
America: the ancestors of H. r. tytleri did not move to tions in Europe (H. r. rustica). The oldest are in the
Asia earlier than 20,000 years ago. As for the minimum Mediterranean area, A1a2g in Italy and A1a1b3b in Spain
boundary for this event, it will be defined only by sequen- (fig. 2), with ages of 11.6 ky and 11.4 ky, respectively.
cing H. r. tytleri mitogenomes. Thus, they arose shortly after the end of the YD. In con-
trast, the population-specific sub-haplogroups detected
further north in Europe arose later with a south to north
time profile: A1a2d1 in Switzerland (8.0 ky),
The Demography of Barn Swallows Over Time A1a2e1a2a2 in Ukraine (7.6 ky) and A1a2e1a1a2a1b in
The Bayesian skyline plot of fig. 4 shows changes in the ef- Poland (6.0 ky). Their ages suggest that they arose in
fective population size over time for haplogroup A, which situ when these different European regions became suit-
is typical of western Eurasia and by far the most repre- able as nesting grounds. There is also a Levantine counter-
sented in our survey encompassing all H. r. rustica mito- part to the European-specific sub-haplogroups. This is
genomes and 92% of those from H. r. transitiva. It represented by A1a2e1a3, the oldest transitiva-specific
underwent two population growth events. The first, very sub-haplogroup, which is dated at 11.6 kya, again imme-
sharp increase occurred 30 kya, prior to the last glacial diately after the YD, underscoring its role in the differenti-
maximum (LGM). This was followed by a plateau through- ation of rustica and transitiva.
out the LGM and up to the YD (12.9–11.7 kya), when the The chronological gradient from south to north sug-
second increase began, lasting until the end of the Early gests a history of northward expansion from the Near
Holocene Optimum (EHO) 6 kya (Baker et al. 2017). East or the Mediterranean basin at large. This is supported
7Lombardo et al. · https://doi.org/10.1093/molbev/msac113 MBE
Downloaded from https://academic.oup.com/mbe/article/39/6/msac113/6591937 by guest on 20 June 2022
FIG. 4. BSP of haplogroup A mitogenomes. The plot considers the 388 haplogroup A mitogenomes listed in supplementary table S1,
Supplementary Material online. These include all H. r. rustica mitogenomes and 92% of those from H. r. transitiva. The black line indicates
the median estimate of the effective population size and the blue shading shows the 95% highest posterior density limits. The time axis is limited
to 50 kya, beyond which the curve remains flat.
by the negative correlation between nucleotide diversity diversity and supports a relatively slow northward spreading
and latitude that we observed in H. r. rustica and —the so-called “phalanx-model” of colonization, as op-
H. r. transitiva populations, which encompass most of posed to a “pioneer model” (Nichols and Hewitt 1994;
our dataset and were more densely sampled, when they Excoffier et al. 2009). Such a slow expansion is a feature of
were grouped into the following macro-groups: South species with short dispersal, strict requirements for habitat,
(Algeria, Spain, South Italy and Israel), Center (North and/or dependency on other species (Hewitt 2004). Barn
Italy and Switzerland), and North (Poland, Ukraine and swallows preferentially nest in human structures and are
Denmark) (supplementary fig. S7, Supplementary closely associated with human agriculture. Their association
Material online). For haplogroup A1, a correlation with slow-moving agriculturalists might explain the age gra-
(P-value ,0.05) close to 1 was detected, thus confirming dient from south to north Europe that we observed for the
the overall reduction of mitogenome variation from population-specific subclades. The first evidence of human
South to North, as expected in models envisioning a built structures dates to around 12–15 kya (Potts 2012),
more recent origin of central and northern European and the expansion of agriculture from the Middle East
populations. might have begun as early as 12–13 kya (Salamini et al.
Recolonization of Europe from refugia following glacial 2002; Arranz-Otaegui et al. 2016). Thus, the second popula-
retreat has been documented in a variety of species tion increase is compatible with a role for rising tempera-
(Hewitt 1999, 2000; Hansson et al. 2008). The pattern of tures at the beginning of the Holocene 12 kya (Taberlet
ever younger population-specific sub-haplogroups sug- et al. 1998) as well as for the association with human settle-
gests a post-glacial expansion without major loss of genetic ments (Smith et al. 2018).
8The Barn Swallow Mitogenome Relationships · https://doi.org/10.1093/molbev/msac113 MBE
Downloaded from https://academic.oup.com/mbe/article/39/6/msac113/6591937 by guest on 20 June 2022
FIG. 5. A model for the geographical and temporal spread of barn swallows. Map showing time divergence and hypothetical splits and diffusion
routes of barn swallow haplogroups prior to the Younger Dryas and the subsequent climatic changes. The dashed grey circle indicates the pos-
sible homeland of the Hirundo rustica ancestral mitogenome (HrAM), while the other dashed circles indicate zones where two haplogroups are
currently found, possibly indicating recent admixture between subspecies. Colors indicate the breeding ranges of the eight postulated barn swal-
low subspecies, while striped areas indicate wintering ranges (modified from Turner 2006).
On the Origin of Barn Swallows we employed this “magnifying glass” approach to recon-
Previous comparisons of mtDNA variation in barn swal- struct the genetic history of an iconic species, the barn
lows, along with that seen in their closest relatives (Dor swallow. Mitogenome data allowed us to build a detailed
et al. 2010; Carter et al. 2020), have suggested that the an- phylogeny for the species, to determine its coalescence
cestor of all Hirundo species most likely originated in time as well as the ages of its haplogroups, and to better
Africa, as most of them have African distributions, includ- define the matrilineal relationships between subspecies.
ing H. aethiopica and H. angolensis that are the closest re- According to our data, the female barn swallow carrying
latives to H. rustica (Carter et al. 2020). HrAM lived 276.9 + 24.3 kya, which is much earlier than
We further assessed this issue by adding the mitogen- previously thought (Zink et al. 2006; Dor et al. 2010;
omes from other Hirundo species to the phylogeny of Scordato et al. 2017). Considering that, due to its reduced
our barn swallows. The combined tree confirms that the effective population size, mtDNA is much more prone to
closest species are all from Africa (H. aethiopica, lineage loss and founder events than its autosomal coun-
H. angolensis, H. nigrita, H. smithii, and H. albigularis), terpart, an almost 300 ky of mtDNA divergence implies
thus supporting Africa as the ancestral continental source an even older divergence time for most nuclear genes.
of H. rustica, and dates the divergence between H. rustica This allows for plenty of polymorphism in the species com-
and H. aethiopica, the closest species, at about 493 kya plex and, probably, a rather extensive differentiation of its
(supplementary fig. S8, Supplementary Material online). nuclear genome, thus explaining the observed flexibility
However, it is possible that, when the HrAM arose and adaptability.
280 kya, the H. rustica population from which all modern In most cases, we observed complete subspecies and
H. rustica mitogenomes derive had already left Africa and geographic specificity of mitogenome haplogroups, aris-
entered into Eurasia. ing at different times and different places, which we em-
ployed together with estimated radiation times to
postulate an overall model for the geographical and tem-
poral spread of barn swallows (fig. 5). According to the
Conclusions mtDNA data, this species left Africa (or its vicinity) al-
Over the course of years, numerous studies have shown most 300 kya, expanded first into Eurasia and then, at
that the information contained in mtDNA is phylogenet- least 51 kya, into the Americas, from where a relatively re-
ically best exploited when the sequence variation of the cent (,20 kya) back migration to Asia took place.
entire (or almost entire) mitogenome is assessed and the Subspecies differentiation occurred in parallel to the spe-
sequencing survey is carried out on numerous specimens cies dispersal, usually much earlier than previously sug-
sampled throughout the species distribution range. Here gested (Smith et al. 2018).
9Lombardo et al. · https://doi.org/10.1093/molbev/msac113 MBE
The notable exception to the haplogroup subspecies H. r. rustica), Israel (n = 50; H. r. transitiva), China (n = 5;
specificity is represented by the sedentary Levantine H. r. gutturalis), and the USA (Nebraska) (n = 15;
H. r. transitiva that extensively shares haplogroup A with H. r. erythrogaster). H. r. rustica were sampled in Denmark
the migratory H. r. rustica and haplogroup B, to a lesser ex- (n = 31), Italy (n = 171), Poland (n = 35), Spain (n = 31),
tent, with the Egyptian H. r. savignii. We propose that rus- Switzerland (n = 20), Ukraine (n = 20), and Algeria (n =
tica and transitiva derive from the same population source, 32), (supplementary fig. S2, Supplementary Material online).
which was located in the Levant and had adapted to se- We extracted DNA either from tissues (muscle or liver) of
dentarism during the LGM. Our data indicate that the specimens found dead (nos. 1, 20, 35, 58, 136, 302) or blood
two subspecies began to split rather recently, shortly after (all remaining samples). We obtained blood samples, under
11.7 kya at the end of the YD. H. r. rustica would descend license according to national guidelines and legislation, by
from individuals that re-acquired the long-distance migra- capturing individuals with mist-nets at the barns and cow-
tory behavior while expanding northward to regions that sheds where barn swallows spend the nights during breed-
were then becoming suitable as nesting grounds. In con- ing. Venipuncture of the brachial vein, a minimally invasive
Downloaded from https://academic.oup.com/mbe/article/39/6/msac113/6591937 by guest on 20 June 2022
trast, H. r. transitiva would derive from the Levantine com- technique (Arctander 1988), was performed to draw blood.
ponent that remained in situ and maintained its sedentary Blood samples were collected and stored either in hepari-
behavior. Since then, however, transitiva did not remain nized glass capillaries or dehydrated in ethanol. Blood sam-
genetically isolated, receiving genetic inputs and admixing ples from Spain and Nebraska arrived in Sodium-EDTA
with migratory rustica populations, as shown by the ab- buffer. Detailed information on the barn swallow samples
sence of significant correlations between genetic and geo- and their mitogenomes is provided in supplementary
graphic distances when assessing the shared haplogroups table S1, Supplementary Material online.
(supplementary fig. S9, Supplementary Material online), At the time when the analyses were performed, there
as well as the adjacent savignii. were nine entire H. rustica mitogenomes in GenBank.
This scenario, which is compatible with the presence of However, none of these could be included in our analyses
some haplogroup B mitogenomes in transitiva as well as its of entire mitogenomes due to the following sequence issues:
behavioral phenotype, is also supported by field and KX398931 (H. r. erythrogaster, Keepers et al. 2016, direct sub-
phenotypical observations (Ambrosini et al. 2009; Reiner mission), a small nuclear mitochondrial (NUMT) sequence
Brodetzki et al. 2021), including the expression in in ND4; MN356225 (H. r. erythrogaster, Feng et al. 2020,
H. r. transitiva of both elongated tail streamers and dark lack of CR1, MP, ND6, and ME; MN843972 (H. r. tytleri),
ventral coloration. The first feature is shared with rustica, MN829439 (H. r. rustica), MN830163 (H. r. savignii),
but not its function as a sexual signal, and the second is MN954681, and MN840495 (H. r. transitiva), presence of
shared with savignii (Vortman et al. 2011). Genetic admix- NUMTs in ND5 (Carter et al. 2020); MN909724
ture is also a plausible explanation for the detection of (H. r. gutturalis, Thirouin et al. 2020, direct submission), large
haplogroup A in one of the five H. r. gutturalis specimens insertion in RNR2, many gaps throughout the sequence, two
from China. large NUMTs in ND3 and ND5; and KP148840
Finally, Hirundo rustica has been strongly affected by cli- (H. r. gutturalis, Liu et al. 2015, direct submission), numerous
matic changes in the past. At the beginning of the NUMTs throughout the sequence. In addition, we extracted
Holocene, its population size began to grow extensively 16 low-coverage mitogenomes (eight from H. r. savignii and
in parallel with temperature increases, and this growth eight from H. r. erythrogaster) from the PRJNA323498
was probably facilitated by the concomitant spread of agri- BioProject (Smith et al. 2018). They also harbored many
culture and human built structures. It is also evident that gaps. However, most of these samples (n = 22) could be em-
climatic changes occurring during the LGM and the YD, ployed in the phylogenetic analyses of ND2 and CYB gene
and the possible resulting changes in migratory behavior, sequences (see below).
significantly affected the extent to which selection modu-
lates gene sequence evolution, to a degree that is compar-
able with that reported in Neolithic animal domestication DNA Extraction
(Colli et al. 2015). The strong link of this widespread spe- We obtained genomic DNA extracted from muscle or liver
cies with climate fluctuations and human activities makes with the ReliaPrep™ (Promega Madison, WI, USA) gDNA
it an excellent indicator for monitoring and assessing the Tissue kit, using the standard protocol for animal tissue.
impact of current global changes on wildlife. We extracted and purified blood samples using phenol-
chloroform. These samples were prepared by breaking
1–2 cm of the glass capillary containing the blood
Materials and Methods (4 μl) and placing it overnight at 56°C in a 2 ml tube con-
taining: lysis buffer B (400 mM Tris-HCl, pH 8.0; 100 mM
Samples Analysed for Mitogenome Variation EthyleneDiamine Tetra-Acetic acid [EDTA], pH 8.0; 1%
We completely sequenced a total of 410 barn swallow mi- Sodium Dodecyl Sulfate [SDS]), 250 µl of TBS buffer
togenomes. An additional H. r. rustica sample from Italy (20 mM Tris-HCl, pH 7.5; 150 mM NaCl), and 40 µl of
(no. 151) was extrapolated from Formenti et al. (2019). Proteinase K (20 mg/ml). Samples from Spain and
Samples were collected from Europe and Algeria (n = 340; Nebraska were instead extracted with magnetic beads on
10The Barn Swallow Mitogenome Relationships · https://doi.org/10.1093/molbev/msac113 MBE
a 16 Maxwell® RSC 16 instrument using the dedicated (30 s), 58°C (30 s), 65°C (7 min), followed by 10 cycles at
Blood DNA Kit (Promega) and employing the “Blood 94°C (30 s), 55°C (30 s), 65°C (7 min), and a final extension
DNA” protocol. Sample preparation in this case was per- at 72°C (10 min). PCR products were checked by electro-
formed by adding 1–2 μl of blood to 300 μl of lysis buffer phoresis on 1% agarose gels. PCR purification was per-
and 30 μl Proteinase K and incubating overnight at 56°C. formed with the membrane method, Presto™ 96 Well
Genomic DNAs were eluted into TE buffer (10 mM PCR Cleanup Kit (Geneaid). Amplicons were quantified
Tris-Cl, 1 mM EDTA) or elution buffer (Promega). with the Quantus™ fluorometer (Promega) using the
QuantiFluor® ONE dsDNA system. One nanogram for
Sanger Sequencing each of the three amplicons were combined for library
preparation. The sequencing library was prepared with
The first five barn swallow mitogenomes that we obtained
the Nextera™ DNA Flex Library Prep, following the man-
(nos. 1, 20, 35, 136, and 302) were Sanger sequenced. We
ufacturer’s protocol steps: tagmentation of input DNA,
designed an initial set of oligonucleotide pairs (not shown)
amplification of tagmented DNA with the addition of pre-
using partial sequences of H. r. rustica mtDNA genes
Downloaded from https://academic.oup.com/mbe/article/39/6/msac113/6591937 by guest on 20 June 2022
mixed dual-indexed adapters (IDT® for Illumina Nextera
(mainly RNR1, RNR2, ND2, CO1, and CYB) available in
UD indexes or Nextera™ DNA CD Indexes), and PCR
GenBank using the Primer3Plus software (Untergasser
clean-up. Libraries were then checked on a 2% agarose
et al. 2012) (https://www.primer3plus.com/). Then, by
gel, quantified using the Quantus™ fluorometer
using a primer walking approach, we designed a set of
(Promega), normalized and pooled together. We then
oligonucleotide pairs that allowed the amplification of
run the pooled normalized library on the 4150
the entire mitogenome in 11 overlapping Polymerase
TapeStation System (Agilent) and diluted to 4 nM using
Chain Reaction (PCR) fragments (supplementary table
RSB resuspension buffer. Five microliter of pooled libraries
S5, Supplementary Material online) and a set of 33 add-
were denatured using 5 μl of freshly prepared NaOH
itional oligonucleotides for sequencing (supplementary
(0.2N) and diluted to the loading concentration of 6 pM
table S6, Supplementary Material online). This allowed
(600 μl final volume) using HT1 hybridization buffer.
the amplification and sequencing of mitogenome no. 20,
This was finally sequenced on a MiSeq system (Illumina)
our first H. r. rustica complete mitogenome. The other
using paired-end sequencing either with the MiSeq
four mitogenomes (nos. 1, 35, 136, and 302) were then ob-
Reagent Kit v2, (2 × 150 or 2 × 250 cycles) or the MiSeq
tained by carrying out PCR reactions with a standard reac-
Reagent Kit v2 Nano (2 × 150 cycles). We also NGS se-
tion mix (25 µl) containing 1X Buffer (1.5 mM MgCl2),
quenced mitogenome no. 20 (HrrRS) and the other four
0.2 mM of each dNTP, 0.6U of GoTaq G2 Polymerase
samples already Sanger sequenced (nos. 1, 35, 136 and
(Promega), 0.2 µM of each primer, and 20–30 ng of
302), fully confirming the initial Sanger sequences.
DNA, using the following PCR conditions: 94°C (2 min);
35 cycles of 94°C (30 s), 55°C (30 s), 72°C (2 min), and a fi-
nal extension of 72°C (10 min). PCR products were visua- Analysis of Mitogenome Sequence Data
lized on a 1% agarose gel and amplicons were sequenced The raw MiSeq sequencer data were output in BCL format,
with standard dideoxy sequencing using BigDye v3.1 demultiplexed, and converted to FASTQ format with the
Chemistry (Applied Biosystems) on 3730xl and 3130xl Illumina® bash package, bcl2fastq2 Conversion Software
Genetic Analyzer (Applied Biosystems) following the man- v2.20, and trimmed with Trim Galore! v 0.6.4 (Krueger
ufacturer’s protocol. Mitogenome no. 20 (MZ905359) was 2012) to remove low-quality reads and adapters. We
employed as the HrrRS. We then obtained the locus map checked the quality of paired end reads by using FastQC
of the barn swallow (supplementary fig. S1, Supplementary v 0.11.9 (Andrews 2010). Files were subsequently con-
Material online) using the CGview Server (Grant and verted from FASTQ to BAM by aligning and mapping
Stothard 2008). the reads to the mitogenome no. 20 (HrrRS) using BWA
v0.7.17 (Li 2013, direct submission). BAM files were ana-
lysed with Geneious 8.1.5 (Biomatters, Kearse et al.
NGS Sequencing
2012). Variant calling was performed by setting the thresh-
We obtained 405 additional barn swallow mitogenomes by
old for heteroplasmies at 30% of reads and considering
NGS sequencing and extrapolated one more from
only mutations in the range 30%–70% as heteroplasmic
Formenti et al. (2019). We designed a set of three oligo-
in phylogenetic analyses. Mitogenomes employed in the
nucleotide pairs with similar Tm (60°C) and length
phylogenetic analyses were completely sequenced with
(20 nt) (supplementary table S7, Supplementary Material
an average depth of 459X. Finally, samples were exported
online) to amplify the entire mtDNA molecule in three
in the standard FASTA format.
overlapping, long range PCR fragments of comparable
lengths (6400 bps). Each fragment overlapped the next
one by about 300–500 bps. PCRs were carried out in Phylogenetic Analyses and Age Estimates of MtDNA
50 µl reaction mix containing 1x GoTaq® Long PCR Haplogroups
Master Mix (Promega), 0.3 μM of each primer and We built a maximum parsimony (MP) tree by manually
150 ng of DNA template, using the following 2 step programming the software mtPhyl v 5.003 (Eltsov and
PCR thermal profile: 94°C (2 min); 20 cycles at 94°C Volodko 2014) for the analysis of barn swallow
11Lombardo et al. · https://doi.org/10.1093/molbev/msac113 MBE
mitogenomes (the modified.txt files are available on re- both haplotype diversity (HD) and nucleotide diversity (Pi)
quest). By comparing the mtDNA FASTA sequences to for the most represented haplogroups (A1 as a whole as
the HrrRS, the software allowed for the reconstruction of well as its major sub-haplogroups A1a1 and A1a2) using
a coding-region (15,601 bps; nps 1–14,859, nps 16,068– DNAsp 6.12.03 (Rozas et al. 2017). Both indices were com-
16,740, nps 18,075–18,143) MP tree with detailed informa- pared with the average of the latitudes among the samples
tion concerning mutations (supplementary fig. S5, of each population using the software Tableau 2021.4
Supplementary Material online). We did not consider in- (https://www.tableau.com/).
dels for tree construction. The tree was rooted using the
available Hirundo angolensis (NC_050287) and Hirundo Isolation by Distance
aethiopica (NC_050293) reference mitogenomes, and its
To assess isolation by distance (IBD), genetic distance ma-
topology was also confirmed by using the
trices were created based on PhiSt, which was computed
software Molecular Evolutionary Genetics Analysis X
using the R package haplotypes (Aktas 2020), while pair-
(MEGAX) (figs. 1 and 2) (Kumar et al. 2018).
wise geographic distances were calculated with the geodist
Downloaded from https://academic.oup.com/mbe/article/39/6/msac113/6591937 by guest on 20 June 2022
We estimated ML and Bayesian ages of haplogroups and
R package (Padgham and Sumner 2021), applying the geo-
sub-haplogroups by using all barn swallow (n = 411)
desic methods provided in (Karney 2013). We tested the
coding-region sequences (15,601 bps). We performed ML
correlations between genetic and geographic matrices
estimations using the BaseML package present in the
for the most represented haplogroups (A1 as a whole as
PAMLX 1.3.1 software (Xu and Yang 2013) assuming the
well as its major sub-haplogroups A1a1 and A1a2) using
HKY85 (Hasegawa et al. 1985) mutation model with
a Mantel test and simple linear regression, to also account
gamma-distributed (32 categories) rates (plus invariant
for possible type II errors (Teske et al. 2018). The Mantel
sites) and 17 partitions (13 for protein coding genes, 1
test was performed using the R package ade4 (Dray and
for tRNAs, 1 for each rRNA gene, and 1 for intergenic re-
Dufour 2007) with 999 permutations. This program tests
gions) using the predefined tree obtained by the MP ap-
for significant IBD by comparing the observed correlation
proach. We converted ML mutational distances into
with a histogram of simulated correlation categories and
years by assuming an estimated split time between
their frequency under the assumption of no IBD. Simple
Progne (not shown) and Hirundo at 9.34 Mya (95% CI:
linear regression was performed in the stats package (R
5.8–13.2 Mya) (Moyle et al. 2016), thus employing the
Core Team 2021). We generated plots in R using the pack-
standard approach that does not include the error on
age ggplot2 (Wickham 2016).
the calibration point.
We performed Bayesian estimations using the
software Bayesian Evolutionary Analysis Sampling Trees Supplementary Material
(BEAST) 2.6.0 (Bouckaert et al. 2019) under the HKY sub-
stitution model (gamma-distributed rates plus invariant Supplementary data are available at Molecular Biology and
sites) with a relaxed clock (log normal). We entered as Evolution online.
prior the clock value of 2.45 × 10⁻⁸ base substitution
per nucleotide per year (or one mutation every 2616
years), derived from the rate calculated in the ML method.
Acknowledgments
The chain length was established at 100,000,000 iterations, We dedicate this study to the late Nicola Saino, who great-
with samples drawn every 1,000 Markov chain Monte ly contributed to its initial conception, planning, and sam-
Carlo steps after a discarded burn-in of 10,000,000 steps ple collection. We thank Dan Liang and Yanyan Zhao for
(Olivieri et al. 2017). We performed the demographic ana- sampling. This research received support from the Italian
lysis on the BEAST results using Tracer v1.7.1 (Rambaut Ministry of Education, University and Research (MIUR):
et al. 2018) and Excel using a generation time of one the project PRIN2017 2017CWHLHY (A.T. and L.G.) and
year. We constructed Bayesian skyline plots (BSPs) using Dipartimenti di Eccellenza Program (2018–2022)—
the output tree file and a stepwise constant. Department of Biology and Biotechnology “L.
To assess the subspecies specificity of major hap- Spallanzani” University of Pavia (to A.O., O.S., A.A., L.F.
logroups in a wider sample encompassing also previously and A.T.); National Science Centre DEC-2013/09/B/NZ8/
published sequences, we built a MP tree based on ND2 03321 (to P.M.); Junta de Extremadura/FEDER reference
(1,017 bps; nps 3980–4996) and CYB (1,058 bps; nps IB20089 (to A.M.); and the “Fondazione Adriano Buzzati
13696–14753) gene sequences (fig. 3), for a total of – Traverso” for the L. Luca Cavalli-Sforza fellowship (to
2075 bps. We aligned sequences with MEGAX and rooted N.R.M).
the tree using the H. aethiopica (NC_050293) and H. ango-
lensis (NC_050287) reference mitogenomes.
Author Contributions
A.T., G.F., and L.G. conceived the project; A.T., A.O., and L.F.
Mitogenome Diversity and Latitude planned the experimental approach and supervised ex-
To identify a potential correlation between mitogenome periments/computational analyses and data; G.L. per-
diversity (entire mitogenomes) and latitude, we measured formed experiments and computational analyses with
12You can also read