The music that people use to sleep: universal and subgroup characteristics
←
→
Page content transcription
If your browser does not render page correctly, please read the page content below
The music that people use to sleep: universal and subgroup characteristics

  Rebecca Jane Scarratt1,3, Ole Adrian Heggli2,4, Peter Vuust2,5 & Kira Vibe Jespersen2,6*

                   1
                     Radboud University, Nijmegen, The Netherlands
                   2
                     Center for Music in the Brain, Department of Clinical Medicine, Aarhus
                   University & The Royal Academy of Music Aarhus/Aalborg, Aarhus,
                   Denmark
                   3
                     ORCID: https://orcid.org/0000-0002-6971-6977
                   4
                     ORCID: https://orcid.org/0000-0002-7461-0309
                   5
                     ORCID: https://orcid.org/0000-0002-4908-735X
                   6
                     ORCID: https://orcid.org/0000-0002-7183-3849

                   *Corresponding author at kira@clin.au.dk
Abstract Sleep problems are increasing in modern society. Throughout history, lullabies have been used to soothe the sleep of children, and today, with the increasing accessibility of recorded music, many people report listening to music as a tool to improve sleep. Nevertheless, we know very little about this common human habit. In this study, we elucidate the characteristics of music used for sleep by extracting the features of a large number of tracks (N = 225,927) from 989 sleep playlists retrieved from the global streaming platform Spotify. We found that compared to music in general, music used for sleep is softer and slower; it is more often instrumental (i.e. without lyrics) and played on acoustic instruments. Yet, a large amount of variation was found to be present in sleep music, which clustered into six distinct subgroups. Strikingly, three of these subgroups included popular mainstream tracks that are faster, louder, and more energetic than average sleep music. The findings reveal previously unknown aspects of sleep music and highlight the individual variation in the choice of music for facilitating sleep. By using digital traces, we were able to determine the universal and subgroup characteristics of sleep music in a unique, global dataset. This study can inform the clinical use of music and advance our understanding of how music is used to regulate human behaviour in everyday life.
I. Introduction
Despite sleep being essential for human health and well-being, sleep problems are increasing
in modern society 1–3. Although some people seek professional help for their sleep problems,
many people choose to initiate self-help strategies such as listening to music 4–6. Indeed,
epidemiological studies show that up to 46% of respondents indicate that they use music to
help themselves fall asleep 6–8 which can significantly improve sleep across adult populations
9,10
. Despite the widespread use of music as sleep aid, it is not well understood what defines the
music that people use to sleep. Are there specific universal features characterising music used
for sleep? Or may music be used as sleep aid independently of its musical features? In this
study, we address these questions using big data from the global streaming service Spotify.
The habit of using music for sleep improvement may be rooted in the ubiquitous propensity of
caregivers to sing lullabies to their babies 11,12. Lullabies are often sung to babies to assist with
falling asleep and research indicates that even unfamiliar lullabies from different cultures
decrease arousal, heart rate and pupil size in babies 13. As such, it has been hypothesised that
music facilitates sleep by reducing arousal 14–16. This may be physiologically, through a
pleasurable emotional response, or by acting as a distractor from stressful thoughts. In general,
it has been argued that in order to facilitate a relaxation response, music should have simple
repetitive rhythms and melodies, small changes in dynamics, slow tempi (around 60-80bpm),
no percussive instruments, and minimal vocalisations 17–19. However, these claims have not
been investigated in relation to sleep.
Previous research on sleep music characteristics is limited by the use of qualitative self-reports
with relatively small amounts of data, usually in geographically restricted areas. One survey
study based in the UK (N = 651) found a large diversity among music used for sleep and
concluded that the choice of music was driven more by individual differences than any
consistent type of music 16. However, that study only collected information on artists and genres
and did not examine the specific characteristics and audio features of the actual music.
Similarly, an Australian survey study on students (N = 161) found that music that aided sleep
was characterised by medium tempo, legato articulation, major mode and the presence of lyrics
20
. Because that study was restricted to only 167 pieces of music in a local student population,
its generalizability is questionable. Today, many people listen to music via international
streaming services, and this allows for the collection of big data on sleep music from around
the globe.
Over the last decade, an increasing amount of music listening is done using streaming services
such as Spotify, Apple Music, and Youtube music 21. In 2019, the International Federation of
the Phonographic Industry reported that 89% out of 34 000 internet users listened to music via
a streaming service such as Apple Music, Spotify or YouTube music 22. Out of these services,
Spotify stands out with over 320 million listeners worldwide in 2020 23,24. In addition, Spotify
offers an easily accessible API (application programming interface), allowing users and
researchers to pull metadata and pre-calculated audio features from millions of unique tracks
25,26
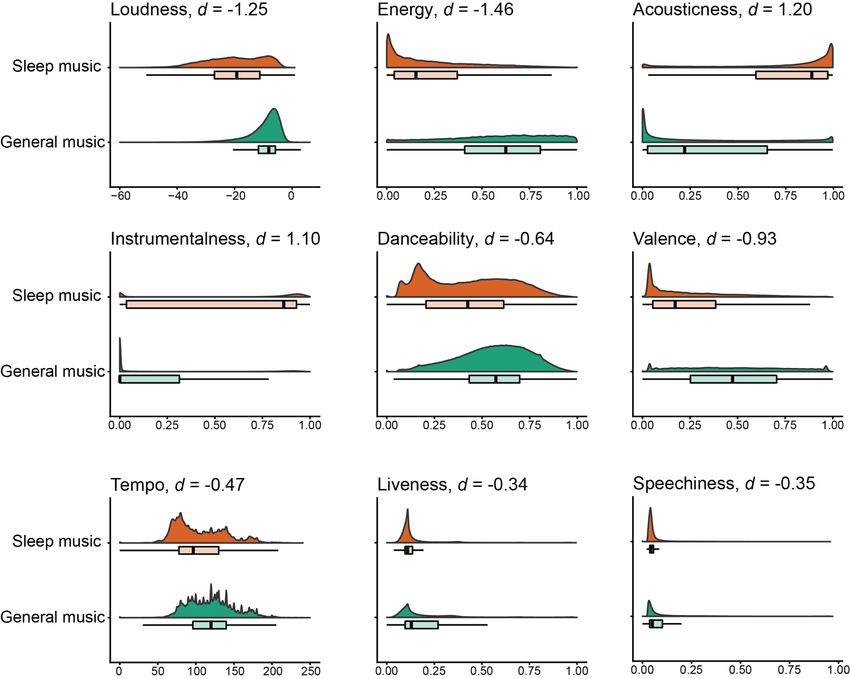
. These features describe not only basic features of recorded music, such as its tempo andloudness, but also compound measures indicative of, for instance, a particular track’s Danceability and Acousticness. This allows us to use Spotify as a platform for investigating sleep music in a representative industrialised population 27,28. Here, we analyse a large dataset of sleep music to determine both universal and subgroup characteristics of music used for sleep. By amalgamating data from Spotify, we build the largest database of music used for sleep to-date, consisting of almost 1000 sleep playlists each containing multiple music tracks with associated metadata and audio features. With a linear discriminant analysis, we compared the audio features of the sleep playlist dataset to a large dataset of general music listening and subsequently, conducted cluster analyses to determine both universal and subgroup characteristics of the music people use to sleep. II. Results A global dataset of sleep music. To build a global dataset of sleep music, we systematically searched Spotify for playlists used to facilitate sleep as indicated by title and description. We included 989 playlists with a grand total of 225,927 tracks (for an overview of the search process see Methods). Out of these, 95,619 tracks appeared in multiple playlists. How often a track’s Spotify ID appears in the whole dataset serves as a proxy for its popularity as sleep music. Surprisingly, the most popular track which appeared 260 times was “Dynamite” by the Korean pop band BTS. This track does not match previous descriptions of relaxation music 17– 19 and is instead an up-beat track filled with syncopated and groovy melodic hooks and a busy rhythm section. Other popular sleep tracks included “Jealous” by Labrinth or “lovely (with Khalid)” by Billie Eilish and Khalid that appeared 72 and 63 times respectively (see supplementary table 2 for the top 20). Both these tracks are characterised by medium-low tempo (85 and 115 BPM respectively, yet with an emphasis on half-time (57.5 BPM) on the latter), and a sparse instrumentation with focus on long melodic lines. Popular relaxation music pieces such as “Brahms Lullaby”, “Clair de Lune” or “Canon in D” also appeared more than 100 times in the dataset as well as lullabies and nursery rhymes like “Twinkle Twinkle Little Star” and “Incy wincy spider”, albeit with varying versions and audio features. Within the dataset as a whole, the most popular genres as labelled by Spotify were “sleep”, “k- pop/k-pop boy group”, “lullaby”, “lo-fi beats”, “pop/uk pop”, “chillhop, lo-fi beats”, “electro pop/pop”, and “piano cover”, suggesting a large variability in the music included. The average duration for the playlists was 695 minutes, containing on average 225 tracks each. The tracks had an average duration of 3.27 minutes. Spotify allows its users to bookmark playlists by “following” them, and the playlists in our dataset had 21,743 followers on average, with the most popular sleep playlist approaching 4 million followers (see supplementary table 1). Differences between sleep music and general music. To statistically assess the specific characteristics of sleep music, we compared the unique tracks from the Sleep Playlist Dataset (SPD) to the Music Streaming Sessions Dataset (MSSD). This publicly available dataset was released by Spotify on CrowdAI 29 and contains audio features for approximately 3.7 million unique tracks that were listened to at all hours of the day. The MSSD was collected over
multiple weeks in 2019 and is treated here as representative of general music listening. We
used two approaches to characterise sleep music. First, we statistically compared the individual
audio features between sleep and general music using Welch’s t-tests to account for unequal
size and variance. Second, we used linear discriminant analysis (LDA) to identify the
individual audio feature’s contribution to separating the two datasets. All p-values were FDR-
corrected, yet due to the size of the dataset all p-values reach traditional thresholds of statistical
significance (p < .001). To better interpret our results we focus on effect size, as measured by
Cohen’s d for the statistical comparison and r2 for the LDA 30. The results are illustrated in
Figure 1.

Figure 1: Audio feature comparisons between sleep music in the SPD (orange) and general music in the MSSD (green). The
panels show the individual audio features, illustrated as smoothed density plots with an underlying box plot wherein the
vertical line represents the median value, with the associated Cohen’s d for the comparison of sleep music versus general
music.

The comparison between general music in the MSSD and sleep music in our SPD yielded
statistically significant differences between all audio features. The largest effect sizes were
found for a decrease in Loudness (Cohen’s d = -1.25) and Energy (Cohen’s d = -1.46) and for
an increase in Acousticness (Cohen’s d = 1.20) and Instrumentalness (Cohen’s d = 1.10) in the
SPD compared to the MSSD. Danceability (Cohen’s d = -0.64), Valence (Cohen’s d = -0.93),
Tempo (Cohen’s d = -0.47), Liveness (Cohen’s d = -0.34), and Speechiness (Cohen’s d = -
0.35) were all significantly lower in the SPD as compared to the MSSD. For a full overview,
see Table 1.

Table 1: Statistical comparison and linear discriminant analysis of audio features between the
Music Streaming Sessions Dataset and the Sleep Playlist Dataset.
                                Dataset                         Statistical comparison                LDA
 Audio feature         MSSD               SPD         Cohen’s
                                                                         t             P       R2           P
                    (N = 3,706,388)   (N = 130,308)     D
 Loudness                -9.6             -19.77       -1.25     t(133 377) = -367   < .001    .09      < .001

 Energy                  .59               .23         -1.46     t(142 204) = -569   < .001   .06       < .001

 Acousticness            .35               .74          1.20     t(141 830) = 447    < .001   .04       < .001

 Instrumentalness        .21               .62          1.10     t(137 191) = 367    < .001   .04       < .001

 Danceability            .56               .42         -0.64     t(136 523) = -208   < .001   .02       < .001

 Valence                 .48               .25         -0.93     t(143 840) = -360   < .001   .02       < .001

 Tempo                 120.07             104.95       -0.47     t(137 855) = -159   < .001    .01      < .001

 Liveness                .21               .15         -0.34     t(153 786) = -179   < .001   < .01     < .001

 Speechiness              .1               .07         -0.35     t(163 929) = -178   < .001   < .01     < .001
Note. For the statistically testing for equal means, we used Welch’s t-test to correct for the unequal size and
variance between the two datasets. All P-values were FDR-corrected. The following audio features were lower in
the SPD compared to the MSSD: Loudness (Cohen’s d = -1.25), Energy (Cohen’s d = -1.46), Danceability
(Cohen’s d = -0.64), Valence (Cohen’s d = -0.93), Tempo (Cohen’s d = -0.47), Liveness (Cohen’s d = -0.34),
Speechiness (Cohen’s d = -0.35). The following audio features were higher in the SPD compared to the MSSD:
Acousticness (Cohen’s d = 1.20), Instrumentalness (Cohen’s d = 1.10). The linear discriminant analysis gives an
indication of which audio features are important when separating the SPD and the MSSD dataset. The analysis
was performed with weighted data due to the imbalanced between the MSSD and the SPD. The correct predictions
reached 78.59% (MSSD = 79.85%, SPD = 77.34%). All P-values were FDR-corrected.

The LDA performed at a correct classification rate of 78.59% (MSSD = 79.85%, SPD =
77.34%). The analysis was performed with weighted data due to the imbalance in sample size
between the MSSD and SPD. All audio features were found to significantly contribute to the
classification. The best discriminator was Loudness (r2 = .09), followed by Energy (r2 = .06),
Acousticness (r2 = .04), Instrumentalness (r2 = .04), Danceability (r2 = .02), Valence (r2 = .02),
Tempo (r2 = .01), Liveness (r2 < .01), and Speechiness (r2 < .01).

Taken together, our findings suggest that sleep music is primarily defined by low Loudness
and Energy, and high Acousticness and Instrumentalness. While the effect size for Tempo was
modest (Cohen’s d = -0.47), the mean difference between general music (120.07 BPM) and
sleep music (104.95 BPM) was 15 BPM, a highly musically significant difference, indicating
that sleep music is, in general, slower in tempo than general music.

Subgroup characteristics of sleep music. To assess the degree to which sleep music can be
considered one homogeneous group of music or whether different subgroups exist within this
category, we performed a k-means clustering analysis that revealed seven distinct clusters of
tracks. We merged two of these clusters, as their mean tempi were multiples (136 BPM and 74 BPM) and their remaining audio features were highly similar. Tempo can be challenging to algorithmically determine and often half-time or double-time tempo is measured instead of the original tempo, so this occurrence is not surprising. Thus, our analysis revealed six musically meaningful subgroups of sleep music. Figure 2 shows the different audio features for each cluster. Figure 2A illustrates the mean audio feature values for each subgroup in relation to the sample mean, and figure 2B shows the results of a decision tree classification on unique tracks within each subgroup. The classification performed at 88% accuracy on hold-out data (80/20 split). The combination of both figures enables us to determine which audio features contributed the most to the division into subgroups. Figure 2: Overview of subgroups of sleep music. A: The six clusters’ audio features are here shown in relation to the grand average value. A positive value indicates that the cluster is characterised by a relative increase in the audio feature’s value, and a negative value indicates a relative decrease. B: Decision Tree classification performed on the dataset containing only
unique tracks, based on nine normalised audio features, into the six clusters summarised in panel A. The decision tree
performed with an accuracy of 88% on hold-out data (80/20 split).

The clusters that are the most representative of sleep music are clusters 1, 2 and 6 with very
high Instrumentalness and Acousticness and low Energy and Loudness. Cluster 2 (N=117,240)
is the most similar and tracks of this cluster are meditation tracks, healing music with nature
sounds, continuous drone music or ambient music (see supplementary table 3). Therefore,
cluster 2 was named “Ambient Tracks”. Cluster 1 and 6 each have their own speciality,
separating it from “Ambient Tracks”. As is shown in figure 2B, cluster 1 (N=5,788) is defined
by high Liveness. It is for this reason we have named it “Live Tracks”. Most of the tracks
included in this cluster are generally pop or Christian tracks, the latter which has a tendency to
be recorded live. Finally, cluster 6 (N=32,736) has higher Danceability than “Ambient Tracks”
(figure 2A) and the tracks from this cluster are mostly instrumental compositions, either piano
cover tracks, classical or jazz instrumentals (see supplementary table 3). By comparing tracks
from cluster 6 and “Ambient Tracks”, it is apparent that tracks from cluster 6 usually have a
stable pulse, which is expected in instrumental compositions but which is often absent or less
salient in “Ambient Tracks” due to the continuous and floating feel of ambient music. Cluster
6 is composed of non-ambient instrumental tracks, hence its name “Instrumental Tracks”.

The audio features of clusters 3, 4 and 5 are substantially different from the average, with low
Instrumentalness, high Energy and high Loudness. Cluster 5 (N=8,282) is characterised by high
Speechiness (see figure 2B), hence its name “Speechy Tracks”. It contains mainly rap, R&B
or lofi tracks (see supplementary table 3). Cluster 3 (N=31,088) and cluster 4 (N=30,793) are
similar in their audio feature distribution and the tracks that they contain. They mostly contain
popular songs of the moment, pop and indie tracks with some lofi, and R&B tracks. The main
difference between them is that cluster 4 has high Acousticness whereas cluster 3 does not (see
figure 2). Cluster 3 is therefore named “Radio Tracks”, and cluster 4 is named “Acoustic Radio
Tracks”.

Given that most of the tracks in the “Radio Tracks”, “Acoustic Radio Tracks” and “Speechy
Tracks” clusters are well-known tracks, one possible explanation of the large number of tracks
in these clusters might be due to Spotify promoting specific tracks. However, additional
analyses reveal that these subgroups do not have more tracks from Spotify generated playlists
than from User-generated playlists, in fact the largest percentage of tracks from Spotify-
generated playlists (N=3,421) appear in the “Ambient Tracks” and “Instrumental Tracks” (see
supplementary figures 1 and 2). Furthermore, the most prominent genres in tracks from
Spotify-generated playlists are “background music” and “calming instrumental”. Therefore, we
can assume that the popular up-tempo tracks are not the result of Spotify promoting specific
artists or albums via sleep playlists.

These results indicate that while, in general, sleep music is characterised by low Loudness, low
Energy, high Instrumentalness, low Tempo and high Acousticness, it also contains a musically
relevant degree of variation. We found that sleep music covers different subgroups with distinct
characteristics ranging from typical relaxation music (“Ambient Tracks”) to popular music
(“Radio Tracks” and “Acoustic Radio Tracks”) and R&B (“Speechy Tracks”).
III. Discussion
Using the largest collection of sleep music to-date, we show that sleep music is characterised
by lower Tempo, Loudness and Energy as well as higher Instrumentalness and Acousticness
than music in general. Surprisingly, even within sleep music, a large variation of music features
remains. Our results show that sleep music can be divided into six distinct clusters. Although
some clusters correspond largely to the general characteristics of sleep music, other clusters
differ substantially, including energetic music with danceable beats and lyrics in genres such
as pop, lo-fi and R&B.

When investigating the genres of music used for sleep, a British survey study found that
classical music was the most frequent genre mentioned (32%), followed by rock (11%), pop
(8%), acoustic (7%), jazz (6%), soundtrack (6%) and ambient (6%) 16. Similarly, an Australian
survey study found that of the pieces of music participants rated as successfully helping them
fall asleep, 18.5% were classical, 12.3% pop, 12.3% ambient, 10.8% folk and 10% alternative,
with 11 different genres in total 20. Interestingly, classical music was not a prominent genre in
our data. Instead, we found that “sleep”, “k-pop/k-pop boy group”, “lullaby”, “lo-fi beats”,
“pop/uk pop”, “chillhop, lo-fi beats”, “electro pop/pop”, and “piano cover” were the most
prevalent genres. The incongruence of findings could be because both previous studies were
based in one single country with a limited number of participants whereas this current study
used a global approach. Additionally, the differences may relate to demographic characteristics
of the included samples (see supplementary material for a discussion). This being said, the
studies agree that no single type of music is most listened to by the general population to fall
asleep, accentuating the need for music-based sleep interventions to include many different
choices of genres 16,20.

The overall characteristics of sleep music revealed by this study are in line with previous
research on diurnal fluctuations in music listening behaviour. A recent study found that reduced
tempo, loudness and energy was characteristic of music listened to during the night and the
early morning 25. Similarly, the average musical intensity has been found to decrease during
the evening hours 26. In addition, experimental research has highlighted the importance of low
tempo and loudness for arousal reduction in response to music 31–33. The importance of a slow
tempo may be explained by the entrainment of autonomous biological oscillators such as
respiration and heart rate to external stimuli like the beat of the music 34,35. Similarly, there is
also evidence for neural entrainment to musical rhythms at both beat and meter frequencies
36,37
      . Thus, music with a slow tempo may promote sleep by enhancing low-frequency activity
in the brain 38.

Even though our findings provide evidence of the general soothing characteristics of sleep
music, we also show that there is much more to sleep music than standard relaxation music.
Our results reveal that the music people use for sleep varies substantially with regard to the
audio features and music characteristics. The large variation described above is accentuated by
the six subgroups we identified based on their audio features. The largest subgroup of sleep
music was “Ambient music” which is the most expected type of music when looking at music
used for relaxation as it has low Danceability and Energy, and high Instrumentalness and Acousticness. These represent the universal and predominant characteristics of music used for sleep. However, different combinations of audio features were found in the other subgroups (“Acoustic Radio Tracks”, “Radio Track”, “Speechy Tracks”). Surprisingly, these subgroups included tracks that are popular on the radio, which have high Energy and Danceability, and low Instrumentalness and Acousticness. One could argue that music with high Energy and Danceability would be counterproductive for relaxation and sleep, however it is possible that they could increase relaxation when considering the interplay between repeated exposure, familiarity and predictive processing. In short, predictive coding is a general theory of brain function which proposes that the brain continuously makes predictions about the world that are compared to sensory input, and if found wrong, triggers a prediction error signal used to refine future predictions 39,40. Hence, if music contains many surprising elements, this would lead to many prediction errors as marked by event-related potentials as measured by EEG 41–44. With repeated exposure, the brain gets increasingly precise at predicting the music. As a piece of music becomes increasingly familiar, thereby generating fewer prediction errors, there is a corresponding decrease in attentional focus and in general energy use 45. As such, it may be that familiar music even with high Energy and Danceability could facilitate relaxation due to its highly predictive nature. However, this relationship remains to be tested 41,42,46,47. The wide variety of tracks in the dataset could also be explained by the different motivations to listen to music before sleeping. Trahan et al. found four different reasons why people listen to music before bed: (1) in order to change their state (mental, physical, or relaxation), (2) to provide security, (3) as distraction, or (4) just by habit 16. Certain types of music may be more suitable than others depending on the reason for using music as sleep aid. For example, music that leads to relaxation is usually linked to slow Tempo, low Energy, and high Instrumentalness, such as the tracks that are within the “Ambient Tracks” and “Instrumental Tracks” subgroups. However, a different motivation for music use before sleep, such as mood regulation, might be done better with tracks that are already liked by the listener. Because the motivation of the listener might have a large influence on the type of music people choose to listen to before bed, future research should investigate to what extent different reasons for using music as sleep aid may drive the specific choice of music. Furthermore, research on music used for emotion regulation shows that people do not always choose the music that facilitates a positive effect 48,49. Therefore, studies should clarify if the different subgroups of sleep music do promote sleep equally well while taking music preferences into account. This study is the largest to date using the digital traces of music streaming to unravel the widespread human practice of using music as sleep aid. Poor sleep is a growing problem in society and our study contributes to this field, by providing new knowledge on both the universality and diversity of sleep music characteristics that can help inform future music- intervention studies as well as improve our understanding of how music is used to regulate emotions and arousal by millions of people in everyday life.
IV.         Methods
Building the Sleep Playlist Dataset. We used Spotify (currently the world’s largest
subscription music streaming service) to build a dataset of sleep-associated playlists of musical
tracks. We used the playlist search function in the Spotify desktop client, searching for all
playlist including a word in the word family of “sleep” (e.g. sleep, sleepy, sleeping) either in
the title or in the description. Playlist were included if they contained music and title and/or
description reflected that they were used to facilitate sleep.

As the exact number of playlists relating to sleep on Spotify is unclear and not possible to
estimate without access to Spotify’s proprietary database, we stopped data collection at 1,242
playlists. At this point, we encountered a noticeable increase in playlists which were excluded.
To ensure our dataset was representative of general trends in sleep music, and not just
individual idiosyncrasies, we excluded playlists with less than 100 followers. 30 playlists were
excluded due to this criteria. A further 215 playlist playlists were excluded based on other
predetermined exclusion criteria listed in supplementary table (see supplementary table 4). The
title, content and purpose of 69 playlists were ambiguous, so a qualitative review by two of the
authors were performed by inspecting playlist title, description, visuals and content. Of these,
29 were excluded, leaving the total number of playlists in our dataset at 989. A flow diagram
of the procedure can be found in Figure 3. The thorough assessment procedure was aimed to
ensure that the included playlists were indeed used for sleep. While we cannot experimentally
ascertain their use, the general descriptions of the playlists, such as “Soothing minimalist
ambient for deep sleep” or “ A series of soothing sounds to softly send you to sweet, sweet
slumber” and the visual illustration accompanying many of the playlists, such as a photo of a
bed, a pillow, or a sleeping person, indicates the notion of sleep. Furthermore, all of the cases
in which the mention of the word “sleep” was ambiguous were evaluated individually and
excluded if any doubt persisted. While there is a possibility that some included playlists were
not meant for the purpose of sleeping, we believe the size of the dataset reduces their potential
impact.

For each playlist, the playlist link, title, description, creator, number of followers, number of
tracks and duration was noted. The dataset used for further analysis consisted of 989 included
playlists holding a total of 297,619 tracks. We used Spotify’s API through Spotipy in Python
to access and extract audio features from the tracks included in the SPD.
Figure 3: Flowchart of the exclusion procedure. We acquired 1242 playlist by searching Spotify for sleep keywords. 30
playlist were excluded due to having less than 100 followers, and 215 playlists were excluded due to containing mainly non-
musical audio such as speech, in particular the subgenre called ASMR consisting predominantly of spoken words at
whispering levels recorded by using a close miking technique. 69 playlists had ambiguous titles (such as “NO SLEEP”),
which were then qualitatively reviewed, leading to 29 exclusions. The final dataset included 989 playlists.

The precalculated audio features available from Spotify cover a wide range of both basic and
compound musical measures. Notably, as the calculation of these audio features are
proprietary, we are unable to quantify exactly which calculations and transformations underlie
each feature. Therefore, we base our interpretation of the audio features on Spotify’s
description as part of their API reference manual 50, which we provide a summary of in Table
2.

Table 2: Overview of the audio features that are accessible through the Spotify API and their
descriptions as given by Spotify 50.
           Audio feature                                             Description

                 Loudness A value indicating the overall loudness of a track, ranging between
                          -60 and 0 dB. Spotify does not specify a dB scale, but it is assumed
                          this is measured in LUFS.
Energy A value indicating a perceptual measure of intensity and activity,
ranging between 0 and 1.
Acousticness A value indicating how likely a track is acoustic, meaning
performed on non-amplified instruments, ranging between 0 and 1.
Instrumentalness A value indicating how likely a track contains no vocals, ranging
between 0 and 1 with values above 0.5 likely to be instrumental
tracks.
Danceability A value indicating how suitable a track is for dancing, ranging
between 0 and 1, with higher values indicating increased
danceability.
Valence A value indicating positively valenced a track is (from a Western
point of view), ranging between 0 and 1.
Tempo A value indicating the speed or pace of track, as estimated by the
average beat duration, given in beats-per-minute (BPM).
Liveness A value indicating how likely a track is performed live, for instance
by detecting the sound of an audience in a recording.
Speechiness A value indicating the presence of spoken words in a track.
Analyses. All statistical analyses were performed in RStudio version 1.3.959 using R version
4.0.0, running on Windows 10. The scripts used for analysing the dataset can be found at
GitHub.com/OleAd/SpotifySleepPlaylists.
The statistical comparison between the unique tracks in the SPD and the MSSD was performed
using Welch’s t-test in the rstatix package to correct for the unequal size and variance. The
linear discriminant analysis was performed using the LDA function from the flipMultivariates
package distributed by Displayr. Due to the unequal size between the SPD and the MSSD, data
from the former was weighted by a factor of 28.44.
The k-means clustering was performed using R’s inbuilt kmeans function, with a maximum of
1000 iterations. This clustering approach partitions the data into k clusters by minimizing the
within-cluster variance. Selecting the optimal k depends on the intended outcome of the
clustering, with lower values of k generally capturing larger clusters in the data. To determine
the optimal k for our case we applied the elbow-method, wherein the within-cluster sum-of-
squares is summed for each value of k, in our case k = [1,17]. Inspecting this value revealed an
optimal partition of the dataset into seven clusters, which we subsequently reduced to six by
collapsing two of the clusters that were found to be highly musically similar.
To assess the individual audio features importance in the clustering, we performed a decision
tree classification on the six identified clusters. The dataset, composed of only the unique tracksand nine normalised audio features was split into a training set and test set (80%/20%), and the decision tree was trained on the training set using the rpart function in RStudio. The regressor was then tested on the test set which yielded an 88% accuracy rate. The visualization of the decision tree illustrates the most important features that determine which cluster a given track belongs to. Figures were made using ggplot2 and the RainCloudPlots package 51. V. Data availability The full dataset can be accessed at GitHub.com/OleAd/SpotifySleepPlaylists. VI. Code availability Code is available at GitHub.com/OleAd/SpotifySleepPlaylists. VII. Acknowledgements Center for Music in the Brain is funded by the Danish National Research Foundation (DNRF117). IIX. Author contributions R.J.S contributed to data collection, assessment, analysis, writing and editing. O.A.H. contributed to study design, data extraction and analysis, writing and editing. P.V. contributed to conceptualization, writing and editing. K.V.J. contributed to conceptualization, study design, data assessment, writing and editing. All authors contributed to the final draft. IX. References 1. Calem, M. et al. Increased Prevalence of Insomnia and Changes in Hypnotics Use in England over 15 Years: Analysis of the 1993, 2000, and 2007 National Psychiatric Morbidity Surveys. Sleep 35, 377–384 (2012). 2. Garland, S. N. et al. A decade’s difference: 10-year change in insomnia symptom prevalence in Canada depends on sociodemographics and health status. Sleep Health 4, 160–165 (2018). 3. Pallesen, S., Sivertsen, B., Nordhus, I. H. & Bjorvatn, B. A 10-year trend of insomnia prevalence in the adult Norwegian population. Sleep Med. 15, 173–179 (2014). 4. Aritake-Okada, S., Kaneita, Y., Uchiyama, M., Mishima, K. & Ohida, T. Non- pharmacological self-management of sleep among the Japanese general population. J. Clin. Sleep Med. JCSM Off. Publ. Am. Acad. Sleep Med. 5, 464–469 (2009). 5. Léger, D., Poursain, B., Neubauer, D. & Uchiyama, M. An international survey of sleeping problems in the general population. Curr. Med. Res. Opin. 24, 307–317 (2008). 6. Morin, C. M., LeBlanc, M., Daley, M., Gregoire, J. P. & Merette, C. Epidemiology of insomnia: prevalence, self-help treatments, consultations, and determinants of help- seeking behaviors. Sleep Med. 7, 123–130 (2006).
7. Brown, C. A., Qin, P. & Esmail, S. “Sleep? Maybe Later…” A Cross-Campus Survey of
    University Students and Sleep Practices. Educ. Sci. 7, 66 (2017).
8. Urponen, H., Vuori, I., Hasan, J. & Partinen, M. Self-evaluations of factors promoting
    and disturbing sleep: an epidemiological survey in Finland. Soc. Sci. Med. 1982 26, 443–
    450 (1988).
9. Jespersen, K. V., Koenig, J., Jennum, P. & Vuust, P. Music for insomnia in adults.
    Cochrane Database Syst. Rev. (2015) doi:10.1002/14651858.CD010459.pub2.
10. Wang, C.-F., Sun, Y.-L. & Zang, H.-X. Music therapy improves sleep quality in acute
    and chronic sleep disorders: A meta-analysis of 10 randomized studies. Int. J. Nurs. Stud.
    51, 51–62 (2014).
11. Mehr, S. A. et al. Universality and diversity in human song. Science 366, (2019).
12. Trehub, S. E., Unyk, A. M. & Trainor, L. J. Adults identify infant-directed music across
    cultures. Infant Behav. Dev. 16, 193–211 (1993).
13. Bainbridge, C. et al. Infants relax in response to unfamiliar foreign lullabies. Nat. Hum.
    Behav. (2020).
14. Dickson, G. T. & Schubert, E. How does music aid sleep? literature review. Sleep Med.
    63, 142–150 (2019).
15. Jespersen, K. V., Otto, M., Kringelbach, M., Van Someren, E. & Vuust, P. A randomized
    controlled trial of bedtime music for insomnia disorder. J. Sleep Res. 28, e12817 (2019).
16. Trahan, T., Durrant, S. J., Müllensiefen, D. & Williamson, V. J. The music that helps
    people sleep and the reasons they believe it works: A mixed methods analysis of online
    survey reports. PLoS One 13, e0206531 (2018).
17. Gaston, E. T. Dynamic Music Factors in Mood Change. Music Educ. J. 37, 42–44 (1951).
18. Holbrook, M. B. & Anand, P. Effects of tempo and situational arousal on the listener’s
    perceptual and affective responses to music. Psychol. Music 18, 150–162 (1990).
19. Tan, X., Yowler, C. J., Super, D. M. & Fratianne, R. B. The Interplay of Preference,
    Familiarity and Psychophysical Properties in Defining Relaxation Music. J. Music Ther.
    49, 150–179 (2012).
20. Dickson, G. T. & Schubert, E. Musical Features that Aid Sleep. Music. Sci. (2020)
    doi:https://doi.org/10.1177/1029864920972161.
21. RIAA. Charting a Path to Music’s Sustainable Success. Medium
    https://medium.com/@RIAA/charting-a-path-to-musics-sustainable-success-
    12a5625bbc7d (2020).
22. Music Listening in 2019. IFPI https://www.ifpi.org/ifpi-releases-music-listening-2019/.
23. Mansoor, I. Spotify Usage and Revenue Statistics (2020). Business of Apps
    https://www.businessofapps.com/data/spotify-statistics/ (2020).
24. Spotify — Company Info. https://newsroom.spotify.com/company-info/.
25. Heggli, O. A., Stupacher, J. & Vuust, P. Diurnal fluctuations in musical preference. 2021
    (2021) doi:10.31234/osf.io/6e4yw.
26. Park, M., Thom, J., Mennicken, S., Cramer, H. & Macy, M. Global music streaming data
    reveal diurnal and seasonal patterns of affective preference. Nat. Hum. Behav. 3, 230–236
    (2019).
27. Greenberg, D. M. & Rentfrow, P. J. Music and big data: a new frontier. Curr. Opin.
    Behav. Sci. 18, 50–56 (2017).
28. Holtz, D. et al. The Engagement-Diversity Connection: Evidence from a Field
Experiment on Spotify. https://papers.ssrn.com/abstract=3555927 (2020)
doi:10.2139/ssrn.3555927.
29. Brost, B., Mehrotra, R. & Jehan, T. The Music Streaming Sessions Dataset. in The World
Wide Web Conference 2594–2600 (Association for Computing Machinery, 2019).
doi:10.1145/3308558.3313641.
30. Bakker, A. et al. Beyond small, medium, or large: points of consideration when
interpreting effect sizes. Educ. Stud. Math. 102, 1–8 (2019).
31. Bernardi, L. Cardiovascular, cerebrovascular, and respiratory changes induced by
different types of music in musicians and non-musicians: the importance of silence. Heart
92, 445–452 (2005).
32. Bernardi Luciano et al. Dynamic Interactions Between Musical, Cardiovascular, and
Cerebral Rhythms in Humans. Circulation 119, 3171–3180 (2009).
33. Gomez, P. & Danuser, B. Relationships between musical structure and
psychophysiological measures of emotion. Emotion 7, 377–387 (2007).
34. Juslin, P. N. From everyday emotions to aesthetic emotions: Towards a unified theory of
musical emotions. Phys. Life Rev. 10, 235–266 (2013).
35. Khalfa, S., Roy, M., Rainville, P., Dalla Bella, S. & Peretz, I. Role of tempo entrainment
in psychophysiological differentiation of happy and sad music? Int. J. Psychophysiol. 68,
17–26 (2008).
36. Nozaradan, S. Exploring how musical rhythm entrains brain activity with
electroencephalogram frequency-tagging. Philos. Trans. R. Soc. B Biol. Sci. 369,
20130393 (2014).
37. Nozaradan, S., Peretz, I., Missal, M. & Mouraux, A. Tagging the Neuronal Entrainment
to Beat and Meter. J. Neurosci. 31, 10234–10240 (2011).
38. Ellis, R. J., Koenig, J. & Thayer, J. F. Getting to the Heart: Autonomic Nervous System
Function in the Context of Evidence-Based Music Therapy. Music Med. 4, 90–99 (2012).
39. Friston, K. Does predictive coding have a future? Nat. Neurosci. 21, 1019–1021 (2018).
40. Heilbron, M. & Chait, M. Great Expectations: Is there Evidence for Predictive Coding in
Auditory Cortex? Neuroscience 389, 54–73 (2018).
41. Huron, D. Sweet Anticipation. (The MIT press, 2006).
42. Koelsch, S., Vuust, P. & Friston, K. Predictive Processes and the Peculiar Case of Music.
Trends Cogn. Sci. 23, 63–77 (2019).
43. Vuust, P., Ostergaard, L., Pallesen, K. J., Bailey, C. & Roepstorff, A. Predictive coding
of music – Brain responses to rhythmic incongruity. Cortex 45, 80–92 (2009).
44. Vuust, P. & Witek, M. A. G. Rhythmic complexity and predictive coding: a novel
approach to modeling rhythm and meter perception in music. Front. Psychol. 5, 1111
(2014).
45. Hansen, N. C., Dietz, M. J. & Vuust, P. Commentary: Predictions and the brain: how
musical sounds become rewarding. Front. Hum. Neurosci. 11, (2017).
46. Gebauer, L., Kringelbach, M. & Vuust, P. Ever-changing cycles of musical pleasure: The
role of dopamine and anticipation. Psychomusicology Music Mind Brain 22, 152–167
(2012).47. Salimpoor, V. N., Zald, D. H., Zatorre, R. J., Dagher, A. & McIntosh, A. R. Predictions
and the brain: how musical sounds become rewarding. Trends Cogn. Sci. 19, 86–91
(2015).
48. Carlson, E. et al. Maladaptive and adaptive emotion regulation through music: a
behavioral and neuroimaging study of males and females. Front. Hum. Neurosci. 9, 466
(2015).
49. Garrido, S. & Schubert, E. Music and People with Tendencies to Depression. Music
Percept. 32, 313–321 (2015).
50. Spotify for Developers. https://developer.spotify.com/documentation/web-
api/reference/object-model/.
51. Allen, M., Poggiali, D., Whitaker, K., Marshall, T. R. & Kievit, R. A. Raincloud plots: a
multi-platform tool for robust data visualization. Wellcome Open Res. 4, 63 (2019).You can also read