The Myth of Oversupply A PD Forum study (May 2020)
←
→
Page content transcription
If your browser does not render page correctly, please read the page content below

The Myth of Oversupply
A PD Forum study (May 2020)

Authors:

T. Bagh, SouthPole Ltd.; Canada
Dr. A. R. J. Esparta, EQAO, Brazil
H. Sangsun, P. SoHyeon Ecoeye Co. Ltd., Republic of Korea
Dr. S. Kolmetz; Climate Bridge GmbH, Germany
Mercedes Garcia Madero, ALLCOT AG, Switzerland
T. Morton, ClimateCare, Kenya
C. Patrickson, StratCarbon, Chile
O. Tuchten, Promethium Carbon, South Africa
C. Vrolijk, Natural Capital Partners, UK
Date            May 2020
Page            1/17
Subject         The Myth of Oversupply

About the Project Developer Forum
      The Project Developer Forum (PD Forum) is a collaborative association and collective voice of
companies and practitioners that are developing and financing greenhouse gas (GHG) mitigation activities
worldwide. Our members work on a global scale and evaluate opportunities to deploy climate financing
and carbon market instruments to accelerate investments for GHG mitigation, climate resilience and
sustainable development.

Executive Summary: The “Myth of Oversupply” of CERs may have affected the
COP25 negotiations
      A recent much-quoted publication by the NewClimate Institute and others (NewClimate) (endnote
#1) estimated the potential supply from the existing carbon offsetting mechanisms to be 18 billion tonnes
of CO2 emission reductions generated between 2013 and 2035. Sources of credits include the United
Nations Convention on Climate Change’s (UNFCCC’s) Clean Development Mechanism (CDM), Verra’s
Voluntary Carbon Standard (VCS), the Gold Standard and the American Climate Registry. NewClimate
aimed to look at the effects of credit supply on the aviation sector, but some negotiators in the wider
UNFCCC process have interpreted that level of supply as having the potential to impact the integrity of
the Paris Agreement. As a result, some feel the need to restrict project-based mechanisms. In this study
we demonstrate that the supply of credits is over-estimated by the NewClimate paper. We also show
examples of how project-based crediting is functioning well in several regional regimes and markets.

       In this study, our focus is to demonstrate that the NewClimate figure is significantly overestimated.
The NewClimate paper uses a timeframe for supply up to and including 2035, i.e. for the next 15 years,
which over-inflates the numbers being reported in the context of the Paris Agreement, whose first period
only runs to 2030, while the first period for CORSIA is just for 2021-2023. Using the same publicly available
UNFCCC data [endnote #2] as in the NewClimate paper, we devised a methodology for assessing the
supply of credits that takes into account the issuance success rate, the renewal of the crediting period and
the historical volumes of projects, as well as demand for credits from domestic schemes such as the South
Africa Carbon tax, which have the effect of reducing supply in the international market. Based on our own
research that includes our members’ operational experience, instead of a pure trend projection, we found
that an estimated supply of 180 million - 4 billion tonnes of emission reductions could be generated
to supply the market over the same timeframe, depending on the scenario used. The lower end of the
range (180 million credits) is expected to occur in a scenario where only the existing crediting periods of
registered projects are taken into account (i.e. where projects do not renew their crediting periods). The
upper range (4 billion credits) is based on a scenario where all crediting periods, current and future, are
included in the assessment.

       We believe the current perception of massive oversupply of credits has had a material, negative
impact on the outcome of the COP25 negotiations, and we think it is important to challenge this
assumption. Our position is supported by the low volume of available credits currently issued under the
CDM (about 2 billion tonnes from 2004 to 2019), most of which have already been used as compliance
credits in the European Union’s Emission Trading Scheme (EU ETS), the UNFCCC or retired. All other
credit issuance figures are projections, based on different scenarios. Very different conclusions about the
situation may be drawn, depending on the scenario chosen.

      The often quoted CDM supply figures (14.5 billion credits, quoted in the NewClimate paper) are
based on the mistaken premise that all projects, including those that have not been registered or for which
implementation has not even been started, will be able to issue all credits successfully, as envisaged in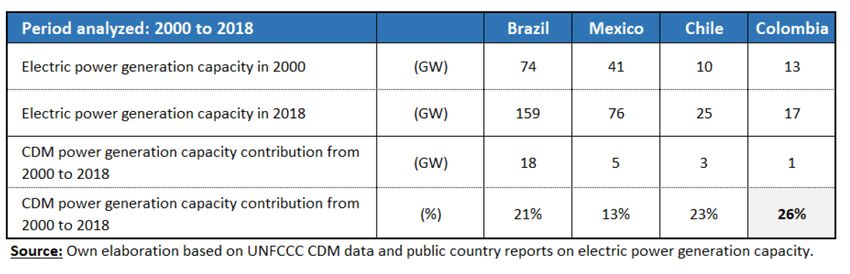
Date               April 2020
Page               2/17
Subject            The Myth of Oversupply

the initial project design documents. As practising project developers, members of the PD Forum know
that this scenario is not realistic. Various factors influence the success rate of project registrations,
renewals and issuances. These factors include, for example, the project reaching financial closure,
reaching commissioning, performance rates and successful verification. The PD Forum’s analysis is based
on a detailed and realistic research approach, and hence our results conclude that the potential supply of
credits to the market is materially lower - by one to two orders of magnitude.

       We recommend that the UNFCCC (and ICAO) negotiators make decisions based on the
conservative estimates of potential supply demonstrated here, rather than be spooked by vast
overestimates from other sources. Decisions should be based on the merits of the emission reduction
projects and methodologies that have been developed, the two-decades of human and institutional
capacity that has been built and the necessity of rapid and scaled-up action to achieve a 1.5 or 2 degree
target. In addition, negotiators should recognise that the demand for project based credits will extend far
further than CORSIA: there are numerous regional markets, Article 6.2 and Article 6.4 that all use a similar
credit-based approach and will create demand, while driving investment into low carbon projects.

       We implore that negotiators consider carefully the results of our research and use it to pave the way
for urgently needed private sector engagement in combating climate change.

Our Approach
Introduction
       The NewClimate paper estimates that 14.5 billion credits may be supplied by the CDM alone, where
10.3 billion credits may be derived from already registered projects, 1.05 billion from projects currently
under validation and 3.5 billion that are considering applying for CDM registration. Based on these
numbers, the study concludes that the use of existing CDM projects to generate credits needs to be
restricted significantly to avoid a huge oversupply, with associated negative impacts on environmental
integrity and the carbon price. However, as practitioners in the offset market, we believe these numbers
are vastly overestimating the actual availability.

      If we look into the published UNFCCC figures and compare the figures with the claimed oversupply,
we find the following:

Prior consideration
        To date, 12,961 projects have notified the UNFCCC of their intention to use the CDM through the
‘prior consideration’ mechanism. While the NewClimate paper acknowledges that “a large share of these
projects have been halted, [they] could still seek registration at a future point. [We assume they] are
registered on 1 Jan 2019.” Using this assumption, the study estimates up to 3.5 billion credits from these
potential project activities. But is this realistic? Only 273 projects have notified the UNFCCC of their
consideration of CDM in 2018 and 2019, with the remainder from before this time. Based on our
experience developing carbon credit projects, we strongly doubt that projects with a prior consideration
date earlier than this will still plan to register as a CDM project – in fact they may no longer be eligible
under the rules of the CDM. Also note that there is no detailed information available about prior
consideration projects except their title, therefore any assessment is mostly guesswork. Hence, the 3.5
billion credits estimated in the NewClimate study lack any clear foundation. Our opinion is that this number
should be close to zero.

Under validation
          The same discrepancy appears when considering projects under CDM validation. When registered,
Date April 2020
Page 3/17
Subject The Myth of Oversupply
all the projects currently under validation could potentially produce 1.05 billion credits (as calculated by
the NewClimate paper). However, if we limit the analysis to those projects that were listed as entering
validation between 2018 and 2019, there will be less than 10 million credits expected in the project design
documents (i.e. only 1% of the NewClimate estimate). As active project developers and practitioners, we
doubt that projects still under validation since before 2018 are viable for registration. We therefore believe
that the NewClimate paper has overestimated the supply of viable credits from projects under validation
by about 100 times, compared to the findings of a more realistic scenario. Furthermore, in this figure, we
have not considered that projects tend to over-estimate reductions in the early stages of development, as
they have to use conservative estimates in their additionality assessments (i.e. based on optimistic
performance). Projects that are registered with the CDM and have been commissioned, have an average
issuance success rate of less than 70%, as discussed further below.
Registered projects
Finally, we compared the NewClimate findings related to registered CDM projects. As per the
UNFCCC project database1, the annual emission reductions as estimated in the project design documents
for the first crediting period (CERs in CP1) for all 8,144 registered projects sum to roughly 1.090 billion
credits. If we filter out those that have concluded their crediting periods (and will not produce any more
credits), 3,735 projects remain. Interestingly, only 3,285 projects issued at all, meaning that only 40.3% of
all registered projects issued CERs. And only one third of those have issued any credits since 31 Dec
2012, the majority of which have already been used or retired.
Estimation of the potential CERs from all registered CDM projects is not a simple task, as several
variables must be considered. As the objective in the present study is not to obtain an exact figure, but to
have an approximate reliable potential, the following assumptions2 were made:
• Projects using afforestation and reforestation (AR) methodologies (67 out of 8,114 projects,
share of 0,8% of total) are not considered, and
• Programmes of Activities (PoAs) (328 out for 8,144, share of 4.0%) are not considered.
The scenarios
Based on the methodology above, the resulting issuance potential was calculated for the following
scenarios (Table 1)3:
Potential million CERs
# Scenario description
2013-20 2021-35 2013-35
1 • All registered projects 6,723 8,464 15,187
• Assumed to successfully renew their crediting periods
• 100% issuance success (IS)
2 • All registered projects 4,542 5,904 10,446
• Assumed to successfully renew their crediting periods
• using average 2000-12 (KP14) historical issuance success
1
UNFCCC’s Database for PAs and PoAs (validity of the data: 06/Jan/2020). Downloaded on 13/Feb/2020 from
cdm.unfccc.int/Statistics/Public/files/Database for PAs and PoAs.xlsx.
2
The consideration of project activities and PoAs using AR methodologies considerably increases the complexity of crediting period
scenarios and assumptions and, therefore, will not be considered. The simplification is, in our opinion, acceptable and reasonable
taking into account the small share of discarded projects (less than 5%) and corresponding comparatively smaller generation of
CERs.
3
Detailed figures are provided in Annex 1. Our spreadsheet with all calculations is available upon request and commitment of
communication of identified inaccuracies and applicable/required corrections/revisions to the authors.
4 st
1 Kyoto Commitment Period.Date April 2020
Page 4/17
Subject The Myth of Oversupply
(historical 2000-12 IS = 67.5%).
3 • Same as "2" but removing projects with CP1 5 before 2013 2,093 3,029 5,122
and more than 7 years of inactivity, i.e., CP1 starting in
KP1 and no issuance after 31-Dec-2012.
4 • Same as in "3" but with historical reduction of estimated 1,781 2,405 4,186
CERs at renewal of crediting period (estimated amount of
CERs for CP1 valid for CP1 only; 88% of CP1 for CP2,
43% of CP1 for CP3).
5 • 100% issuance success, only existing crediting periods, 5,155 937 6,092
that means, any CP renewals would be assumed to have
to be done under the new article 6 rules.
6 • Same as "5" but with 2000-12 issuance success. 3,433 580 4,013
7 • Same as "6" but removing projects starting in KP1 and 1,813 445 2,257
with no issuance after 31-Dec-2012.
Table 1: Potential CER issuance from registered CDM projects
The renewal rate of the crediting period is also calculated based on available data from the
UNFCCC database (see Table 3).
Source: UNFCCC database for PAs and PoAs, validity of the data 06/01/2020
Registered projects
potential issued Issuance Success (IS)
Crediting period before 2,172,870,369 1,466,547,930 67.5%
2012
Table 2: Historical issuance success rate
Source: UNFCCC database for PAs and PoAs, validity of the data 06/01/2020
Registered projects
CP1 (5098 PAs) CP2 (559 PAs) CP3 (24 PAs)
Reduction of credits
after renewal of the -12% - 57%
crediting period CP
Table 3: Reduction of credits because the crediting period has not been renewed
The issuance success rate has been calculated based on the real historic rates during 2000 – 2012
for all projects. We have chosen the period 2000-2012 rather than to the current day, as this was the time
when the market was strong, and projects were incentivised to maximise credit issuance. This means that
any shortfall in issuance was for internal reasons, not weak price signals from the market. From 2021, we
expect conditions to reflect those in 2000-2012 rather than 2013-2020. It is also worth mentioning that
industrial HFC and N2O projects typically had issuance rates over 100%. If they are removed from figures
(as they are not eligible in the current phase of the EU-ETS, a trend that is likely to be followed in other
5
CP1 is a project’s first crediting periodDate April 2020
Page 5/17
Subject The Myth of Oversupply
markets) the success rate will very likely drop further.
Considering the International Civil Aviation Organization’s (ICAO’s) recent limitation on CORSIA
units to those “emission units issued to activities commenced as of 1 st January 2016, further scenarios
6
taking into account different vintages are presented in Table 3.
Potential million CERs
# Scenario description
2013-20 2021-35 2013+35
8 2014 vintage (project activities with first crediting period starting 549 160 709
after 31-Dec-2013), 100% issuance success, only existing
crediting periods
9 Same as "8" but with 2000-12 issuance success. 371 108 479
10 2016 vintage (project activities with first crediting period starting 106 102 208
after 31-Dec-2015), 100% issuance success, only existing
crediting periods
11 Same as "10" but with 2000-12 issuance success. 72 69 140
12 2018 vintage (project activities with first crediting period starting 8.0 22.7 30.7
after 31-Dec-2017), 100% issuance success, only existing
crediting periods
13 Same as "12" but with 2000-12 issuance success. 5.4 15.3 20.7
Table 4: Potential CER issuance vintages for registered CDM projects
Discussion of the scenarios
Considering the reasonable supply limitations described in all scenarios, any estimation in the range
of 10 billion credits supply up to 2035 is, from our research, unrealistic. Our estimate of 4 billion CER
potential in scenario 4 is still a very optimistic scenario (assuming a very unlikely renewal of all project
activity crediting periods, the same amount of CERs in all crediting periods and still including industrial
gas projects such as HFC and N2O projects, etc.).
Scenario 7, with estimated potential of around 2.3 billion CERs in the 2013-35 period, is in our
opinion, a more reasonable and realistic scenario (although still optimistic in a few aspects as not
considering impact of domestic emission reduction markets, HFC+N2O projects still valid, projects with
crediting periods in 2013 and no issuance taken fully into account, etc.). In other words, more conservative
estimates will result in even fewer estimates of credits available for supply in the CORSIA market (a more
detailed analysis would be needed to increase confidence).
As ICAO has already decided to allow only credits from projects issued after 2016, the scenario 11
resulting in 140 million tonnes CO2 emission reductions is probably the one closest to reality and is 1/100th
of the volume in the NewClimate study.
Alternatively, if project activities starting later than 2012 (scenario 9) are used as a threshold, the
potential supply of credits will still be less than 500 million CERs in the whole 2013-2035 period. In other
6
In accordance with ICAO adoption for CORSIA emission units, namely, “The emissions units [shall be] issued to activities which
commenced as of 1 January 2016” (source: ICAO Press Release, 13-Mar-2020, https://www.icao.int/Newsroom/Pages/ICAO-
Council-adopts-CORSIA-emissions-units.aspx, access on 17-Mar-2020).Date April 2020
Page 6/17
Subject The Myth of Oversupply
words, the market will suddenly go from having a small surplus of supply to significant scarcity.
Halting project-based mechanisms in 2020 would create extraordinary damage
Some countries are of the view that the CDM should cease at the end of 2020. We would like to
emphasise the damage which an end to the CDM, before a new mechanism is operational, would create.
We understand that the legal position is that CDM may be halted by the end of December 2020 –
unless a decision is actively made by COP to continue it. Hence, we are concerned that if Parties are
unable to decide on a continuation, a transition or a new mechanism under Article 6, severe consequences
would result:
• The compliance market will stop and perhaps break down, at a time when it is needed more
than ever with the introduction of the CORSIA scheme and increased demand for offsets. This
will send a negative signal to the private sector, diminishing trust in the mechanism and future
potential mechanisms.
• For existing CDM projects, future operation will be in doubt. The end of the CDM will result in a
huge write off of the anticipated income which will affect the most vulnerable projects in
particular and potentially lead to emissions of GHGs that would not otherwise happen
• While some existing CDM projects can potentially move to voluntary schemes, voluntary
demand is limited. Also, many governmental and multinational buyers still look to the CDM
market, due to its international acceptance and the high levels of environmental integrity
required.
• Further, the envisaged Internationally Transferred Mitigation Outcomes (ITMOs) that are
underpinned by certified voluntary emission reductions may be put in doubt, so possibly the
Paris agreement Art. 6.2 could be affected.
• Many NDCs are based on the continued use of CDM, which therefore could be undermined.
The PD Forum acknowledges that changes to the CDM are likely to be made to support the
transition to the Paris Agreement. However, we would like to highlight the tremendous impact the CDM
has had in supporting projects that reduce GHGs; in developing a suite of rigorous, peer reviewed
methodologies for calculating GHG reductions; and training a workforce of auditors, consultant and
developers.
The PD Forum suggests that loss of the CDM would be a disaster at a time when demand for offsets
is growing, both from compliance buyers but also as companies, individuals and public bodies seek to
become ‘carbon neutral’. We would instead welcome the opportunity to work with governments, policy
experts and the UNFCCC to reform the CDM to continue to perform a valuable role in the transition to a
1.5 °C pathway.
We implore negotiators to:
• Confirm the continued operation of the CDM, at least until Article 6.4 has become fully
operational.
• Allow the use of CDM and JI methodologies in the new Article 6.4 mechanism.
• Allow the use of the existing CDM accreditation standard.
• Remove limitations on the use of the Article 6.4 mechanism.
• Do not place any additional financial burden (besides the share of proceeds for administrative
expenses) on project developers.Date April 2020
Page 7/17
Subject The Myth of Oversupply
Summary: key findings
Careful analysis of the available data demonstrates warnings of a huge oversupply of credits from
existing mechanisms must be considered a myth. The NewClimate paper was written with only one market
in mind: CORSIA. However, there will be a number of other sources of demand that should be taken into
consideration. Some of these are at a national level (discussed in Annex 2) and will be used domestically
in their country of origin, where markets have been shown to be an effective way of enhancing mitigation
actions. Furthermore, if the CDM or the Article 6 mechanism is used for other purposes such as
compliance with Nationally Determined Contributions (NDCs), concerns over excess supply seem even
more unfounded.
We are concerned that the fear of oversupply may have restricted, and continues to restrict
negotiators, from being more flexible concerning the transition of the CDM into the new Article 6
mechanism. We believe that such a transition will not compromise environmental integrity because the
available number of credits that will come from the existing CDM is much lower than indicated elsewhere.
Based on the results of this study, it appears that the risk of over-supply has been over-played and we
would argue that few, if any restrictions are needed, besides a robust mechanism and scrutiny for the
transition of CDM projects into the new scheme.
Endnotes / References
[1] “Offset Credit Supply Potential for CORSIA”
Authors:
NewClimate Institute, Cologne, Berlin; Harry Fearnehough; Carsten Warnecke
Stockholm Environment Institute; Lambert Schneider; Derik Broekhoff
Independent researcher: Stephanie La Hoz Theuer
On behalf of the German Environment Agency
Publisher: German Emissions Trading Authority (DEHSt) at the German Environment Agency
D-14193 Berlin; Status: October 2019;
Project number: 3717 42 505 0
[2] UNFCCC database as of January 2020
Project Developer Forum Ltd.
19-21 Bridgeman Terrace,
Wigan, WN1 1TD, UK
Europe: +49 171 279 8223
office@pd-forum.net
www.pd-forum.net
CHAIRPERSON:
Sven Kolmetz
sven.kolmetz@pd-forum.net
CO VICE CHAIRPERSONS:
Philipp Hauser
Philipp.HAUSER@pd-forum.net
Christiaan Vrolijk
christiaanvrolijk@pd-forum.netDate April 2020 Page 8/17 Subject The Myth of Oversupply Annex 1
Date                   April 2020
Page                   9/17
Subject                The Myth of Oversupply

More detail for each scenario
                        Source: UNFCCC database for Pas and PoAs, validity of the data 06/01/2020
                                                  Registered projects
                                                     fixed                       renewable                  fixed + renewable
                                                                                                1
                                                                              Potential CERs
              2013-2020                                      1,707                       5,016                              6,723
              2021-2035                                        660                       7,803                              8,464
              2013-2035                                      2,367                      12,820                             15,187
                                                                              Potential CERs 2
              2013-2020                                        994                       3,548                              4,542
              2021-2035                                        385                       5,520                              5,904
              2013-2035                                      1,379                       9,068                             10,446
                                                                              Potential CERs 3
              2013-2020                                        737                       1,356                              2,093
              2021-2035                                        314                       2,714                              3,029
              2013-2035                                      1,051                       4,070                              5,122
                                                                                                4
                                                                              Potential CERs
              2013-2020                                        737                       1,044                              1,781
              2021-2035                                        314                       2,091                              2,405
              2013-2035                                      1,051                       3,135                              4,186
                                                                              Potential CERs 5
              2013-2020                                      1,707                       3,448                              5,155
              2021-2035                                        660                         277                                937
              2013-2035                                      2,367                       3,725                              6,092
                                                                              Potential CERs 6
              2013-2020                                        994                       2,439                              3,433
              2021-2035                                        385                         196                                580
              2013-2035                                      1,379                       2,635                              4,013
                                                                              Potential CERs7
              2013-2020                                        737                       1,075                              1,813
              2021-2035                                        314                         131                                445
              2013-2035                                      1,051                       1,206                              2,257
                                                                              Potential CERs8
              2013-2020                                         25                         81                                106
              2021-2035                                         45                         56                                102
              2013-2035                                         71                        137                                208
                                                                                                 9
                                                                              Potential CERs
              2013-2020                                         15                         57                                 72
              2021-2035                                         26                         40                                 66
              2013-2035                                         41                         97                                138
          1 - 100% IS, successful renewal of all CPs, and amount of CERs for 1st CP for all CPs.
          2 - Same as "1" but with 2000-12 IS.
          3 - Same as "2" but removing projects with 1st CP starting in KP1 and no issuance after 31-Dec-2012.
          4 - Same as in "3" but with historical reduction of CERs at renewal of CP (due to increased conservativeness).
          5 - 100% IS, only existing CPs
          6 - Same as "5" but with 2000-12 IS.
          7 - Same as "6" but removing projects with 1st CP starting in KP1 and no issuance after 31-Dec-2012.
          8 - 100% IS, only existing CPs, 1st CP starting after 31-Dec-2015
          9 - Same as "8" but with 2000-12 IS.
          IS = issuance success (ratio of actual CERs issued and estimated amount at registration)
          CP = crediting period
          KP1 = 2000-12 crediting period
Date May 2020
Page 10/17
Subject The Myth of Oversupply
Annex 2
Domestic use is further restricting supply: examples from South Korea, South
Africa, Chile, Columbia and China
Introduction
A growing number of countries have regulatory regimes that allow companies to surrender
emissions credits generated in country in lieu of paying a carbon tax, or as part of a domestic emissions
trading policy. It is our contention that these credits will only be used in the countries in which they are
generated; they will not be used in other trading or compliance systems and so have the effect of reducing
supply from the international pipeline and supply of emissions reduction credits. These credits are
currently included in the main analysis of this study, but our contention is that to be more conservative,
they could be removed.
The examples below also demonstrate how strong domestic markets can create demand for CERs
and thereby attract private investment into mitigation activities on a significant scale. We look at examples
of such countries below.
Republic of Korea
In June 2015, the Republic of Korea (RoK) announced its commitment to reduce business as usual
(BAU) GHG emissions by 37%, to 851 MtCO2e by 2030. Part of the responsibility for achieving this is
passed to industry through the country’s Emissions Trading Scheme (ETS). Furthermore, the ETS
regulations include the flexibility to use credits from CDM projects.
The Korean Emissions Trading Scheme (K-ETS) launched in 2015, covering around 67% of the
national GHG emissions. The K-ETS has three phases: Phase I (2015-2017), Phase II (2018-2020) and
Phase III (2021-2025). For offset projects, only domestic credits were allowed during the first Phase while
overseas CDM projects have been eligible from Phase II. As detailed eligibility criteria for overseas CDM
was published at 2018, most overseas CDM projects for K-ETS have started since then. Overseas CDM
projects for the K-ETS can be seen as Article 6 pilot projects based on the CDM Transition, expecting
post-2020 CERs from the overseas CDM to be used for Korea’s NDC.
The Korean government allows offset credits from overseas projects to be used for a maximum of
5% of an entity’s compliance obligation. For example, the total emissions from 600 entities in 2018 slightly
exceeded 600 million tonnes, so, in theory, a maximum of 30 million tonnes of potential CER demand can
flow from the K-ETS. As at March 2020, Korean Offset Credits (KOC) from Korean domestic CDM projects
generated 27,831,118 CERs. Internationally, Ecoeye forecasts that annually 10-20 million tonnes of CERs
would be converted to Korean Offset Credits under K-ETS.
As most of the emission reductions from the overseas CDM projects for the K-ETS will be generated
after 2020, developers of overseas CDM projects for the K-ETS have to consider CDM transition. Because
of this, developers have been focusing on household and community clean energy projects that are
developed as Programmes of Activities. The mitigation projects are usually part of non-Conditional NDC
or not covered NDCs in countries including Bangladesh and Kenya. One of the leading Korean developers,
Ecoeye, has received a No-Objection certificate for CDM transition from the DNAs of various LDC
countries including Bangladesh. The CERs or “6.4Ers” for the K-ETS should be counted to comply with
Korea’s NDC under the Paris Agreement.
Summary: Approximately 100-200 million CERs for the 10 year period from 2021 to 2030 might beDate April 2020
Page 11/17
Subject The Myth of Oversupply
generated by overseas CDM projects for the K-ETS to help achieve Korea’s NDC under the Paris
Agreement. Therefore, K-ETS’s maximum demand for 30 million CERs or 6.4ERs could be removed from
the international market by Korea NDC compliance demand annually.
South Africa
South Africa’s Carbon Tax was implemented on 1 June 2019. The tax allows entities to offset 5%-
10% of their carbon tax liability with eligible, issued carbon offset credits. The eligibility of offset credits is
defined by the Carbon Offsets Regulations (gazetted on 29 November 2019). The key criterion is that
credits have to be generated in South Africa.
Promethium Carbon has undertaken a high-level analysis of the supply and demand for South
African offset credits for use on the South African Carbon Tax system. The boundary of the assessment
considered the constraints of the Carbon Offsets Regulations and was limited to registered CDM project
activities as CDM activities make up the majority of registered projects and carbon credits issued in South
Africa.
As with the main study above, Promethium Carbon’s analysis estimated the eligible supply of offset
credits based on historic CDM issuances. 18 Mt CO2e have been issued in the last 12 years, of which 3.5
Mt CO2e are eligible for use as carbon tax offsets. This means that there could be per year, on average,
300 thousand tCO2e eligible credits issued going forwards. Promethium Carbon’s analysis estimated the
eligible demand for offset credits. The demand analysis is split between into two phases, related to the
current exemption of Eskom (the country’s power utility and largest emitter) from paying a carbon tax in
the first phase of the tax. In Phase 2 from 2023, Eskom will be required to pay a carbon tax and hence the
analysis estimates that:
• 7.5 Mt CO2e per year will be in demand prior to Eskom’s entry into the market and
• 34 Mt CO2e per year will be in demand after Eskom’s entry into the market.
Summary: The market is likely to be very short. Even if the rate of issuance of eligible credits could
be expanded by a factor of 10 (300 thousand tCO2e eligible credits/year multiplied by 10 = 3 Mt
CO2e/year), then the market would still be short by 4.5 Mt CO2e (7.5 Mt CO2e less 3 Mt CO2e) a year
prior to 2023 which excludes Eskom’s demand for credits from market. This means that all CERs
generated in South Africa will be used domestically and will not be available internationally.
China
China launched its ETS in 2017 and in 2018 responsibility for climate policy shifted from the National
Development and Reform Commission to a new Ministry of Ecology and Environment. The first pilot phase
(2013-2019) had started at a regional level – with each region acting independently. The pilot phase was
initially located in five cities (Beijing, Shanghai, Tianjin, Chongqing and Shenzhen as well as Guangdong
and Hubei Provinces. In 2016 Fujian province joined the intiative.Each pilot ETS has a unique structure
that takes into account local circumstances and the respective economic profile. Among the eight pilots,
Guangdong has the largest market share in China and the third largest ETS worldwide. Under its ETS,
there are about 280 entities taking part with emissions capped at 465 Mt CO2e a year and a price of US$4.
Guangdong and Shenzhen ETS uniquely allow foreign investors.
The eight regional pilot ETS are about to be integrated into China’s national ETS, as outlined in the
power generation sector of its NDC and the ‘13th Five-Year Work Plan for Greenhouse Gas Emission
Control’. The National ETS is expected to cover 30% of national emissions. It is estimated to cover 3 billionDate April 2020
Page 12/17
Subject The Myth of Oversupply
tonnes of CO2e in its initial phase, with 1,700 liable entities which emit more than 26,000 tonnes GHG or
consume more than 10,000 t of coal per year. In spite of the Covid-19 pandemic, Shanghai announced its
commitment to the National ETS and Beijing added the aviation sector to its local ETS to enhance its
climate ambition. Furthermore, the recent announcement by CORSIA to allow the inclusion of China’s
GHG Voluntary Emission Reduction Program to supply Eligible Emissions Units will increase the wide use
of China’s domestic carbon credits internationally.
Chinese impact on supply: as China has repeatedly postponed the implementation of its national
emission trading scheme it is currently premature and difficult to make a forecast on the impact on supply.
But as about half of the CDM projects have been implemented in China in the past, we are convinced that
the impact will be significant.
Colombia
As part of its strategy to address emission reduction climate commitments under the Paris
Agreement, Colombia implemented the National Carbon Tax as part of structural tax reform in the country.
The carbon tax came into force on 1st January 2017 and applies to the sales and imports of all fossil fuels,
including all petroleum derivatives, except for coal and natural gas for residential consumption. The
National Directorate of Taxes of Colombia is in charge of the revenue collection and administration, while
the Ministry of the Environment and Sustainable Development oversees emissions reporting as well as
the accreditation of verification entities. In June 2017, the Colombian government approved Decree 926
establishing the rules and conditions that allow certain entities to offset their carbon tax obligation with
carbon credits generated in Columbia. The price per tonne of CO2e at the beginning of the tax was COP$
15,000 (US$3.80) with an increase in inflation of 1% per year. By 2030 this is COP$ 17,211 (US$ 4.35)
under the Carbon Tax Law (Law 1819).
Eligible credits must meet the following characteristics (Ministry of Finance and Public Credit, 2017):
• Come from a GHG mitigation initiative developed in Columbia.
• Come from GHG mitigation initiatives implemented through carbon certification or standards.
• Be verified under international accreditation schemes. For verifications carried out under
international accreditation schemes, the Verification body must issue a verification statement
indicating that GEl emission reductions or removals were generated per the methodology
defined in ISO 14064 "2: 2006 and the results obtained in the verification carried out under ISO
14064-3 or those that adjust and update them. The verification body must be accredited by the
National Accreditation Body of Colombia - ONAC or an accreditation body signatory member of
the International Accreditation Forum (lAF) that you have in your service offer the accreditation
program of the Organism of GEl Emission Verification under the requirements of IS0 14065.
• Not come from activities carried out by the mandate of an environmental authority (in order to
ensure that measures go beyond existing legislation).
• Be cancelled within the certification program, to avoid double counting, and be registered in the
National Registry of Greenhouse Gas Emission Reductions.
• Be certified by the applicable standard.
Currently, there are 72 CDM project activities implemented in Colombia, 8 of them are inactive due
to lack of financial resources. The other 64 project activities are able to generate 6.366 million tCO2 per
year. There are 16 VCS projects registered, able to generate an additional 2.8 million tCO2 reductions.
Columbia’s national emissions were 236.97 million tCO2e per year in 2014 and Colombia's goal is to
reduce emissions by 670 million tCO2 between 2015 and 2030 compared to BAU. The main data resultingDate April 2020
Page 13/17
Subject The Myth of Oversupply
from the carbon tax indicates that the average volume of carbon credits traded is 24 million tCO2/year,
with expected increases in the future.
Summary: 24 million credits are likely to be generated in Columbia each year and these will be used
in-country to create value for companies that invest in mitigation activities. This will reduce supply in the
international market by the same amount, while demonstrating the benefits of investing in mitigation
activities.
Chile
Chile’s carbon tax was approved as part of general tax reform in 2014 and applies to stationary
emission sources. Initially, there was no possibility of offsetting using carbon credits. However, another
reform, approved in February 2020, modified the original legislation and in particular, the way in which the
carbon tax is applied. It also allowed the possibility of using carbon credits to compensate for 100% of the
CO2 emissions tax from 2023, amounting to approximately 38 million tonnes of CO2 per year. With the
new tax reform, the number of installations that would be subject to the carbon tax is 80. Following the
trend of other countries, it is likely that the credits used must be generated in Chile.
According to a recent study carried out by StratCarbon for the Ministry of Energy (2019), analysis
of historic issuance success rates by project type; there are potentially 70 million credits that could be
verified from existing CDM and VCS projects to date. In addition, considering historic issuance success
rates per project type, the same existing projects could generate approximately 12 million credits per year
for the next 5 years at least. Finally, the study estimates a potential viable supply of 34 million credits per
year coming from new GHG emission reduction project activities. This last figure was calculated assuming
a maximum offset price of US$5.00 /tCO2, which is the current level of the carbon tax in Chile.
Summary: Considering the numbers above, there can be enough supply of carbon credits for the
new carbon tax compensation system. However, if old credits are restricted or banned from the system
and the conditions are not adequate (i.e. rule book for the operation of the new local compensation system
is not yet available) and/or the incentives are not strong enough (i.e. the current local carbon price signal
is rather low) for the private sector to start developing new GHG emission reduction projects, then it is
very likely that the local carbon market will be short, at least for the next 5 years. In either scenario, at
least 12 million credits would not reach the wider international market.Date May 2020
Page 14/17
Subject The Myth of Oversupply
Annex 3:
Benefits of CDM to Developing Countries
A study from StratCarbon, one of the PD Forum members 7, analysed the role played by the CDM
in fostering renewable, low carbon electric power installed capacity in several Latin American (LATAM)
countries. The analysis calculated the contribution of CDM projects to the total electric power capacity
added in the period 2000-2018. The evolution of the total electric power generation capacity for each
country was obtained from official government web pages and Power Industry reports. The installed power
capacity associated with power-related CDM project activities was sourced directly from the Project
Design Documents of all CDM project activities covered by the study (700 projects). The result of this
analysis is shown for each country in Table 4.
Table 4: CDM relevance in terms of country’s electric power generation capacity
As can be seen, the CDM played a significant role in the development of renewable low carbon
electric capacity in the studied countries. Colombia shows the highest CDM contribution (26%) to the total
increase of electric power generating capacity in the period. Chile and Brazil show lower, but still significant
numbers for this metric.
In most of the countries in Latin America, the electrification of the energy sector is a key part of their
mitigation strategy. This means that the lower the GHG intensity of the electric power matr ix, the more
effective the GHG mitigation effect associated to the increased electrification of the energy sector in the
respective countries. The CDM has been a key economic driver in making this transition.
7“Impacts of carbon offset projects in LATAM and the Caribbean economies” Authors: Eduardo Lopez and Christian Patrickson,
2020Date April 2020
Page 15/17
Subject The Myth of Oversupply
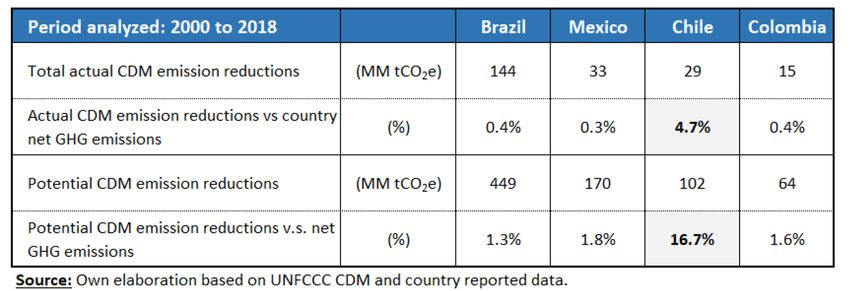
Table 5: CDM relevance in terms of country net GHG emission, 2000-18
Table 5 illustrates how the CDM has and could further contribute to GHG mitigation in each of the
selected countries. In relative terms, Chile, despite being the smallest country of the four, was one of the
most active players in the CDM relative to its GHG emissions, as it presents the highest average annual
CDM GHG emission reductions relative to its annual GHG emissions. This is probably due to two reasons:
Chile was an early adopter of the mechanism. Secondly, Chile, unlike the other three countries, has lower
net GHG emissions due to its forests that act as an important carbon sink in the accounting of its annual
net GHG emissions. Brazil, probably due to its size, is by far the largest user of the mechanism in absolute
terms. However, in CDM GHG emission reductions relative to its annual GHG net emissions, Brazil ranks
last after the other three countries. Leaving aside the case of Chile, it can be concluded that, on an annual
basis, the CDM has significant potential for GHG emission reductions, particularly considering emission
reductions over longer periods of time (e.g. 5 or 10 years). As a reference, the third commitment period of
the EU ETS (2013-2020) achieved a 1.73% annual reduction in the total GHG allowances distributed. The
target has been increased to 2.2% GHG reductions in the fourth commitment period (2021-2030).Date April 2020
Page 16/17
Subject The Myth of Oversupply
Annex 4:
A side note concerning additionality of the CDM
It is sometimes claimed that 80% of the CDM credits are not additional. We reject these assertions
on the basis that they are not substantiated by facts. For example, 0.9 billion CDM credits (out of a total
1.966 billion issued credits – 46% of all issuances) originate from HFC, N2O or PFC projects. The nature
of these projects means that there are no other revenues besides the CDM revenue stream and hence
these projects are additional.
The remaining 54% of the registered projects have successfully passed very restrictive financial or
barrier tests in order to demonstrate that they would not have been implemented without the revenues
from the accruing emissions. For example, if a company usually has an internal rate of return of 8% but a
project without CDM revenues would deliver only 7%, the project starts only by taking CDM revenues into
account that are expected to shift the internal rate of return from 7% to above 8%. These figures had to
be tested and validated in order to register such projects with the CDM. The NewClimate paper’s assertion
that 80% of CDM projects are not additional (based on a separate, third-party study) incorrectly discredits
the global industry. Moreover, the fact that some projects are still operating without the full projected CDM
revenues is not evidence of a lack of additionality. Our members can attest to the pragmatic approaches
employed by investors to keep carbon projects running with lower than expected internal rates of return,
in order to ensure that their investments are not entirely written off. While such approaches are to be
applauded from a climate mitigation perspective, they do not promote or incentivise further investments
into climate mitigation projects.You can also read