THE NEW ERA OF REGIONAL COASTAL BATHYMETRY FROM SPACE: A SHOWCASE FOR WEST AFRICA USING SENTINEL-2 IMAGERY - EARTHARXIV
←
→
Page content transcription
If your browser does not render page correctly, please read the page content below
The New Era of Regional Coastal Bathymetry from
   Space: A Showcase for West Africa using Sentinel-2
                       Imagery
  Christopher Dalya,∗, Wassim M. Babab , Erwin W. J. Bergsmac , Rafael
                        Almara , Thierry Garland
          a
         LEGOS/IRD, UMR-5566, 14 Avenue Edouard Belin, 31400 Toulouse, France
      b
        LEGOS/CNRS, UMR-5566, 14 Avenue Edouard Belin, 31400 Toulouse, France
      c
        LEGOS/CNES, UMR-5566, 14 Avenue Edouard Belin, 31400 Toulouse, France
                  d
                    SHOM, 13 rue du Chatellier, 29200 Brest, France

Abstract
    Large-scale coastal bathymetry is an essential data product for use in
coastal research and governance. Traditional methods of measuring bathymetry,
using sonar deployed from ships, take an enormous amount of time to col-
lect and process, and thus prevent the gathering of data at high spatial and
temporal resolution at a regional scale. Space-borne missions, such as the Eu-
ropean Space Agency’s Sentinel-2 mission, offer a solution to this limitation
by frequent sensing at a global scale, with repeat observations every 5 days at
the equator or less at higher latitudes. Satellite-derived bathymetry has of-
ten been associated with methods which exploit water colour to invert depth.
However, depth can also be inverted from wave celerity using the linear dis-
persion relation. Here, we use a recently developed algorithm, S2Shores
(Satellite to Shores), to extract wave celerity from the Sentinel-2 dataset by
exploiting the small temporal offset between the image bands of its Multi-
Spectral Instrument. The resulting bathymetry estimates are then merged
to create a mosaic of composite depth estimates spanning 4000 km along the
West African coast. Given the scarcity of in-situ measured bathymetry in
the region, the resulting atlas is compared to GEBCO, a global bathymetry
dataset created by assimilating ship soundings with altimeter data. S2Shores
is able to detect depths up to 20–40 m for West Africa, depending on mean

  ∗
      Corresponding Author: christopher.daly@ird.fr

Preprint submitted to Remote Sensing of Environment                 May 11, 2020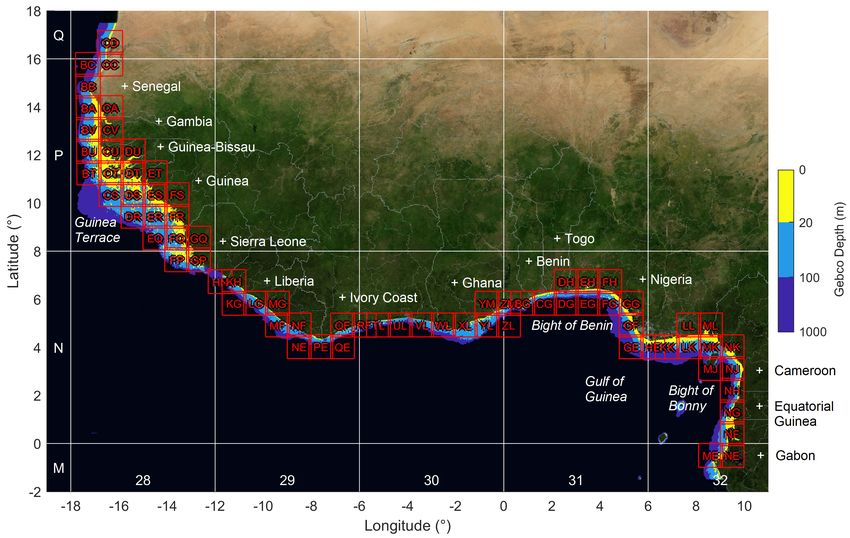
incident wave conditions and cloud cover, which varies by location. Shallow
water features between 2–15 m are well reproduced by S2Shores, such as
flow channels in Guinea, the St. Ann’s Shoal in Sierra Leone, and ebb delta
lobes at several outlets along the Niger River Delta. Bathymetry data for
the Senegalese coast is used to validate the S2Shores results, with very good
results in shallow water. This new Coastal Atlas of West Africa opens the
door to increased research and planning capabilities for the region, and sets
an example that can be applied to the rest of the world.
Keywords: Optical Imagery, Waves, West Africa, Underwater Features,
Satellite-Derived Bathymetry

1. Introduction
    Accurate, highly resolved O(100 m) coastal bathymetry is a vital dataset
heavily used in science, industry, governance, military and civilian applica-
tions, as the change of bathymetry provides fundamental understanding of
the natural behaviour of coastlines and the impacts of engineering projects,
and it serves as a boundary condition for numerical studies. Traditionally,
acoustic (single-track and multi-beam echo sounders) methods have been
used to collect bathymetry data; but even with the best efforts, it is not
cost-effective for mapping coastal areas on a regional or even global scale, as
only 18% of the world’s oceans and 50% of coastal areas have been surveyed
at 1-minute resolution (Becker et al. (2009); GEBCO Compilation Group
(2019)). As such, the hydrographic community has turned to remote sensing
techniques to help fill gaps between sparse records of acoustically-measured
depths. The General Bathymetric Chart of the Oceans (GEBCO, (GEBCO
Compilation Group, 2019)), one of few publicly available global bathymetry
datasets, is created by using the gravity anomaly from satellite altimetry
data, which is related to variations in-depth, to interpolate depths between
in-situ soundings (Smith and Sandwell, 1997, 2004). As most soundings are
located in deep oceanic waters, coastal areas (< 100 m depth) are often
poorly resolved, especially where there are abrupt changes in the shelf-slope,
resulting in unrealistic representation of shallow features such as deltas and
atolls. The quality of GEBCO depth estimates is also limited by the spar-
sity of its source data, especially in data-poor regions such as West Africa.
Coastal bathymetric surveys in this area are 30 years old on average (as

                                      2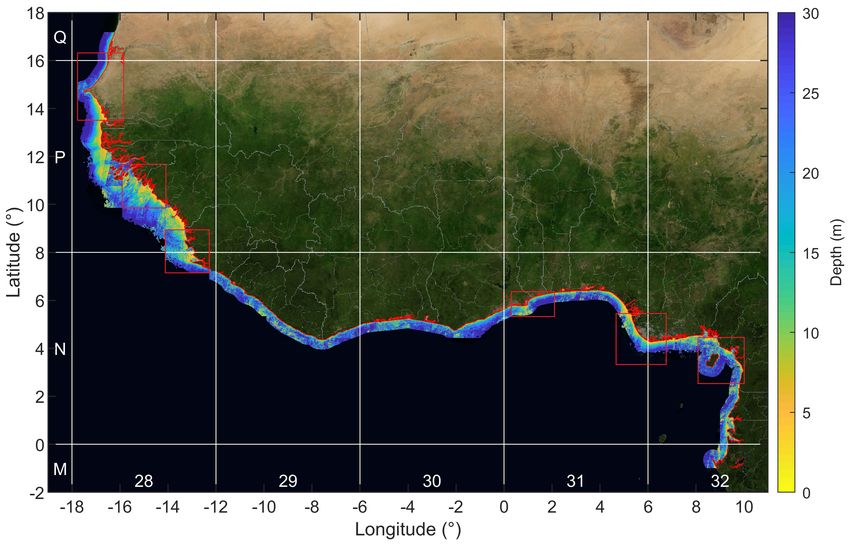
shown in GEBCO metadata 1 ). The lack of detailed coastal bathymetric
data leads to unacceptable uncertainties in coastal wave and flood models,
in subsequent risk assessments and forecasts, and currently limits the best
coastal management strategies for the region (Ndour et al. (2018)).
    Additional methods of direct depth measurement using Earth Observa-
tion remote sensing techniques are therefore needed to produce large-scale
(i.e. regional to global) bathymetries (Salameh et al., 2019). This may be
achieved using aircraft (e.g. LiDAR) or satellite-derived bathymetry (SDB),
either using radar or optical missions. For the latter, the two most advanced
techniques which allow direct measurement of depth by satellite are water-
colour (Stumpf et al., 2003; Lyzenga et al., 2006; Lee et al., 2010; Hodúl
et al., 2018) and wave kinematics (Poupardin et al., 2016; Danilo and Mel-
gani, 2016; Almar et al., 2019a; Bergsma et al., 2019b). SDB methods which
rely on colour and light absorption as a proxy from which to estimate depth
are limited to shallow water — with maximum detectable depths of approx-
imately 15 m, absolute errors of ∼ 30% of the target value, and root-mean-
square errors up to 4 m (Pacheco et al., 2015; Chénier et al., 2018; Traganos
et al., 2018). These methods are sensitive to local environmental condi-
tions which affect water clarity, such as turbidity and bottom vegetation,
and light absorption in the atmosphere. Methods using wave kinematics,
on the other hand, exploit timing differences between a sequence of satel-
lite images (or image bands) of the sea surface taken in rapid succession to
detect the movement of surface waves. For example, satellite images from
the Pleiades satellite mission (Airbus/CNES) can collect a burst of up to 12
high-resolution (0.5 m) images timed 8 s apart Almar et al. (2019a), while
the Multi-Spectral Instrument (MSI) of the Sentinel-2 mission (ESA), col-
lects surface reflectance data with a maximum 1.005 s interval between 10
m resolution bands. Various analytic techniques can then be used to extract
celerity data from the image sequences, either in the temporal (Almar et al.,
2019a) or spectral-domain (Bergsma et al., 2019a).
    Here, we use a recently developed method for estimating coastal bathymetry
using multiple Sentinel-2 colour-bands (Bergsma et al., 2019a,b). The method,
called Satellite to Shores (hereafter S2Shores), exploits the time difference be-
tween the blue and red colour bands in Sentinel RGB images (2 frames taken
1.005 s apart) to track the movement of surface waves over time and space.

  1
      https://maps.ngdc.noaa.gov/viewers/iho dcdb

                                          3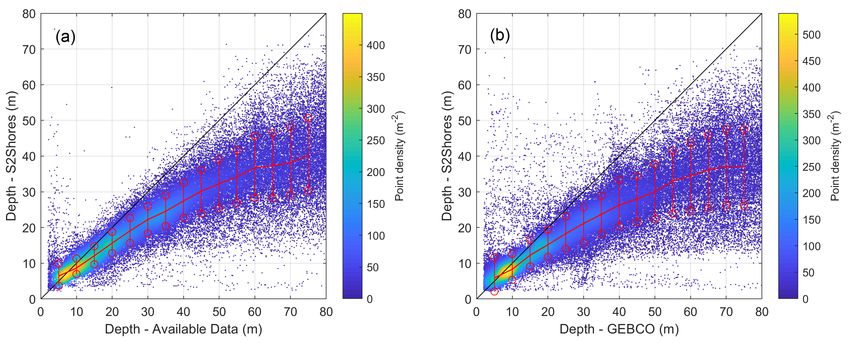
A novel localized Radon Transform combined with a Discrete fast Fourier
Transform (DFT) technique is used to determine the dominant wave direc-
tion and corresponding wavelength and celerity at the peak image intensity.
Water depths can then be inverted using the linear dispersion relationship
with reasonable accuracy. Using wave kinematics as input allows maximum
depths up to 100 m to be detected (theoretically) under optimal wave con-
ditions (i.e. long swell) (Bergsma and Almar, 2020). This breakthrough
technique, therefore, allows depth estimation in most coastal environments
exposed to waves without dependence on water clarity or atmospheric light
absorption (Bergsma and Almar, 2020).
    Here we present the first regional SDB atlas along the West African coast
(West Coast and Gulf of Guinea, from Senegal to Gabon). In this region,
253,970 km2 of the continental shelf lies within a depth range of 0–100 m
(coastal zone), based on GEBCO data. Of this coastal zone, 18% (70,700
km2 ) lies between 0–15 m depth — the sensing range of most colour-based
methods. On the other hand, 70% (178,060 km2 ) of the target area lies
between 2–50 m depth — the average sensing range of most wave-based
methods for this region (Bergsma and Almar, 2020).

2. Methods
2.1. Area of Interest
    The area of interest (AoI) spans the coastal area of West Africa and
the Gulf of Guinea between Senegal and Gabon. This 4000 km length of
coastline, covered by 73 Sentinel-2 tiles, consists of a wide range of coastal
features and types, including long sandy beaches, barrier islands, rocky capes,
submarine canyons, offshore islands, estuaries, and deltas (Fig. 1). The width
of the shallow coastal zone in the AoI varies considerably. It is widest (< 25
km) in the deltaic region spanning the Gambia, Guinea-Bissau, Guinea and
Sierra Leone (the Guinea Terrace) (McMaster et al., 1970; Anthony, 2004),
and along the Niger Delta. It is mildly sloping in Senegal (10–20 km wide),
the Bight of Benin and Bonny, and most narrow (> 5 km) along the coast
of Liberia, immediately north of Dakar and around Bioko Island, Equatorial
Guinea.
    The West African coast from Senegal to Liberia generally faces westerly
Atlantic swells, while Ivory Coast to Nigeria is exposed to south Atlantic
swells (Almar et al., 2019b). Cameroon to Gabon, in the Bight of Bonny
(Biafra), is relatively sheltered by offshore islands (e.g. Bioko, Equatorial

                                      4
Figure 1: Area of interest in West Africa and Gulf of Guinea, from Senegal in the north
to Gabon in the south. GEBCO bathymetry contours shown at 0, 20, 100 and 1000 m
depths. The 73 red squares show the group of Sentinel 2 coastal tiles making up the
study area, along 400 km of coastline. Each tile is 109 × 109 km. The name of each tile
is constructed by using the UTM zone corresponding to the coordinates of its lower left
corner as a prefix (UTM zone grid shown in white) and a sub-UTM zone identifier as a
suffix (shown at the center of each square, in red). For example, 28PBB is the tile where
Dakar, Senegal (the westernmost point in Africa) is located. Background image: MODIS
Blue Marble, NASA Earth Observatory.
Guinea). Seasonality in wave conditions is observed along the entire West
African coast. The Volta and Niger rivers produce the two largest deltas
along the coast. Sediment supply from these deltas is constantly moved
alongshore by long swell waves which drive persistent eastward longshore
transport between Ghana and Nigeria (Anthony et al., 2016; Almar et al.,
2015; Giardino et al., 2018). As such, these areas are susceptible to ongoing
erosion at the western side and accretion at the east (Dada et al., 2016;
Anthony et al., 2019).
Mean cloud cover varies over the AoI, with occasional cloud cover at
Senegal (coastal area in close proximity to the Sahara Desert), with < 20%
coverage 50% of the time, and increasingly persistent cloud cover further
5south in tropical equatorial regions, especially in the Bight of Bonny, with
up to < 80% coverage 50% of the time (Bergsma and Almar, 2020).
Six ’hot-spots’ are identified within the AoI, covering the full range of
coastal types. They are, namely, Senegal, Guinea, Sierra Leone, Volta Delta,
Niger Delta, and Cameroon. The hot-spots are excellent validation sites for
the S2Shores model because of the diverse range of coastal features, wave
exposure and cloud cover at each location.
2.2. Pre-Selection and -Treatment of Satellite Images
The recently launched Copernicus Sentinel-2 Mission2 captures multi-
spectral satellite image data every 5 days at the equator. There are therefore
approximately 6 images per month at a particular location which may be
used for depth estimation. Each Sentinel-2 satellite image has 13 spectral
bands with a footprint of 109.8×109.8 km. Of the 13 spectral bands, four
are sampled at 10-meter resolution, of which three represent visible colours
blue, green and red (bands 2-3-4, respectively), while band 8 represents the
near-infrared (NIR) part of the electromagnetic spectrum. Data from bands
3 and 8 are used in the analysis of pre-selection and subsequent treatment.
The Sentinel-2 image database currently spans a period of 5 years from
2015 to present, resulting in at least 200 images per tile (single orbit). With
such a large number of observations, a global analysis including all images
will be inefficient and unconscionable, thus here the best images are selected
and analysed. Images that are likely to produce the best results are those
which are relatively cloud-free, and have observable wave-fields (the greater
the wave height, the better) and which travel at sufficient speed such that
changes in phase can be easily detected (the longer, the better). The com-
bination of these two criteria makes the wave power (∝ height2 ×period) an
obvious and effective proxy for selecting the best times for carrying out the
analysis. As such, hindcast wave data from the European Centre for Medium-
Range Weather Forecasts (ECMWF) ERA5 global dataset (Dee et al., 2011;
Copernicus Climate Change Service (C3S), 2017) was used to determine the
background wave conditions and cloud cover for each image of the 72 selected
West Africa tiles between September 2015 and February 2020. The data was
sorted to minimise cloud cover (top 50 per tile) and, subsequently, maximise
the wave power (top 30 per tile).
2
https://sentinel.esa.int/web/sentinel/missions/sentinel-2
6For analysis in S2Shores, following Baba et al. (In Prep), each top-30
image is broken down into 36 18.3×18.3 km sub-images for parallel compu-
tation on a multi-core processor high-performance computing server (HAL,
CNES). Depth estimates are produced on a 200×200 m output grid, with
therefore just over 300,000 depth estimates per image (if completely covered
by water). A global land mask at 150 m resolution, produced by the ESA
Climate Change Initiative 3 (Lamarche et al., 2017), is used to identify land
areas which are excluded from the computations. For a detailed explanation
of the computational implementation of S2Shores, the reader is directed to
Baba et al. (In Prep).
2.3. Bathymetry Estimation
Depth estimates are produced according to the method outlined in Bergsma
et al. (2019b), which uses a combined Radon and discrete fast-Fourier trans-
form method (hereafter, RT and DFT), also known as Fourier-Slicing, to
detect wave signals within a sub-window of the satellite image. Depth es-
timation is repeated for each sub-window around a point where one wants
to know the depth (h). The sub-window should be large enough to contain
1–2 wavelengths (λ). Thus, a minimum window size of 300m is used at the
shoreline, and increases incrementally –following the formulation in Bergsma
et al. (2019b)– up to a maximum of 600 m in areas farther from land (10
km), where depths are expected to be greater and wavelengths longer. The
RT of the wave signal in the sub-window produces a sinogram of integrated
pixel intensities per direction. The wave direction is determined as the angle
corresponding to the maximum variance in the RT-sinogram. The DFT of
the RT enables the spectral phase of the waveforms to be determined per
direction, the difference of which (∆Φ) can be found between several pairs
of detector bands. Presuming that the wavenumber (k) is constant or near-
constant over the sub-window, ∆Φ can be seen as representative of ω (t), and
given that the timing between the different detector bands (∆t) is constant,
the wave celerity (c) can be determined as:
∆Φ ∆Φλ
c= = (1)
2πk∆t 2π∆t
For each wave-number or celerity pair, (2) can be solved for depth.
3
http://maps.elie.ucl.ac.be/CCI/viewer
7
                                                  −1       c2 k
                          g                tanh             g
                    c2 =    tanh(kh) ⇔ h =                            (2)
                          k                     k
    Estimates of water depth, wave celerity, wavenumber (wavelength) and
direction are output by the S2Shores algorithm at each point on an output
grid with a resolution of 200 m. This output data is further treated as
outlined in the section following.

2.4. Post-processing of Depth Estimates
2.4.1. Data Masking
    Masks are applied to the S2Shores output to remove unreliable depth
estimates, primarily associated with clouds. Cloud masks are created using
a simple threshold on the NIR band, assuming the majority of NIR radiation
is absorbed by water bodies and reflected by clouds. A threshold of 0.02
is used on the normalized NIR reflectance (c.f. Banks and Mélin (2015))
to identify cloudy pixels, and areas within 100 m of such pixels are also
masked. This NIR cloud mask removes most dense/opaque clouds; however,
light cirrus clouds are not easily detected. Therefore, pre-made clouds masks
from the Sentinel-2 database (Copernicus Data Access Portal, 2020) are also
used to augment the NIR cloud mask.
    Output data are also masked where unrealistic depth or celerity estimates
occur. Given that the expected maximum (minimum) wave period is 20 (4) s,
S2Shores should ideally detect wave celerity between 4 – 34 m/s (± 10%) for
depths ranging between 2 – 100 m. Areas, where depth or celerity estimates
are greater or less than this expected detection range, are removed from the
analysis.

2.4.2. Creation of Depth Composite and Mosaic
    After running S2Shores for the top-30 images for each of the 73 West
Africa tiles, the 10 best (raw) results are selected to create a composite. This
selection is based on minimising the error and maximising the correlation
between the S2Shores results and GEBCO (between 2 – 45 m depth). It is
then necessary to weight the raw depth results at each point to account for
differences in wave conditions over time, as waves with longer period are able
to sense deeper water depths. In ’shallow’ water (raw mean depth < 20 m)
results closer to the median value are used, while in ’deep’ water (raw mean
depth > 20 m) results closer to the maximum value are used. The final step

                                       8
is to smooth the (temporally) weighted depth with neighbouring points in
space (within 2 grid cells, or a 1 km radius) to reduce artefacts. The final
73 depth composites are then tiled together to create a depth mosaic for the
entire study area.
2.5. Comparative Bathymetry Datasets
S2Shores depth estimates have to be compared to measured data to de-
termine its quality. Besides GEBCO, publicly available coastal bathymetry
datasets are difficult to source for the study area and tend to be quite dated.
Privately held data at the French Naval Hydrographic and Oceanographic
Service (SHOM) was obtained for the Senegalese coast (hereafter referred
to as the ’available data’), but not for the remaining portions of the West
African coast. Therefore, comparisons made with the available data at the
Senegal hot-spot will help to show the accuracy of the S2Shores results, while
more general comparisons with GEBCO are made elsewhere.
3. Results
3.1. Regional West African Bathymetry
S2Shores estimates of the regional West African bathymetry are shown
as a mosaic for all 73 selected Sentinel-2 coastal tiles (Figure 2). Depths
are shown at a resolution of 1 km and are plot out to a distance of 45 km
offshore (or to the extent of the 100 m contour line in GEBCO, whichever
is greater), covering the contiguous coastal zone (12 nautical miles) of each
member state. At this scale, it is possible to observe the extent of the upper,
shallow portion of the shelf. It is widest between Guinea-Bissau and Sierra
Leone, and at the Niger Delta, and most narrow between Liberia, Ivory Coast
and Ghana. At this scale, deep features (> 30 m depth, such as submarine
trenches) are not easily distinguished from the general background. However,
more shallow features, such as ebb delta channels around the Bissagos Islands
(Guinea-Bissau) and the St. Ann’s Shoal in Sierra Leone are captured very
well.
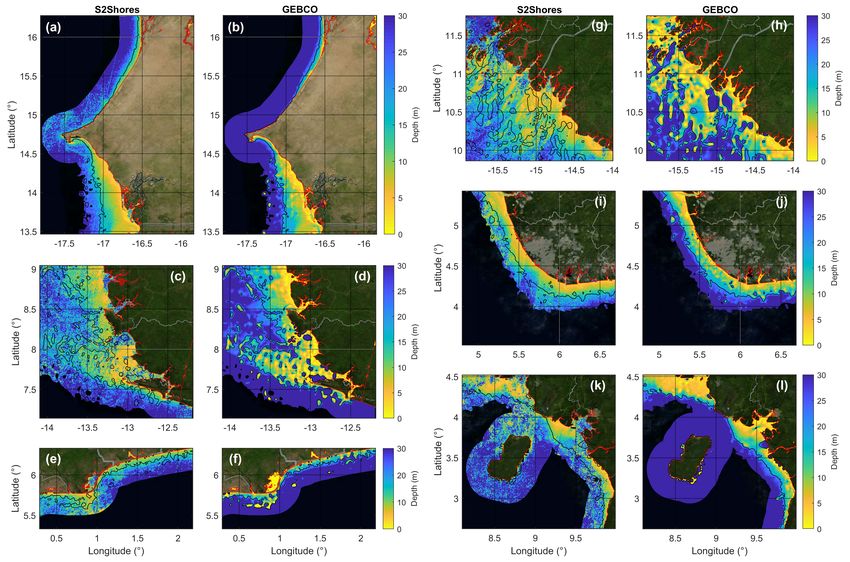
3.2. Zoom at Hot-Spots
Figure 3 shows close-ups of the S2Shores depth composites at the six hot-
spots compared to GEBCO, highlighting the ability of the model to discern
depth patterns at a local scale. Here, the data is shown at 200 m resolution
and at least up to 30 km from the shoreline.
9Figure 2: Mosaic of S2Shores bathymetry composites for the West Africa Region. Color
scale shows depths between 0–30 m, the red line shows the shoreline, and UTM zones
shown in white. Red boxes outline the area of the six hot-spots. Background image:
MODIS Blue Marble, NASA Earth Observatory.
The best comparison between GEBCO and S2Shores is at Senegal (Figure
3 a–b). As mentioned in Section 2, this section of the West African coast is
exposed to long-period Atlantic swell. This, coupled with low cloud cover on
average, allows S2Shores to predict smooth transitions from deep to shallow
water. The area immediately south of the Dakar peninsula is well-predicted
despite the more restrictive conditions for obtaining viable estimates, due to
wave shadowing effects of the Dakar peninsula and the change in orientation
of the shoreline concerning the incident wave field. The shallow area of the
remaining portion of the coast in the south broadens as expected, compared
to GEBCO, heading toward the deltaic region of Guinea-Bissau. Maximum
depth estimates at this location are approximately 40 m.
In contrast to Senegal, maximum depth estimates at the Cameroon hot-
spot (Figure 3 k–l), located in the Bight of Bonny, are shallower at around
22 m, primarily due to lower wave periods and a vast reduction in usable
data after masking out clouds. However, despite the year-round high cloud
10Figure 3: Comparison between S2Shores bathymetry composite and GEBCO for the six
hot-spots. (a-b) Senegal (tiles 28PCC, 28PBB, 28PBA, 28PBC and 28PCA). (b-c) Sierra
Leone (tiles 28PFQ, 28PGQ, 28NFP and 28NGP). (e-f) Volta Delta (tiles 30NBG and
30NCG). (g-h) Guinea (tiles 28PDS, 28PTS, 28PET and 28PDT). (i-j) Niger Delta (tiles
31NHE, 31NGE and 31NGF). (k-l) Cameroon (tiles 32NNK, 32NNJ, 32NMK and 32NMJ).
Color scale shows depths between 0–30 m, the black line shows the 20 m GEBCO depth
contour, and the red line shows the shoreline. Background image: MODIS Blue Marble,
NASA Earth Observatory.
cover, quite good estimates of shallow nearshore banks at the entrance to
the Wouri estuary are obtained, as can also be seen in GEBCO. As the
shelf around Bioko Island (Equatorial Guinea) is extremely narrow, there
are limited shallow S2Shores results there, similar to GEBCO.
At the Sierra Leone and Guinea hot-spots (Figure 3 c–d and g–h), shal-
low features present on the wide continental shelf are detected by S2Shores.
Channel features at the Guinea hot-spot are more clearly resolved by S2Shores
than GEBCO. In fact, the GEBCO estimates for the same area show sporadic
blobs where depths vary from deep to shallow, with little alignment toward
a natural offshore flow direction of the channels. The defining shallow water
feature at the Sierra Leone hot-spot is the St. Ann’s shoal, located north-
11Figure 4: Scatter plot of S2Shores depth estimates against available data at Senegal (a)
and Volta Delta (b). Black line indicates the target depth (1:1 comparison), the red line
shows the mean trend of the S2Shores estimates in 5 m-wide bins, and the red circles show
the standard deviation about the mean of each bin. Colour scale indicates the density of
points within a 1 m2 area of the plot.
west of the Turtle and Sherbro Islands. Here, rhythmic underwater dune
features are discernible in the S2Shores results, with heights between 8–12
m and wavelengths of 6–7 km. Predicted S2Shores depths on the wide con-
tinental shelf around the Guinea and Sierra-Leone hot-spots are limited by
its inherent shallowness, with depth saturation at 20 and 27 m, respectively.
However, the southern edge of the shelf in Sierra Leone is clearly shown down
to depths of 35 m.
At the Volta Delta, S2Shores shows similar depth patterns as GEBCO to
the east of the delta apex, but generally shallower depths to the west. The
shelf is wider in the west, extending up to 20 km offshore, and is about 10 km
in the east. S2Shores appropriately captures the location of sharp changes in
depth at the shelf edge, which starts to drop steeply after 25 m depth. The
Niger Delta area is also nicely estimated by S2Shores, with deep channels
seen at the mouth of the Niger river at Forcados, and crescent-shaped outer
delta lobes at several other mouths such as at Digatoro, Sangan, Nun and
Brass. Shallow areas (down to 20 m) extend further seaward in the S2Shores
predictions than GEBCO, with a depth saturation occurring at 30 m.
3.3. Validation Error at Senegal
The quality of the S2Shores results is assessed by comparing output at the
Senegal hot-spot to the available bathymetric data (and to GEBCO). High
correlation coefficients (r2 ) are obtained for depths between 2–35 m, with a
12value of 0.78 for the available data (and 0.62 for GEBCO). The linear best-fit
for the same depth range has a gradient of 0.64 and intercept of 3.0 m, for the
available data. Scatter plots of the results (Figure 4a and b for the available
data and GEBCO, respectively) show that as the target depth increases,
S2Shores tends to increasingly underestimate its value. This response is
expected, however, as ever longer waves are required to sense small changes
in celerity in deeper waters, leading to the saturation of depth estimates as
the target depth increases. Thus, the mean trend of the S2Shores estimates
begins to flatten out at around 40 m compared to the available data (37 m
compared to GEBCO). Despite this, estimates in shallow water (between 2–
15 m), where majority of the depth estimates lie, are very close to the target
depth. There, the absolute error is approximately 20% of the target value
on average, with the root-mean-square-error (RMS error) and bias being 3.0
and -0.5 m, respectively.
4. Discussion
4.1. Performance of S2Shores
The results have shown that S2Shores is able to detect depths down to 40
m under ideal conditions, as is the case for Senegal which experiences long
swell and low cloud cover for most of the year. This depth range is up to three
times greater than the typical range of colour-based SDB methods. Further-
more, the estimation of depth over such a large area for the West African
coastal zone, O(100,000 km2 ), is quite unique for SDB methods, which are
normally carried out in very localized areas O(1,000 km2 ). For the hot-spots,
depths below 15 m are well estimated and many shallow-water features are
apparent. As shown Figure 4, estimated depths begin to diverge from the
target depth below 20 m. However, if a larger number of observations are
used in making the composite (besides only the top-10), the probability of
retrieving better deepwater estimates under ideal wave and cloud cover con-
ditions will be increased. This, however, is a limitation of computational
resources rather than the method itself. However, in future developments, it
may be possible to develop site-specific corrections for depths below 20 m.
4.2. Dependency of Quality on Meteorological Conditions
The S2Shores algorithm produces useful estimates once a distinct wave-
field can be observed. However, in reality, the actual variation of pixel in-
13tensities is heavily influenced by meteorological conditions of the wave field
and atmosphere, and to a lesser extent by water colour transitions.
By analysing the result of one years’ worth of observations at the Senegal
and Volta hotspots (72 Sentinel-2 images at tiles 28PCC and 31NBG), sev-
eral error parameters were determined: namely the bias, root-mean-square
error, correlation (r2 ) and slope of the linear regression between S2Shores es-
timates and available data. A quality flag was also manually attached to each
estimate to signify whether the S2Shores result was good, mediocre or bad.
Good estimates had clear transitions of depth from shallow to deep, mediocre
results tend to be monotonous, and bad results have significant depth arti-
facts, mainly as a result of high cloud cover coupled with imperfect cloud
masks.
Fitting a multiple linear regression model of various local wave meteo-
rological parameters (e.g. significant wave height, wind direction) to the
measured error allows us to determine which are most influential. From this
analysis, the r2 and bias are consistently the best error descriptors, and the
mean period of swell waves, the wave power, directional spreading and cloud
cover are consistently among the most influential parameters affecting the re-
sult of the S2Shores estimate. Powerful swell waves (with large heights and
long wavelengths/periods) travel faster than the background wind waves and
are more easily detected in the algorithm. These waves also allow for deeper
estimates of depth. Narrow banded swell reduces potential cross-sea pat-
terns, which may create multiple peaks in the directional space of the pixel
intensity. Furthermore, short steep waves (even if they are less energetic)
may have a larger optical signature than longer, flatter waves, which results
in an under-estimation of the depth. While opaque clouds block the view of
the sea surface, light cirrus clouds, fog or atmospheric dust also obscure the
field of view and lead to unreliable estimates.
4.3. Perspectives
The ability to frequently and accurately monitor bathymetric changes
over large scales will significantly help to broaden our understanding of dy-
namic coastal processes and their coupling to large-scale forcing conditions.
While we have currently used images taken over a 5-year period, S2Shores
composites computed over shorter time periods offer the possibility to create
unique time series of bathymetry and thus observe dynamic changes of shal-
low water features, such as delta formations or underwater dune migration.
14Producing composites of seasonal (3-4 months) to weekly changes (at or
near the satellite revisit time) in bathymetry at regional scales are possible;
however, accurate sensing of depths below 20 m will depend heavily on the
probability of occurrence of successive high energy wave conditions over a
short space of time. Thus, detecting bathymetric changes with reasonable
accuracy over short periods will most likely be limited to shallow water <
15 m. Nonetheless, as bathymetric changes tend to be more rapid in shallow
water than deepwater, depth changes may still be detected over the entire
water column at various timescales with adaptive windowing.
Finally, the 73 Sentinel-2 tiles selected for the West Africa atlas represents
1% of the global list of Sentinel-2 coastal tiles, with depths between 0–100
m. With such promising results as shown, there is definite potential for the
method to be further applied on a global scale. The spatial resolution of the
estimates may also be decreased from the 200 m used for this study (initial
tests were carried out on a 100 m grid). A lower limit of 50 m is possible,
and would potentially permit the visualisation of features such as sandbars.
However, it would come at a much higher computational cost, and would
therefore be more suited for generating datasets at a local level.
5. Conclusion
Most coastal areas in the world suffer from a lack of existing quality
bathymetry, with no or decades old observations. Satellite Earth observation
opens the new era of measuring coastal bathymetry from space. However,
commonly used colour based depth inversion methods are often limited in
turbid coastal areas. The S2Shores algorithm, based on extracting wave
kinematics from within Sentinel-2 multi-spectral image bands, has been used
to produce unprecedented fine resolution O(100 m) regional-scale coastal
bathymetry from satellite along 4000 km of the West African coastline and
almost 70% of the coastal zone of the continental shelf. The method is able to
detect depths down to 40 m, and offers the potential to monitor the dynamics
of shallow coastal features, such as deltas, shoals and underwater dunes. This
new Coastal Atlas of West Africa opens the door to increased research and
planning capabilities for the region, and sets an example that can be applied
to the rest of the world, on a regular basis.
15Acknowledgements
This study was carried out as part of the project MEPELS, performed
under the auspices of the DGA, and led by SHOM. E.B. was funded through
a post-doctoral fellowship of the French Space Agency (CNES). The authors
would like to thank members of the PEPS and HAL teams at the CNES Cal-
culation Center, especially Christophe Taillan, Erwann Poupart, Guillaume
Eynard-Bontemps, Florent Ventimiglia, and Sylvain Rigole, for providing
technical support in accessing the Sentinel data products and developing
parallel computing scripts for the CNES High Performance Cluster.
Author Contributions
Conceptualization: RA and EB. Methodology and Data Processing: EB,
WB and CD. Data Analysis and Interpretation: CD. Writing – Original
Draft: CD. Writing – Review and Editing: All authors. Project Administra-
tion and Funding: RA and TG.
References
Almar, R., Bergsma, E.W.J., Maisongrande, P., Almeida, L.P.M., 2019a.
Wave-derived coastal bathymetry from satellite video imagery: A showcase
with pleiades persistent mode. Remote Sensing of Environment 231, 8 pp.
Almar, R., Kestenare, E., Boucharel, J., 2019b. On the key influence of re-
mote climate variability from tropical cyclones, north and south atlantic
mid-latitude storms on the senegalese coast (west africa). Environmen-
tal Research Communications 1, 11 pp. doi:https://doi.org/10.1088/2515-
7620/ab2ec6.
Almar, R., Kestenare, E., Reyns, J., Jouanno, J., Anthony, E., Laibi, R.,
Hemer, M., DuPenhoat, Y., Ranasinghe, R., 2015. Response of the bight
of benin (gulf of guinea, west africa) coastline to anthropogenic and natural
forcing, part1: Wave climate variability and impacts on the longshore
sediment transport. Continental Shelf Research 110, 48–59.
Anthony, E., Almar, R., Aagaard, T., 2016. Recent shoreline changes
in the volta river delta, west africa: the roles of natural processes
and human impacts. African Journal of Aquatic Science 41, 81–87.
doi:http://dx.doi.org/10.2989/16085914.2015.1115751.
16Anthony, E., Almar, R., Besset, M., Reyns, J., Laibi, R., Ranasinghe, R.,
Abessolo Ondoa, G., Vacchi, M., 2019. Response of the bight of benin (gulf
of guinea, west africa) coastline to anthropogenic and natural forcing, part
2: Sources and patterns of sediment supply, sediment cells, and recent
shoreline change. Continental Shelf Research 173, 93—-103.
Anthony, E.J., 2004. The turtle bank, sherbro bay, west africa: estuarine-
modified inner shelf shoal?, in: Proceedings of Marine Sandwave and River
Dune Dynamics, Enschede, the Netherlands. p. 8 pp.
Baba, W.M., Bergsma, E.W.J., Almar, R., Daly, C.J., In Prep. Deriv-
ing large-scale coastal bathymetry from sentinel-2 images using a high-
performance cluster. Consideration for Remote Sensing (MDPI) .
Banks, A.C., Mélin, F., 2015. An assessment of cloud masking schemes
for satellite ocean colour data of marine optical extremes. International
Journal of Remote Sensing 36, 797–821.
Becker, J., Sandwell, D., Smith, W.H.F., Braud, J., Binder, B., Depner,
J., Fabre, D., Factor, J., Ingalls, S., Kim, S.H., Ladner, R., Marks,
K., Nelson, S., Pharaoh, A., Trimmer, R., von Rosenberg, J., Wal-
lace, G., Weatherall, P., 2009. Global bathymetry and elevation data
at 30 arc seconds resolution: Srtm30 plus. Marine Geodesy 32, 355–371.
doi:10.1080/01490410903297766.
Bergsma, E.W.J., Almar, R., 2020. Coastal coverage of esa’ sen-
tinel 2 mission. Advances in Space Research 65, 2636–2644.
doi:https://doi.org/10.1016/j.asr.2020.03.001.
Bergsma, E.W.J., Almar, R., Maisongrande, P., 2019a. Radon-augmentation
of sentinel-ii imagery to enhance resolution and visibility of (nearshore)
ocean-wave patterns, in: Proceedings of the International Geoscience and
Remote Sensing Symposium (IGARSS), IEEE, Yokohama, Japan. pp.
7944–7947. doi:10.1109/IGARSS.2019.8898181.
Bergsma, E.W.J., Almar, R., Maisongrande, P., 2019b. Radon-
augmented sentinel-2 satellite imagery to derivewave-patterns
and regional bathymetry. Remote Sensing 11, 16 pp.
doi:https://doi.org/10.3390/rs11161918.
17Chénier, R., Faucher, M.A., Ahola, R., 2018. Satellite-derived bathymetry
for improving canadian hydrographic service charts. International Journal
of Geo-Information 7, 15 pp.
Copernicus Climate Change Service (C3S), 2017. ERA5: Fifth genera-
tion of ECMWF atmospheric reanalyses of the global climate. Coper-
nicus Climate Change Service Climate Data Store (CDS). URL:
https://cds.climate.copernicus.eu/cdsapp#!/home. accessed: 2020-
01-24.
Copernicus Data Access Portal, 2020. Sentinel-
2 msi level-1c cloud masks. URL:
https://sentinel.esa.int/web/sentinel/technical-guides/sentinel-2-msi/level-1c/c
accessed: 2020-02-26.
Dada, O.A., Li, G., Qiao, L., Ding, D., Ma, Y., Xu, J., 2016. Seasonal
shoreline behaviours along the arcuate niger delta coast: Complex inter-
action between fluvial and marine processes. Continental Shelf Research
122, 51–67. doi:https://doi.org/10.1016/j.csr.2016.03.002.
Danilo, C., Melgani, F., 2016. Wave period and coastal bathymetry using
wave propagation on optical images. IEEE Transactions on Geoscience
and Remote Sensing 54, 6307–6319.
Dee, D.P., Uppala, S.M., Simmons, A.J., Berrisford, P., Poli, P., Kobayashi,
S., Andrae, U., Balmaseda, M.A., Balsamo, G., Bauer, P., Bechtold, P.,
Beljaars, A.C.M., van de Berg, L., Bidlot, J., Bormann, N., Delsol, C., Dra-
gani, R., Fuentes, M., Geer, A.J., Haimberger, L., Healy, S.B., Hersbach,
H., Hólm, E.V., Isaksen, L., Kållberg, P., Köhler, M., Matricardi, M.,
McNally, A.P., Monge-Sanz, B.M., Morcrette, J.J., Park, B.K., Peubey,
C., de Rosnay, P., Tavolato, C., Thépaut, J.N., Vitart, F., 2011. The
era-interim reanalysis: configuration and performance of the data assimi-
lation system. Quarterly Journal of the Royal Meteorological Society 137,
553–597. doi:10.1002/qj.828.
GEBCO Compilation Group, 2019. Gebco 2019 grid. URL:
https://www.gebco.net/data and products/gridded bathymetry data/,
doi:10.5285/a29c5465-b138-234d-e053-6c86abc040b9. accessed: 2019-11-
29.
18Giardino, A., Schrijvershof, R., Nederhoff, C., de Vroeg, H., Brière,
C., Tonnon, P.K., Caires, S., Walstra, D., Sosa, J., van Verse-
veld, W., Schellekens, J., Sloff, C., 2018. A quantitative assess-
ment of human interventions and climate change on the west african
sediment budget. Ocean and Coastal Management 156, 249–265.
doi:https://doi.org/10.1016/j.ocecoaman.2017.11.008.
Hodúl, M., Bird, S., Knudby, A., Chénier, R., 2018. Satellite derived pho-
togrammetric bathymetry. ISPRS Journal of Photogrammetry and Remote
Sensing 142, 268–277. doi:https://doi.org/10.1016/j.isprsjprs.2018.06.015.
Lamarche, C., Santoro, M., Bontemps, S., d’Andrimont, R., Radoux, J.,
Giustarini, L., Brockmann, C., Wevers, J., Defourny, P., Arino, O., 2017.
Compilation and validation of sar and optical data products for a complete
and global map of inland/ocean water tailored to the climate modeling
community. Remote Sensing 9, 20 pp.
Lee, Z., Hu, C., Casey, B., Shang, S., Dierssen, H., Arnone, R., 2010. Global
shallow-water from satellite ocean color data. Eos 91, 429–430.
Lyzenga, D.R., Malinas, N.P., Tanis, F.J., 2006. Multispectral
bathymetry using a simple physically based algorithm. IEEE
Transactions on Geoscience and Remote Sensing 44, 2251–2259.
doi:10.1109/TGRS.2006.872909.
McMaster, R., Lachance, T.P., Ashraf, A., 1970. Continental shelf geomor-
phic features off portuguese guinea, guinea, and sierra leone (west africa).
Marine Geology 9, 203–213.
Ndour, A., Laı̈bi, R.A., Sadio, M., Degbe, Cossi G.E. andDiaw, A.T., Oyédé,
L.M., Anthony, E.J., Dussouillez, P., Sambou, H., Dièye, E.h.B., 2018.
Management strategies for coastal erosion problems in west africa: Analy-
sis, issues, and constraints drawn from the examples of senegal and benin.
Ocean and Coastal Management 156, 92–106.
Pacheco, A., Horta, J., C. Loureiro, C., Ferreira, O., 2015. Retrieval of
nearshore bathymetry from landsat 8 images: A tool for coastal monitoring
in shallow waters. Remote Sensing of Environment 159, 102––116.
19Poupardin, A., Idier, D., de Michele, M., Raucoules, D., 2016. Water depth
inversion from a single spot-5 dataset. IEEE Transctions on Geoscience
and Remote Sensing 54, 2329–2342.
Salameh, E., Frappart, F., Almar, R., Baptista, P., Heygster, G., Lubac,
B., Raucoules, D., Almeida, L.P., Bergsma, E.W.J., Capo, S., De Michele,
M., Idier, D., Li, Z., Marieu, V., Poupardin, A., Silva, P.A., Turki, I.,
Laignel, B., 2019. Monitoring beach topography and nearshore bathymetry
using spaceborne remote sensing: A review. Remote Sensing 11, 32 pp.
doi:10.3390/rs11192212.
Smith, W.H., Sandwell, D.T., 2004. Conventional bathymetry, bathymetry
from space, and geodetic altimetry. Oceanography 17, 8–23.
Smith, W.H.F., Sandwell, D.T., 1997. Global sea floor topography from
satellite altimetry and ship depth soundings. Science 277, 1956–1962.
Stumpf, R.P., Holderied, K., Sinclair, M., 2003. Determination of water
depth with high-resolution satellite imagery over variable bottom types.
Limnology and Oceanography 48, 547––556.
Traganos, D., Poursanidis, D., Aggarwal, B., Chrysoulakis, N., Reinartz, P.,
2018. Estimating satellite-derived bathymetry (sdb) with the google earth
engine and sentinel-2. Remote Sensing 10, 18 pp.
20You can also read