The Open Transportation Journal
←
→
Page content transcription
If your browser does not render page correctly, please read the page content below
Send Orders for Reprints to reprints@benthamscience.ae
124                                        The Open Transportation Journal, 2016, 10, 124-136

                                 The Open Transportation Journal

                                             Content list available at: www.benthamopen.com/TOTJ/

                                                     DOI: 10.2174/1874447801610010124

      RESEARCH ARTICLE
Binary Logistic Model for Estimation of Mode Shift into Delhi Metro
Vineet Chauhan, Hemant K. Suman* and Nomesh B. Bolia
Department of Mechanical Engineering, Indian Institute of Technology, Delhi, India

Received: July 24, 2016                                  Revised: August 17, 2016                             Accepted: September 9, 2016

Abstract: This paper aims to study the public transport mode choice behaviour of commuters in Delhi so that appropriate strategies
to incentivize the use of public transport can be developed. We examine the efficacy of a multivariate statistical modelling approach
to predict the probability of non-metro commuters to shift to the Delhi metro. We also analyse the reasons for this shift from private
motor vehicles (PMVs) and buses. Data is collected through a survey of the metro commuters over various metro lines. A binomial
logistic regression model is formulated to predict whether existing metro users have shifted from buses or are new additions to public
transport shifting from PMVs. The model is validated well through several methods. The model analysis reveals that 57% of the
metro users have shifted from buses and 28.8% from PMVs. The shift is more amongst females than males.

Keywords: Delhi metro, Logistic regression, ROC curve, Revealed preference survey.

1. INTRODUCTION
    The National Capital Territory (NCT) of Delhi is the largest city in India with a population of about 17 million at
present [1] and is expected to be 24 million by 2021. The primary reason for this enormous growth is that Delhi is the
National Capital and provides for attractive commercial avenues as well as better health and education facilities [2, 3].
With increase in population, the number of private motor vehicles (PMVs) plying on Delhi roads have also increased
from 5.36 lakh in 1981 to 88.27 lakhs in 2014 [4]. All this growth and expansion comes with big issues around
mobility. On an average 48,621 cars and 99,340 two-wheelers (2Ws) were added annually to the Delhi roads from
1991-2000, and the respective numbers have increased to 114,386 and 187,065 in the last decade (2001-2010).
According to the latest available data, the number of additional cars and 2Ws per year are 153,916 and 310,617
respectively [4]. Further, the number of cars have been growing at higher rates than of 2Ws [5, 6]. A recent WHO report
revealed that the pollution level in Delhi is three times higher than the level prescribed by WHO and is continuously
increasing [7]. Thus, there is a strong need to shift people from PMVs to public transport. This is only possible by
making public transport as attractive as PMVs.
    Therefore, there has been a growing interest among policymakers about the relevance of rail-based systems in India
to address the mobility needs of the ever expanding population in the cities. While evaluating different mass transit
options for Indian cities, metro systems are often given priority due to the belief that road-based bus systems cannot
cater to capacity requirements as much as metro systems [8]. Sreedharan [9] also predicted that by the end of 2007, the
metro will be able to take the load of 40,000 PMVs. Also, the Delhi metro is in line with rapid transport systems
globally, and as a result, is a welcome step in the popular perception.
    However, there is a need to determine whether the shift to metro happened from PMVs or existing public transport
such as buses. Various passenger mode choice models have been developed [10 - 12] in the literature, but no work, to
the best of our knowledge has attempted to study this cannibalization effect in Delhi, i.e. the shift of commuters from
one mode of public transport (buses) to the other (metro). Thus, an objective of the research is to develop a mode choice

* Address correspondence to this author at the Department of Mechanical Engineering, IIT Delhi, Hauz Khas, New Delhi, India – 110016; Tel:
+91-844-763-2535; E-mail: hemantsmn@gmail.com

                                                     1874-4478/16      2016 Bentham Open
Binary Logistic Model The Open Transportation Journal, 2016, Volume 10 125
model to estimate the mode used by the metro commuters before the commencement of metro services. We also analyse
the factors that encourage commuters to opt for the metro as their preferred mode of commute. The paper also develops
a binary logistic model to predict the probability of non-metro commuters of a given profile shifting to the metro.
2. SURVEY DETAILS
2.1. Study Area
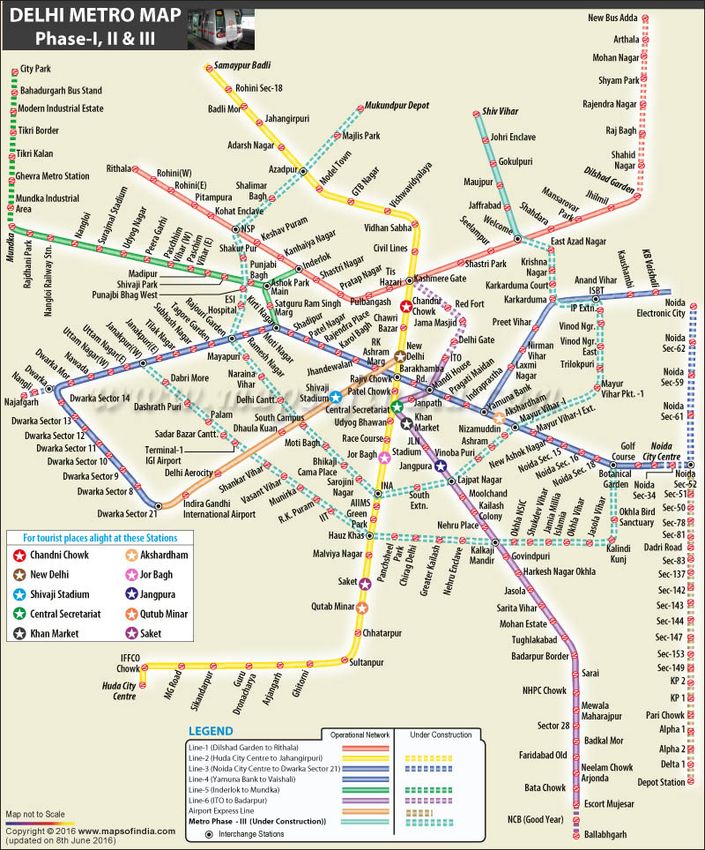
The area targeted for the survey covers six stations of the Delhi Metro namely Hauz Khas (HK), Chandni Chowk
(CC), Rajeev Chowk (RC), Kashmere Gate (KG), New Delhi (ND), and Central Secretariat (CS) (Fig. 1). The HK
station is selected for a pilot survey to gain specific insights and make subsequent main survey more meaningful. For
the main survey, the top five revenue generating stations are chosen (Fig. 2). The choice of these five stations
constitutes a representative set for the following reasons. In addition to high revenue generation, CC and ND connect
Delhi’s main stations of the Indian railways network. KG connects the main station of the interstate road transport
network. Moreover, RC and CS are major interchange stations of the Delhi metro.
Fig. (1). Map of study area.
2.2. Experience of Pilot Survey
A pilot survey is conducted at the HK metro station before the main survey to gain experience and refine the
questionnaire based on this experience. The pilot survey enhanced the main survey in the following ways:
2.2.1. Problem of Non-responses
The problem of non-response is faced in the pilot survey owing to the long initial questionnaire. The final
questionnaire is designed to keep the response collection time less than two minutes. It enables easy interpretation of
questions by the metro users at the metro stations and the interest of respondents remains alive.
2.2.2. Poor Initial Survey Design
The initial survey was earlier designed for more information than required for the objectives of the paper. After the
pilot survey, learning from its experience, the instrument is redesigned to get only the relevant information.126 The Open Transportation Journal, 2016, Volume 10 Chauhan et al.
2.2.3. Clear Questions
The initial survey design was found to lack clarity on the questions as perceived by the respondents. This was
addressed in the final survey.
30
Average monthly revenue (in million)
20
10
0
2007 2008 2009 2010 2011 2012 2013
Year
RAJEEV CHOWK NEW DELHI CHANDANI CHOWK
CTST-N YAMUNA BANK PRAGATI MAIDAN
Fig. (2). Maximum and minimum revenue stations.
Table 1. Percentage of metro users in each group.
Metro stations
Profile KG CC ND CS RC Overall %
< 25 years 44 48 59 60 51 52.4
25-40 years 48 37 25 34 35 35.8
Age group
41-55 years 5 11 14 5 11 9.2
> 55 years 3 4 2 1 3 2.6
< Rs 10,000 (US$ 150) 21 9 2 5 4 8.2
Rs 10000-30000 (US$ 150-450) 40 40 35 33 33 36.2
Income
Rs 30000-50000 (US$ 450-750) 20 27 28 32 28 27
> Rs 50000 (US$ 750) 19 24 35 30 35 28.6
Govt. Service 12 15 16 14 13 14
Pvt. Service 46 44 35 34 39 39.6
Business 14 14 13 12 14 13.4
Occupation
Student 24 27 36 40 33 32
Unemployed 2 - - - 1 0.6
Others 2 - - - - 0.4
Car 33 32 35 38 37 35
Motorcycle 42 35 25 32 36 34
Vehicles ownership
Bicycle 3 4 1 4 3 3
Others/None 22 29 39 26 24 28
PMV 28 28 32 28 28 28.8
Bus 51 68 59 48 59 57
Mode before Metro
Auto/Taxi 8 2 3 11 8 6.4
Others/None 13 2 6 13 5 7.8
2.3. Final Survey Report
The survey is planned to get responses for the profile of the metro users and their reasons of shifting to the metro
either from buses or PMVs. The profile information, presented in Table 1, includes age, income, gender, occupation and
vehicle ownership of metro commuters, and their modes of commute prior to using the metro. The questions that
correspond to the reasons of shifting to the metro are shown in Tables 2 and 3.Binary Logistic Model The Open Transportation Journal, 2016, Volume 10 127
Table 2. Reasons of shifting to metro from PMVs.
Metro stations
KG CC ND CS RC Overall
Type of Responses
It is cheaper to travel in Metro than in own vehicle (%)
Yes 41 22 25 35 30 30.6
No 4 5 - 3 3 3
Maybe 3 5 7 3 3 4.2
It takes lesser time to travel in Metro (%)
Yes 47 29 29 36 33 34.8
No 1 - - 3 1 1
Maybe - 3 3 2 2 2
There is lots of traffic and congestion on roads (%)
Yes 47 29 30 39 34 35.8
No 1 3 2 2 2 2
Maybe - - - - - -
It is safer to travel in Metro than in own vehicle (%)
Yes 42 17 21 33 26 27.8
No 2 7 5 6 4 4.8
Maybe 4 8 6 2 6 5.2
To reduce pollution due to own vehicle emission (%)
Yes 33 13 17 28 22 16.6
No 7 11 8 7 6 7.8
Maybe 8 8 7 6 8 7.4
No stress of driving (%)
Yes 44 20 22 27 27 28
No 4 9 8 11 8 8
Maybe - 3 2 3 1 1.8
Table 3. Reasons of shifting to metro from buses.
Metro stations
KG CC ND CS RC Overall
Type of Responses
It takes more time to travel in a bus (%)
Yes 46 64 42 53 56 52.2
No 1 2 14 2 2 4.2
Maybe - 1 9 3 2 3
There is no direct bus service (%)
Yes 21 41 42 41 32 35.4
No 21 18 14 10 21 16.8
Maybe 5 8 9 7 17 9.2
Buses are not punctual (%)
Yes 19 23 21 32 21 23.2
No 21 33 34 20 29 27.4
Maybe 7 11 10 6 10 8.8
Buses are very crowded (%)
Yes 27 31 39 44 34 35
No 18 30 19 11 22 20
Maybe 2 6 7 3 4 4.4
Buses are not safe and secure (%)
Yes 31 29 33 32 41 33.2
No 12 22 20 16 12 16.4
Maybe 4 16 12 10 7 9.8
Bus stop is more than 400m (%)
Yes 9 10 33 23 12 17.4
No 30 52 20 31 42 35
Maybe 8 5 12 4 6 7128 The Open Transportation Journal, 2016, Volume 10 Chauhan et al.
2.3.1. The Profile of the Metro Users
The survey is conducted among a total 500 respondents. It is revealed that more than 88% of metro users are below
40 years of age (mostly young people). Only 8.2% have a monthly income less than Rs 10000 (US$ 150) while more
than 55% commuters have a monthly income more than Rs 30000 (US$ 450). Most of the metro users are either
employed or students. The analysis also reveals that 28.8% of the metro commuters used their own vehicle prior to
using to metro, whereas about 57% used buses. Moreover, about 72% of the metro commuters have their own vehicles.
The detailed results related to the profile of metro users are presented in Table 1.
2.3.2. Reasons for Shifting to Metro
The commuters are divided into two categories based on their responses in the first part: i) those shifted from PMVs
and ii) those shifted from buses. The top six reasons for this shift are identified for each category from the pilot survey
done at HK metro station. For a given category, and each reason corresponding to the category, commuters are asked if
the reason is applicable to them for shifting to the metro. Commuters can respond with a “Yes”, “No” or “Maybe” and
Tables 2 and 3 present the percentage for each of the responses. The top three probable reasons for the shift are:
For people shifted from PMVs:
There is a lot of traffic and congestion on the roads.
It takes lesser time to travel in Metro.
It is cheaper to travel in Metro than in own vehicle.
For people shifted from Buses:
It takes more time to travel in a bus.
There is no direct bus service.
The buses are very crowded.
3. MODE CHOICE MODEL AND ANALYSIS
Pavlyuk and Gromule [13] perform an econometric analysis of the behaviour of bus and train passengers and their
choices between different transportation modes using the Nested discrete choice model. To model the mode behaviour
of car and bus use, a study [14] is conducted in Tripoli, Libya (which has high car ownership) using a binary logistic
model. The results show that some measures have to be taken to encourage car users to use other forms of public
transport. Transit Oriented Developments (TODs) are often designed to promote the use of sustainable modes of
transport and reduce car usage. The effects of personal and transit characteristics on travel choices of TOD users can be
investigated using binary logistic regression models. One such model is developed to determine the probability of
choosing sustainable modes of transport including walking, cycling and public transport at Brisbane, Australia [15].
The Binary Logistic models reveal that personal and transit characteristics have an impact on the decision of mode
selection [16, 17]. One of the most critical issues in travel behavioural modelling is to select the most appropriate mode
of daily commute [17]. The quantification of this interaction in terms of mathematical relationships is known as modal
split and the travel demand models are referred to as modal split or mode choice models. Stated preference survey is
conducted to forecast travel behaviour in a hypothetical travel environment whereas the revealed preference survey is
used to study the current travel behaviour [16]. To reflect the travel characteristics of the targeted population, precise
data is collected from this survey and used as an input to the logistic regression model developed to predict mode shifts.
In this paper, a binomial logistic regression model is formulated to predict whether existing metro users have shifted
from buses or are new additions to the public transport system, having shifted from PMVs. The mode shifted from is
used as the categorical dependent variable and is correlated with categorical and continuous independent variables
responsible for the shift. More details of the model are presented in section 3.1.
3.1. Logistic Regression Model
In this section, a binary logistic regression analysis is applied to predict the, mode a given metro commuter has
shifted from. The predicted values are PMVs (0) and buses (1). A total of five explanatory variables are considered out
of which two are categorical and three are quantitative in nature. The details of the explanatory variables are as follows:Binary Logistic Model The Open Transportation Journal, 2016, Volume 10 129
Categorical Variables
Gender (Male/Female) X1
(Coded as 1 for Female and 0 for Male)
PMV Owned (Yes/No) X2
(Coded as 1 for Yes and 0 for No)
Quantitative Variables
Ingress distance to the Metro (Km) X3
Age (Years) X4
Income (in thousands per month) X5
Let p is the probability that the mode used prior to metro was a bus and Bi (i=0, 1, 2, 3, 4, 5) are coefficients of the
Binary Logistic Regression model to be estimated from the data. Then according to standard theory of logistic
regression [18], the value of Logit is given by:
L= ln (odds) = ln (p/1-p) = B0 + B1X1 + B2X2 + B3X3 + B4X4 + B5X5 (1)
L= B0 + B1*Gender + B2*Vehicle ownership + B3*Ingress Distance + B4*Age + B5*Income (2)
The model analysis is done using SPSS software and the output is given in Table 4.
Table 4. Variables in the logit equation.
B S.E. Wald Df Sig. Exp(B)
Vehicle (0) 1.405 .273 26.566 1 .000 4.075
Access .008 .035 .058 1 .810 1.008
Age -.008 .010 .640 1 .424 .992
Income -.023 .007 9.671 1 .002 .977
Gender (1) .617 .320 3.721 1 .054 1.854
Constant 1.150 .397 8.378 1 .004 3.159
The equation of the logistic regression line is given by:
L = ln (odds) = ln (p/1-p) = 1.150 + .617X1 + 1.405X2 + .008X3 - .008X4 - .023X5 (3)
The two variables having the highest effect on the logit (log of odds of using a bus prior to the metro) are vehicle
owned and gender. From Table 4, two observations stand out: Commuters not owning a vehicle are almost 4 times more
likely to shift to the metro from buses compared to people owing a vehicle (Exp(B) for vehicle (0) = 4). Similarly,
females are almost twice more likely to have shifted from buses to metro than the male counterparts (Exp(B) for gender
(1) = 1.8).
3.2. Logistic Regression Model for Different Stations
The binary logistic regression analysis discussed in section 3.1 is then is carried out for all the five stations
separately. The resultant equations are given as (4), (5), (6), (7) and (8) respectively for KG, CC, ND, RC and CS
respectively. The significant coefficients corresponding to each station are highlighted in bold in the following
equations:
L = ln (p/1-p) = - 0.477 - 0.211X1 + 1.043X2 + 0.175X3 - 0.012X4 - 0.002X5 (4)
L = ln (p/1-p) = 3.069 + 1.842X1 + 1.770X2 + 0.004X3 - 0.026X4 - 0.056X5 (5)130 The Open Transportation Journal, 2016, Volume 10 Chauhan et al.
L = ln (p/1-p) = 1.408 + 2.997X1 + 1.778X2 - 0.030X3 - 0.026X4 - 0.019X5 (6)
L = ln (p/1-p) = 0.820 + 1.782X1 + 1.948X2 + 0.024X3 - 0.013X4 - 0.027X5 (7)
L = ln (p/1-p) = 2.027 + 0.432X1 + 0.600X2 + 0.024X3 - 0.016X4 - 0.043X5 (8)
The main findings of this analysis are; i) Females are generally more likely to have shifted from buses to metro than
the male counterparts. The same is strongly evident from the analysis of CC, ND, RC and CS data (Exp(B) for female
varies from 1.54 for CS to 20 for ND). ii) Commuters not owning a PMV are much more likely to shift into metro from
buses than commuters owning a PMV (Exp(B) varies from 1.822 for CS to almost 7 for RC metro station data).
4. VALIDATION AND MODAL SPLIT
In this section, the results of the logistic regression model are validated using three methods to conclusively
demonstrate a good fit and validity of the model. Further, a vehicle ownership split model is developed to get better
insights on how the PMV type influencing mode shift to the metro.
4.1. Model Validation
The model is validated using three methods, namely; classification table, receiver operating characteristic (ROC),
and cross-validation and their details are presented in section 4.1.1-4.1.3.
4.1.1. Classification Table
Table 5 shows that this model allows to correctly classify 96 / 183 = 52.5% of the commuters earlier using PMVs.
We also see that the model correctly classifies 269 / 317 = 84.9% of the commuters earlier using buses. Overall 365
predictions are correct out of 500 times, for an overall success rate of 73% which is well within the acceptable range
[19].
Table 5. Classification table.
Predicted
Observed Mode
Percentage Correct
0 1
0 96 87 52.5
Mode
1 48 269 84.9
Overall % 73
4.1.2. ROC Curve
A measure of goodness-of-fit often used to evaluate the fit of a logistic regression model is based on the
simultaneous measure of the sensitivity (True positive) and specificity (True negative) for all possible cut-off points.
First, we calculate sensitivity and specificity pairs for each possible cut-off point and plot sensitivity on the y axis Vs
(1-specificity) on the x axis. This curve is called the receiver operating characteristic (ROC) curve. The area under the
ROC curve ranges from 0.5 and 1.0 with larger values indicative of better fit. The area under the curve for the model
developed in this paper is .723 (Fig. 3) indicating a very good fit of model [19]. Further, areas under ROC curves for
CC, ND, RC, CS, and KG are 0.813, 0.825, 0.785, 0.719, and 0.72 respectively.
4.1.3. Cross Validation of the Logit Model
Cross-validation is the process of assessing how the results of a statistical analysis will generalize to an independent
data set. Two fold cross-validation method is used in this research: it assigns data points to two sets d and d1 so that both
sets are of equal size (this is usually implemented by shuffling the data array and then splitting it in two). The method
then involves training (compute coefficients) on d and testing (the ability of the resulting model to predict) on d1,
followed by training on d1 and testing on d. In this study training and test sets are both large, and each data point is usedBinary Logistic Model The Open Transportation Journal, 2016, Volume 10 131
for both training and validation.
(a) Cross Validation for Total Data (500 entries)
Both d and d1 have 250 data entries each. These are obtained by randomly picking these data entries. Firstly, d is
considered as given dataset of known data on which training is run (training dataset). The model is developed on data
set d and tested against the testing data set. The logit equation is given by equation (9) and the results of model
validation using classification table are presented in Table 6.
ROC Curve
1
0.8
Sensitivity
0.6
0.4
0.2
0
0 0.2 0.4 0.6 0.8 1
1-Specificity
Fig. (3). Receiver operating characteristic (ROC) curve.
Table 6. Validation of d data entries using the logit model.
TRAINING SET(250) TESTING SET(250)
Predicted(Based on d) Predicted(Based on d1)
Observed Mode % Mode %
0 1 Correct 0 1 Correct
0 34 56 37.8 46 44 51.1 specificity
Mode
1 20 140 87.5 33 127 79.4 sensitivity
Overall % 69.6 69.2
L = ln (odds) = ln (p/1-p) = 1.766 + .657X1 + 1.087X2 - .037X3 - .011X4 - .032X5 (9)
As shown in Table 6 the testing results have an accuracy of 69.2% in data set d1 which is fairly acceptable. Next,
both the data sets are interchanged. Based on the variables, the logit Equation (10) is derived. The model is validated
using a similar classification table. The accuracy of prediction is found to be 68.9% and 68.4% for the training and
testing data set respectively, again well within the acceptable region [19].
L = ln (odds) = ln (p/1-p) = .700 + .571X1 + 1.668X2 + .062X3 - .007X4 - .016X5 (10)
(b) Cross Validation for individual stations (100 entries each)
Cross validation of the model using the entire data set provided convincing evidence of the validity of the model.
However to still probe further and strengthen the evidence of the predicting ability of logistic regression, cross-
validation for data from each station has also been performed. Two data sets of 50 data entries each from every station132 The Open Transportation Journal, 2016, Volume 10 Chauhan et al.
are used. Then cross validation is performed as detailed earlier. The results again demonstrate the validity of the model
even for individual stations and are presented in Table 7.
Table 7. Cross validation output for all five data sets.
TRAINING SET (50) TESTING SET (50)
Predicted
DATA SET Observed
Mode Mode
% correct % Correct
0 1 0 1
0 16 9 64.0 10 6 62.5
Mode
KG 1 13 12 48.0 14 20 58.8
Overall percentage 56.0 60
0 4 8 33.3 13 5 72.2
Mode
CC 1 1 37 97.4 6 26 81.3
Overall percentage 82.0 78
0 16 3 84.2 35 4 89.4
Mode
ND 1 11 20 64.5 4 7 63.7
Overall percentage 72.0 84
0 12 7 63.2 29 8 78.4
Mode
RC 1 8 23 74.2 5 8 61.5
Overall percentage 70.0 74
0 4 16 20.0 14 7 66.7
Mode
CS 1 8 22 73.3 8 21 72.4
Overall percentage 52.0 70
4.2. Vehicle Ownership Split Model
To gain further insights into the mode shift, the effect of 2Ws and cars individually on the shift to metro is also
studied. For this study, two additional categorical explanatory variables are defined to explain vehicle ownership (i.e.,
car and 2-Ws). The details of explanatory variables now are as follows:
Quantitative Variables
Ingress distance to Metro (Km) X1
Age (Years) X2
Income (in thousands per month) X3
Categorical Variables
Gender (Male/Female) X4
(Coded as 1 for Female and 0 for Male)
Car Ownership (Yes/No) X5
(Coded as 1 for Yes and 0 for No)
Two-Wheeler (2W) Ownership (Yes/No) X6
(Coded as 1 for Yes and 0 for No)
Standard Logistic Regression is performed using SPSS and the results are summarized in Table 8.
Table 8. Results (with mode split).
B S.E. Wald Df Sig. Exp(B)
Access 0.024 0.038 0.386 1 0.534 1.024
Age -0.011 0.011 0.976 1 0.323 0.989
Income -0.006 0.008 0.58 1 0.446 0.994
gender(1) 0.635 0.334 3.621 1 0.057 1.888
car(1) -2.012 0.291 47.644 1 0 0.134Binary Logistic Model The Open Transportation Journal, 2016, Volume 10 133
(Table ) contd.....
B S.E. Wald Df Sig. Exp(B)
2Ws(1) -0.561 0.279 4.049 1 0.044 0.571
Constant 1.903 0.414 21.116 1 0 6.707
L =ln (p/1-p) = 1.903 + .024X1 - 0.011X2 - 0.006X3 +0.635X4 - 2 .012X5 - 0.561 X6 (11)
As shown in Table 8, three variables viz., gender, car ownership and 2W ownership are significant. The females are
almost twice (1.888) more likely to have shifted from buses to metro than the male counterparts (Exp(B) for gender (1)
= 1.888). Commuters not owning a car are 7.4 times (1/.134) more likely to shift to the metro from buses than
commuters owning a car (Exp(B) for car (1) = 0.134). Similarly, commuters not owning a motorcycle are 1.75 times
more likely to shift to the metro than commuters owning a motorcycle (Exp(B) for 2Ws (1) = .571).
Further, the analysis is also carried out for each station separately and the findings of the model above are
reinforced. The detailed results are presented in Table 9 and the highlights are as follows:
Table 9. Variables in the equations station wise (split).
KG CC ND RC CS
01-100 101-200 201-300 301-400 401-500
B Exp(B) B Exp(B) B Exp(B) B Exp(B) B Exp(B)
Access .179 1.196 .069 1.071 -.961 .383 -.490 .613 .052 1.053
Age .010 1.010 -.037 .964 -2.667 .069 -2.506 .082 -.008 .992
Income .020 1.021 -.039 .962 19.098 1.96 x 10^8 1.760 5.813 -.033 .968
Gender -.160 .852 1.865 6.453 -.005 .995 -.003 .997 .511 1.666
Car -1.713 .180 -1.724 .178 -.031 .969 .000 1.000 -1.155 .315
2Ws -.150 .861 -.204 .815 -.036 .964 .053 1.054 -.282 .754
Constant -.208 .812 3.665 39.066 2.945 19.005 1.829 6.229 2.070 7.929
The females are generally more likely to have shifted from buses to metro than the male counterparts. The same
is strongly evident from the analysis of CC and CS data (value of Exp(B) for gender are 6.45 and 1.67).
Commuters not owning a car are more likely to shift to the metro from buses than commuters owning a car.
Commuters not owning a 2W are more likely to shift to the metro from buses than commuters owning a 2W.
Further, motorcycle owners are more likely to shift into metro from buses than the car owners (value of Exp(B)
for car and 2Ws).
5. DISCUSSIONS
Several studies [7, 20 - 24] establish an urgent need to improve the quality of public transport, particularly in terms
of comfort, directness, punctuality, travel time, and integration of different modes to reduce the increasing reliance of
commuters on PMVs. Studies also reveal that commuters can actually shift to public transport if their concerns are
addressed. Tiwari and Jain [25] conclude that commuters can easily travel by bicycles up to a distance of 10 km. Suman
et al. [26] reveal that 25% of non-bus users are willing to use bicycles for daily commute if separate lane is reserved for
them. Further, 52% bus users can potentially shift to bicycles and consequently free up space inside buses thus increase
comfort and enhancing bus attractiveness to non-bus users. Furthermore, Suman et al. [26] also reveal that if a common
ticketing system for buses and Delhi metro is available, 36% non-bus users are willing to shift to buses. Additionally,
64% experts believe that implementing common ticketing system is feasible in Delhi. More studies [20, 22, 24] share
similar findings and conclude such integrated ticketing systems can improve public transport, a prime need of the
current era.
Delhi metro is an attempt to provide quality public transport that is comfortable, quick and safer. Commuters using
both PMVs and buses (the existing major mode of public transport) have shifted to the metro for their commuting
needs. This paper, as discussed in section 1, analyses the relative mode shifts. The findings suggest that a bulk of the
metro users, 57% to be precise, have shifted from buses and only 28.8% from PMVs. Further, commuters not owning
car(s) are 7.4 times more likely to shift to the metro than those owning one (or more). Thus, while many bus commuters
find the quality of the metro better (hence the shift), commuters using PMVs are less enthusiastic using shifting to134 The Open Transportation Journal, 2016, Volume 10 Chauhan et al.
metro. This clearly points to two phenomenon and corresponding policy measures:
The quality of public transport matters. Commuters shift from one mode of public transport to another in search
of better quality (bus to metro). A shift from PMVs to a good quality public transport mode (PMV to metro) is
also possible. So, all modes of public transport should strive to improve their quality and commuters will
respond commensurately. Specifically, busses in Delhi need to improve their service quality attributes
significantly to retain their ridership. They are the most cost effective mode of urban transport [27] and are
crucial to the success of the public transport strategy of Delhi.
Improving the quality of public transport alone is not sufficient to affect the desirable mode shift from PMV to
public transport (metro in this case). In this study, this is reflected in the low share of PMV to metro and the low
likelihoods of commuters owning PMVs shifting to the metro. Therefore, strategies to incentivize the use of
public transport, in addition to improved quality of public transport, should include measures to dis-incentivize
PMVs. An example of such a measure is congestion charging. Although initially likely to be contested by
citizens, these measures can become popular once the benefits are apparent.
Similarly, those who do not own 2W(s) are 1.75 times more likely to shift to metro than those owning one (or
more). For example, in 2005, 55% residents of Stockholm were not satisfied with implementation of congestion
charging but later accepted it and appreciated the positive effect in reducing travel time and PMVs use [28, 29].
CONCLUSION
Mode shift from buses to metro occurs because buses take more time, and are more crowded compared to the metro.
Further, commuters prefer direct mode of transport that is possible for many of them who shifted to the metro. In
addition to this shift, some commuters also shift from PMVs to the metro because it is cheaper and less time consuming
as compared to PMVs. The analysis also reveals, as expected, the females perceive the metro to be safer and are more
likely to shift as compared to males. The possible drivers for this are CCTV camera availability, security personnel on
stations, more space inside as compared to buses even when crowded, and separate coaches for females.
It is important to note, however, that despite, introduction of a good metro system in Delhi, the mode share of public
transport is continuously decreasing. Also, majority of the metro commuters have shifted from buses and new addition
to the public transport domain is not considerable. Therefore, as presented in the discussion section, improvement in
various service attributes is necessary along with dis-incentivising PMVs to enhance the overall mode share of public
transport. Possible measures to achieve this include: 1) improved comfort, punctuality, and travel time through addition
of more buses, along with optimal route allocation of existing ones and implementation of common ticketing system for
buses and the Delhi metro, 2) separate lanes for bicycles, and 3) betterment of dis-incentivization of PMV’s through
measures such as congestion charging.
Future Scope
This study alone is not sufficient to formulate detailed guidelines for transportation in Delhi. The limitation of this
study include response only from metro users and lack of a detailed analysis of the perception of commuting by metro.
To overcome these limitations and gain more insights, such a study can be carried out on buses as well. The study
should include a detailed perception analysis of existing and potential bus commuters. An analysis of the impact of
various interventions by the metro and buses to increase their ridership will further extend and enhance the findings of
this study.
CONFLICT OF INTEREST
The authors confirm that this article content has no conflict of interest.
ACKNOWLEDGEMENTS
This research has been partially supported by the Department of Science and Technology, Government of India with
grant number RS/FTP/ETA/0025/2011. We thank Rama Shankar and Premchand for providing logistical support to us
in data collection.Binary Logistic Model The Open Transportation Journal, 2016, Volume 10 135
REFERENCES
[1] Census-India, Census of India 2011 primary census abstract: NCT of Delhi, 2011.
[2] ESD, "Transport", In: Delhi: Economic Survey of Delhi (2012-2013)., Govt: NCT Delhi, 2012, pp. 163-177.
[3] ESD, "Transport", In: Delhi: Economic Survey of Delhi (2014-2015)., Govt: NCT Delhi, 2014, pp. 2011-2014.
[4] DES, Statistical Abstract of Delhi, Directorate of Economics and Statistics., Govt: NCT Delhi, 2014.
[5] M.G. Badami, and M. Haider, "An analysis of public bus transit performance in Indian cities", Transp. Res. Part A Policy Pract., vol. 41, no.
10, pp. 961-981, 2007.
[http://dx.doi.org/10.1016/j.tra.2007.06.002]
[6] M.G. Badami, "The urban transport challenge in India: Considerations, implications and strategies", Int. Dev. Plan. Rev., vol. 27, no. 2, pp.
169-194, 2005.
[http://dx.doi.org/10.3828/idpr.27.2.2]
[7] B. Sudhakara Reddy, and P. Balachandra, "Urban mobility: A comparative analysis of megacities of India", Transp. Policy, vol. 21, pp.
152-164, 2012.
[http://dx.doi.org/10.1016/j.tranpol.2012.02.002]
[8] R. Goel, and G. Tiwari, "Promoting low carbon transport in India: Case study of metro rails in indian cities", IIT Delhi, vol. 1, p. 88, 2014.
[9] E. Sreedharan, "Delhi metro - The changing face of urban public transport in India", Indian J. Transp. Manag., vol. 32, no. 1, pp. 57-61, 2008.
[10] C.P. Chen, and G.A. Naylor, "Development of a mode choice model for bus rapid transit in santa clara county california", J. Public Transp.,
vol. 14, no. 3, pp. 41-62, 2011.
[http://dx.doi.org/10.5038/2375-0901.14.3.3]
[11] M. Gebeyehu, and S. Takano, "Diagnostic evaluation of public transportation mode choice in addis ababa", J. Public Transp, vol. 10, no. 4,
pp. 27-50, 2007.
[http://dx.doi.org/10.5038/2375-0901.10.4.2]
[12] E. Molin, "Context-dependent stated choice experiments", J. choice Model, vol. 3, no. 3, pp. 39-56, 2010.
[13] D. Pavlyuk, and V. Gromule, "A discrete choice model for a preferred transportation mode ", Reliab. Stat. Transp. Commun., vol. 2, p. 22,
2010.
[14] M.A. Abuhamoud, R.A. Rahmat, and A. Ismail, "Modeling of transport mode in Libya: A binary Logit model for government transportation
encouragement", Aust. J. Basic Appl. Sci., vol. 5, no. 5, pp. 1291-1296, 2011.
[15] D. Muley, J. Bunker, and L. Ferreira, "Investigation into travel modes of TOD users : Impacts of personal and transit characteristics",
Queensl. Univ. Technol. Brisbane Aust., vol. 7, no. 1, pp. 3-13, 2009.
[16] O.A. Khan, "Modelling passenger mode choice behaviour using computer aided stated preference data", School of Urban Development,
Queensland University of Technology. PhD Thesis, 2007, pp. 1-324.
[17] O.A. Khan, L. Ferreira, and J.M. Bunker, "Modelling multimodal passenger choices with stated preference", In: Proceedings 26th Conference
of the Australian Institutes of Transport Research, Melbourne, Australia, 2004, pp. 1-9.
[18] C. J. Peng, K. L. Lee, and G. M. Ingersoll, "An introduction to logistic regression analysis and reporting", J. Educ. Res, vol. 96, no. 1, pp.
3-14, 2002.
[http://dx.doi.org/10.1080/00220670209598786]
[19] H.A. Park, "An introduction to logistic regression: from basic concepts to interpretation with particular attention to nursing domain", J.
Korean Acad. Nurs., vol. 43, no. 2, pp. 154-164, 2013.
[http://dx.doi.org/10.4040/jkan.2013.43.2.154] [PMID: 23703593]
[20] S. Ahmad, O. Balaban, C.N. Doll, and M. Dreyfus, "Delhi revisited", Cities, vol. 31, pp. 641-653, 2013.
[http://dx.doi.org/10.1016/j.cities.2012.12.006]
[21] M. Gupta, "Willingness to pay for carbon tax: A study of Indian road passenger transport", Transp. Policy, vol. 45, pp. 46-54, 2016.
[http://dx.doi.org/10.1016/j.tranpol.2015.09.001]
[22] M. Thynell, D. Mohan, and G. Tiwari, "Sustainable transport and the modernisation of urban transport in Delhi and Stockholm", Cities, vol.
27, no. 6, pp. 421-429, 2010.
[http://dx.doi.org/10.1016/j.cities.2010.04.002]
[23] S. Jain, P. Aggarwal, P. Kumar, S. Singhal, and P. Sharma, "Identifying public preferences using multi-criteria decision making for assessing
the shift of urban commuters from private to public transport: A case study of Delhi", Transp. Res., Part F Traffic Psychol. Behav., vol. 24,
pp. 60-70, 2014.
[http://dx.doi.org/10.1016/j.trf.2014.03.007]
[24] S.N. Sahai, S. Bishop, and J. Singh, Bus System Reform in Delhi., UITP Asia Pacific Assem, 2009, pp. 1-11.
[25] G. Tiwari, A. Arora, and H. Jain, Bicycles in urban India., Bicycl. ASIA, 2008, p. 9.
[26] H. K. Suman, N. B. Bolia, and G. Tiwari, "Perception of potential bus users and impact of feasible interventions to improve quality of bus136 The Open Transportation Journal, 2016, Volume 10 Chauhan et al.
services", Under Rev. Transp. Policy , 2017. [in Review]
[27] H.K. Suman, N.B. Bolia, and G. Tiwari, "Comparing public bus transport user characteristics in delhi and mumbai: Policy implications for
improving bus services in delhi", Under 2nd Rev. Transp. Policy, 2017. [in Review]
[28] J. Eliasson, L. Hultkrantz, L. Nerhagen, and L.S. Rosqvist, "The Stockholm congestion - charging trial 2006: Overview of effects", Transp.
Res. Part A Policy Pract., vol. 43, no. 3, pp. 240-250, 2009.
[http://dx.doi.org/10.1016/j.tra.2008.09.007]
[29] J. Eliasson, "A cost-benefit analysis of the Stockholm congestion charging system", Transp. Res. Part A Policy Pract., vol. 43, no. 4, pp.
468-480, 2009.
[http://dx.doi.org/10.1016/j.tra.2008.11.014]
© Chauhan et al.; Licensee Bentham Open
This is an open access article licensed under the terms of the Creative Commons Attribution-Non-Commercial 4.0 International Public License
(CC BY-NC 4.0) (https://creativecommons.org/licenses/by-nc/4.0/legalcode), which permits unrestricted, non-commercial use, distribution and
reproduction in any medium, provided the work is properly cited.You can also read


