The thermal impact of tourism on a Svalbard glacier cave
←
→
Page content transcription
If your browser does not render page correctly, please read the page content below

CZECH POLAR REPORTS 11 (1): 154-160, 2021

The thermal impact of tourism on a Svalbard glacier cave
                    (Short Communication)

Andreas Alexander

Department of Geosciences, The Faculty of Mathematics and Natural Sciences,
University of Oslo, 0371 Oslo, Norway

Abstract
Glacier cave visits are an important tourism activity on Svalbard with increasing popu-
larity. This study investigates the thermal effect of touristic visits on the air temperature
of a glacier cave on Longyearbreen, a small high-Arctic glacier. Short-term temperature
perturbations of up to 1.59°C (42% local temperature increase) can be linked to human
visitors. It is, however, unlikely that the local heat input from touristic visits is high
enough to cause a lasting effect on the thermal regime of glacier caves and the surround-
ing ice.

Key words: glacier caves, tourism, cave temperature

DOI: 10.5817/CPR2021-1-11

Introduction

    Svalbard has experienced a tourist boom       ades. During summer they are filled with
in the past two decades (Hovelsrud et al.         water, but once the flow of water ceases in
2020) and it is likely that this trend will       winter, some of them can be entered and
continue once the pandemic is over. Par-          allow access to the glacier interior. Glacier
ticularly adventure based tourism is popu-        caves (a cave carved into glacier ice) are
lar and more and more adventure seeking           thereby not to be mistaken with ice caves,
tourists have been coming during winter-          which are caves carved in rock containing
time (e.g. Hovelsrud et al. 2020, Lindberg        ice (Field 2002).
and Jensen 2020). Among the popular ac-              Several glacier caves exist in the vicini-
tivities are thereby visits of glacier caves.     ty of Longyearbyen and are maintained by
These are caves that are melted into the          local tourist companies to keep them ac-
glacier ice by meltwater during summer            cessible throughout winter. Guided trips
and closed in wintertime due to the creep         are offered either as short stop-overs, des-
of the surrounding ice (Röthlisberger 1972).      ignated cave tours, overnight stays or cave
In places where the glacier ice is shallow,       ice climbing. Given the popularity of these
such cave systems can remain open for dec-        activities for both tourists and locals, in-
———
Received May 9, 2021, accepted June 9, 2021.
*
  Corresponding author: A. Alexander
Acknowledgements: This research has been supported by the Research Council of Norway (Arctic
Field Grant, grant no. 2019/296184) and the Svalbard Environmental Protection Fund (project
17/31). The data loggers used during this study were kindly provided by H.H. Christiansen. Erik
Schytt Holmlund and Jaros Obu helped during the fieldwork. Hurtigruten Svalbard AS provided
information about cave visits. I want to further thank M. Bartak for inviting me to contribute to
this issue of CPR.
                                                                                            154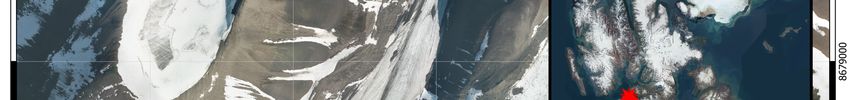
A. ALEXANDER

frequent accidents occur. Particularly one      arisen, if the heat induced by human visi-
incident stands out, when a group of visi-      tors is sufficient to create thermal varia-
tors was trapped inside a cave at Longyear-     tions large enough to induce ice strain as
breen and had to dig their way out af-          a result of frequent freezing and thaw-
ter part of a passage had collapsed behind      ing. This study therefore presents meas-
the group ([1]-Svalbardposten 2012). In the     urements of cave air temperatures from
light of this background, this paper sets out   Longyearbreen, alongside visitor statistics,
to investigate the effect that tourism has      and discusses the local heat perturbations
on glacier caves. In particular, the thermal    caused by cave visitors.
effect is investigated as the question has

Methods

Study site

    Longyearbreen is a small valley glacier     this cave is maintained by local tourism
at 78.18 °N and 15.5 °E, located 1.7 km         companies via the construction of an igloo
south of Longyearbyen, the main settle-         on the surface. As the cave entrance is lo-
ment of Svalbard (Fig. 1). The 3.7 km long      cated only 4.3 km south of Longyearbyen,
glacier extends from 250 to 800 m above         the cave is visited several times daily
sea level on a north-facing slope. Glacio-      throughout winter (summer visits are not
logical and hydrological characteristics of     possible due to meltwater filling the cave).
the glacier were reported by Etzelmüller et     Visits can thereby be both: Organized tour-
al. (2000).                                     istic ventures, as well as short-stopovers
    A deeply incised lateral supraglacial       by local inhabitants passing by along the
channel can be found on the glaciers west-      snowmobile track. In 2019 the accessible
ern side and has frequently been studied        part of the cave was rather short with 84 m
over the recent years (e.g. Hansen et al.       cave length, extending to a depth of 13 m
2020). Snow closes off the channel in win-      below the glacier surface.
tertime, forming a cave system. Access to

Visitor statistics

   Cave visitor statistics were provided by     other companies further offer guided tours
Hurtigruten Svalbard AS. The data were          to the same cave system, in addition to
thereby given in three-hour intervals, in-      many privately organized visits. No infor-
cluding cave visit, pick-up from and de-        mation on these visits is available and they
livery to town, as well as the drive up and     are therefore not included in the visitor
down the glacier. The actual retention time     statistics used for this study.
in the cave is therefore unknown. Several

Cave mapping

   The cave system was mapped using a           pass bearing and inclination along a line
laser distance meter modified for speleo-       transect survey and transfers the readings
logical purposes, also called DistoX (Heeb      to a PDA device with installed PocketTopo
2014). The device measures distance, com-       software (Heeb 2014).

155
THERMAL IMPACT OF GLACIER CAVE TOURISM

Fig. 1. Overview map showing the location of Longyearbreen on the Svalbard archipelago and the
cave entrance. Coordinate system: WGS84 UTM 33 North. Background image: Norwegian Polar
Institute.

   The device was calibrated before the         a starting point. The compass bearings
measurements, following the standard cali-      were corrected for the local magnetic dec-
bration procedures outlined in the DistoX       lination and the measurements were trans-
calibration manual (Heeb 2013). Handheld        formed into UTM coordinates and plotted
GPS coordinates (accuracy 3 m) served as        using the PocketTopo software.

Logger installations, meteorological data and processing

   Three TinyTag Plus 2 data loggers with       logical service [2].
internally mounted 10K NTC Thermistor              All temperature data were processed
sensor (0.01°C resolution and 0.35°C ac-        using MATLAB R2020b. For each logger
curacy at 0°C temperature) were mounted         (Entrance, Middle, End) the temperature
2 m above the cave floor and set to a           increase during known visits was calcu-
5 min. logging interval (named ‘Entrance’,      lated as the maximum temperature during
‘Middle’ and ‘End’ according to their lo-       the three-hour interval and the temperature
cation within the cave system, see Fig. 2).     at the start of the interval. The residual
The loggers were installed on 04. February      temperature was computed as the tempera-
2019 and removed on 12. March 2019.             ture difference between the temperature at
   Hourly air temperature data from the         the end and the start of each three-hour
Svalbard Airport weather station were           interval. Mean, min and max values were
downloaded from the Norwegian meteoro-          further calculated for all 43 known visits.

                                                                                         156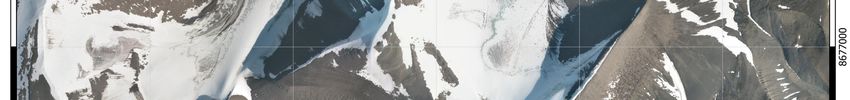
A. ALEXANDER
A B
Fig. 2. Cave map of the investigated cave system at Longyearbreen showing logger locations.
A) Profile. B) Plane view.
Results
During the study period, the average All three logger records show short-
surface air temperature at Svalbard Air- term temperature perturbations (up to 5 h)
port was -14.07°C, with a short warm pe- during and outside times of known cave
riod in late-February (Fig. 3A). The aver- visits. In total 517 known visits occurred
age cave air temperature at the Entrance during the study period (Fig. 3D). The
logger was -7.68°C throughout the entire highest temperature increase can thereby
period. The overall temperature trend is fol- be found at the End logger with 1.59°C
lowing the one from the surface air tem- (42% increase). Most increases are, how-
perature (Fig. 3B). The average air tem- ever, short-lived and the residuals (Table 1
peratures at the Middle and the End logger and Fig. 4) are thus low. In some occa-
are -3.68°C and -3.62°C respectively. Both sions a cooling of the cave system has
loggers record no long-term temperature been observed during known visits.
fluctuations (Fig. 3C).
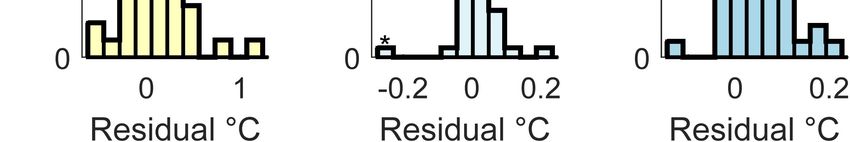
Increase Residual
Mean Max Min Mean Max Min
Entrance 0.46 1.42 0 0.06 1.07 -0.63
Middle 0.18 0.45 0 0.01 0.19 -0.37
End 0.39 1.59 0.01 0.04 0.19 -0.15
Table 1. Average, maximum and minimum temperature increase and residual at measurement
locations connected to cave visits. All measurements are given in °C.
157
THERMAL IMPACT OF GLACIER CAVE TOURISM
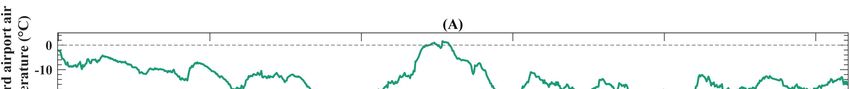
Fig. 3. Recorded data between 04. Feb. 2019 and 12. Mar. 2019. A) Hourly air temperature at
Svalbard airport. B) 5 min. interval cave air temperature at the Entrance logger. C) 5 min. interval
cave air temperatures at the Middle and End loggers. D) Number of known visitors during the
observation period.
Fig. 4. Histograms showing the distribution of temperature increase and residual for each logger.
158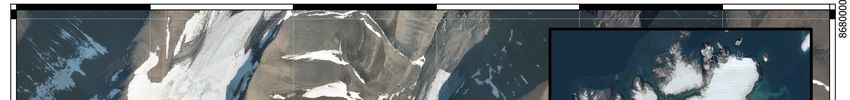
A. ALEXANDER

Discussion

    In comparison to the temperature re-         temperature perturbations recorded by the
cords from glacier cave systems not used         End logger.
for touristic purposes (Alexander et al.            A direct link between the amount of
2020), clear and frequent temperature per-       visitors and the magnitude of the caused
turbations are present. These can be linked      temperature perturbation can, however, not
to the heat input from cave visitors in all      be established (Pearson correlation coeffi-
cases where information about visits is          cients of 0.21, 0.46 and 0.29 for Entrance,
available. As the available data represent       Middle and End respectively). The temper-
only a fraction of the actual cave visits, it    ature perturbations are further short-lived
can be assumed that all temperature spikes,      and mostly diminish within one hour.
recorded inside the cave, are connected to          The data show that touristic visits are
human visitors.                                  unlikely to have a thermal effect large
    Particularly the entrance of the cave is     enough to affect ice temperatures and thus
exposed to high temperature variations. As       stability. However, this study is limited to
it is closer to the surface, its thermal re-     only one month during the coldest period
gime is still partly controlled by heat ex-      of the year and a single cave system close
change with the atmosphere. Visitors tend        to the glacier surface. Conclusive state-
to gather at the entrance before venturing       ments would therefore require further in-
deeper into the cave, thus increasing the        vestigations from deeper and thus warmer
local heat input close to the Entrance log-      caves, as well as over extended periods of
ger.                                             time, where effects from cold-air draining
    This part of the cave is further directly    into the cave are not prevailing. Further,
connected to the atmosphere during cave          the exact resident times and movement pat-
visits, as a wooden plate, covering the en-      terns of cave visitors would be required
trance, is removed to enter the cave. As a       and airflow patterns within the cave to be
result, cold air drains into the cave system     established (e.g. via the calcFLOW model
during visits while warm air can vent out,       by Meyer et al. 2016). This could then be
thereby outweighing the heat input from          used to run numerical models to fully un-
the visitors.                                    derstand the thermal impact of visitors on
    The end of the cave system is the deep-      glacier caves. Another aspect requiring fur-
est part and thus experiences the best insu-     ther investigation would be the question if
lation from the surface air temperature.         tourism can introduce foreign organisms
This makes the thermal regime of this cave       into glacier caves that could subsequently
part more sensitive to local heat input. Visi-   enter sub- and proglacial ecosystems via
tors further tend to gather at the cave end      meltwater transport in summer.
before turning around, explaining the high

Conclusion

   This study has investigated the thermal       phere, allowing cold air to drain into the
effect of touristic visits on glacier caves.     cave, outweighing local heat input during
It is shown that such visits cause local         cold periods. It is therefore unlikely that
temperature perturbations of up to 42% of        human visitors can introduce enough heat
the cave air temperature. These effects are,     to have an effect on ice stability. The data
however, short-lived and mostly diminish         of this study are, however, limited and the
within one hour. Touristic visits further es-    results therefore not conclusive, requiring
tablish a direct connection to the atmos-        further investigations.

159
THERMAL IMPACT OF GLACIER CAVE TOURISM

References

ALEXANDER, A., OBU, J., SCHULER, T. V., KÄÄB, A. and CHRISTIANSEN, H. H. (2020): Subglacial
   permafrost dynamics and erosion inside subglacial channels driven by surface events in
   Svalbard. The Cryosphere, 14: 4217-4231. doi: 10.5194/tc-14-4217-2020.
ETZELMÜLLER, B., ØDEGÅRD, R. S., VATNE, G., MYSTERUD, R. S., TONNING, T. and SOLLID, J. L.
   (2000): Glacier characteristics and sediment transfer system of Longyearbreen and Larsbreen,
   western Spitsbergen. Norsk Geografisk Tidsskrift - Norwegian Journal of Geography, 54(4):
   157-168. doi: 10.1080/002919500448530.
FIELD, M. S. (2002): A lexicon of cave and karst terminology with special reference to environ-
   mental karst hydrology. U.S. Environmental Protection Agency. Office of Research and
   Development, National Center for Environmental Assessment, Washington Office, Washington,
   DC, EPA/600/R-99/006, 221 p.
HANSEN, L. U., PIOTROWSKI, J. A, BENN, D. I. and SEVESTRE, H. (2020): A cross-validated three-
   dimensional model of an englacial and subglacial drainage system in a High-Arctic glacier.
   Journal of Glaciology, 256: 278-290. doi: 10.1017/jog.2020.1.
HEEB, B. (2013): DistoX2 calibration manual. Available at: https://paperless.bheeb.ch/download/
   DistoX2_CalibrationManual.pdf (last access: 4 December 2019).
HEEB, B. (2014): The next generation of the DistoX cave surveying instrument. CREG Journal,
   88: 5-8.
HOVELSRUD, G. K., KALTENBORN, B. P. and OLSEN, J. (2020): Svalbard in transition: Adaptation
   to cross-scale changes in Longyearbyen. The Polar Journal, 10(2): 420-442. doi: 10.1080/
   2154896X.2020.1819016,.
LINDBERG, F., JENSEN, Ø. (2020): Adventure regime of tourism experiences. Current Issues in
   Tourism. doi: 10.1080/13683500.2020.1854196.
MEYER, C., MEYER, U., PFLITSCH, A. and MAGGI, V. (2016): Analyzing airflow in static ice caves
   by using the calcFLOW method. The Cryosphere, 10: 879-894. doi: 10.5194/tc-10-879-2016.
RÖTHLISBERGER, H. (1972): Water pressure in intra- and subglacial channels. Journal of
   Glaciology, 11(62): 177-203. doi: 10.3189/S0022143000022188.

Web sources / Other sources

[1] Svalbardposten (2012): Ras i isgrotta. https://svalbardposten.no/nyheter/ras-i-isgrotta/19.244.
     Last accessed: 09.05.2021

[2] Norwegian Centre for Climate Services (2021)
    https://seklima.met.no

                                                                                                 160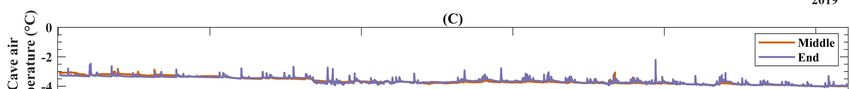
You can also read