Time-Resolution of Climate Change Monitoring Volcanic Cycles, Stromboli, Ocean Floor Biota and Pandemics (?)
←
→
Page content transcription
If your browser does not render page correctly, please read the page content below
American Journal of Engineering and Applied Sciences
Research Notes
Time-Resolution of Climate Change Monitoring Volcanic
Cycles, Stromboli, Ocean Floor Biota and Pandemics (?)
1,2*
Giovanni Pietro Gregori and 1,3Gabriele Paparo
1IDASC-Istituto di Acustica e Sensoristica O. M. Corbino (CNR),
Roma, Now Merged into IMM-Istituto per la Microelettronica e Microsistemi (CNR), Italy
2ISSO-International Seismic Safety Organization and GeoPlasma Research Institute - (GeoPlasmaResearchInstitute.org),
Aurora, CO 80014, USA
3INGV-Istituto Nazionale di Geofisica e Vulcanologia, Italy
Article history Abstract: Climate change is an ongoing, poorly understood and disquieting
Received: 25-05-2021 challenge. The primary drivers are debated. Clear evidence is however
Revised: 13-05-2021 suggestive of a time variation of the planetary release of endogenous energy.
Accepted: 15-06-2021 In fact, soil exhalation is an unprecedented challenge for humankind, as a
Corresponding Author: phenomenon of this kind happens only every 27.40.05 Ma, while human
Giovanni Pietro Gregori history spans only the last 30,0000 years. Therefore, there is need for a
IDASC-Istituto di Acustica e quantitative and objective monitoring of climate change with high time
Sensoristica O. M. Corbino resolution. It is here shown that Stromboli is a natural probe suited for such
(CNR), Roma, Now Merged a purpose. More in detail, a general perception of phenomena clearly
into IMM-Istituto per la envisages an ever increasing climate variability, including more frequent
Microelettronica e extremes and catastrophic events. But no quantitative monitoring is available
Microsistemi (CNR) Italy
Email: gregori.giovanni@fastwebnet.it
with some given time-resolution. In fact, no mean global temperature can be
defined, even though it is unlikely that one index alone can be representative
of a planetary phenomenon. Sea-level or glacier extension are affected by a
huge number of drivers can be locally interpreted in several different ways,
resulting into unreliable proxies. Planetary seasonal maps of atmospheric
CO2 concentration provided by the NASA satellite OCO-2 have shown that
- in contrast with the often claimed paradigm - compared to soil exhalation
the anthropic CO2 plays a negligible role. In addition, based on evidence
given by the Hawai’i volcanism, huge time-variations of release of
endogenous heat certainly occurred several times with peaks at a pace of
27.40.05 Ma, reminding about an electrocardiogram. On the occasion of
every heartbeat, a great extinction struck the biosphere, often involving
mainly oceanic biota. Hence, there is urgent need to monitor phenomena in
better detail, in order to avoid that the humans are the subject of the next
extinction. At present, the Earth is experiencing one peak of a heartbeat, even
though we cannot know whether the maximum already occurred or not. The
focus is here on volcanism, that however - owing to the highly uneven and
inhomogeneous historical record - has always been underestimated. In
contrast, it can be shown that volcanism is a significant proxy of the time-
variation of the planetary release of endogenous energy. An important
evidence is that the present variability of volcanic activity is found to be
synchronous all over the globe. Therefore, even one volcano alone can be a
reliable and objective gauge of the time-variation of planetary exhalation of
endogenous energy. There is only need to assess the available time-resolution
of a quantitative monitoring. It is here shown that Stromboli, owing to its
peculiar morphology, can be likened to an effective natural probe that
monitors the time-variation of endogenous energy supply with a time
resolution of a few days. Hence, the systematic exploitation and use of
Stromboli as a natural monitoring facility is recommended, being the present
unique possible quantitative way to monitor, with a high time-resolution, the
time-variation of the primary driver of climate change associated to
© 2021 Giovanni Pietro Gregori and Gabriele Paparo. This open access article is distributed under a Creative Commons
Attribution (CC-BY) 4.0 license.
Giovanni Pietro Gregori and Gabriele Paparo / American Journal of Engineering and Applied Sciences 2021, 14 (2): 351.363
DOI: 10.3844/ajeassp.2021.351.363
endogenous energy. An additional gauge can be, maybe, represented by the
microorganisms that are endemically generated at ocean floors that can
perhaps justify the time evolution of pathogens maybe also some pandemics.
In fact, the mutation of deep ocean biota can be, perhaps, related to the
evolution of pathogens that since several decades are well-known to require
the updating of all vaccines. In addition, these mutations could also be the
possible cause of unprecedented pandemics, that perhaps might even impact at a
possibly increasing frequency. An improved capability to detect environmental
changes with a higher time-resolution is a prerequisite for understanding and
managing also these disquieting and unprecedented threats.
Keywords: Monitoring Climate Change, Time Resolution, Earth’s Heartbeat,
Volcanic Cycles, Stromboli, Climate Proxies, Ocean Floor Biota, Pandemics
Introduction scale. The very often reported belief - that anthropic CO2
is the leading cause of climate change - has been
Only objective observational evidence is here considered observationally proven to be untenable, on the basis of the
any reference is here avoided to computed models. The Earth records by the NASA satellite OCO-2 (Gregori, 2020;
is presently experiencing an unusual period of intense Gregori and Leybourne, 2021 references therein). The
climate change, associated with a heartbeat of the Earth’s phenomenon is accompanied by a large variation of the
electrocardiogram (Fig. 1). One heartbeat is repeated at a viscosity at the base of the lithosphere, i.e., at the
pace of 27.40.05 Ma and it lasts a few Ma (Gregori, 2002; Asthenosphere-Lithosphere Boundary (ALB). The term
2020; Gregori and Leybourne, 2021) and references therein, “asthenosphere” denotes a weak and comparatively less
where several details of the physics of phenomena are rigid, layer characterized by large fracturing due to
extensively discussed). Humankind, having a documented serpentinization and supercritical water (Gregori and
history of, say, 30,000 years, never experienced an Earth’s Leybourne, 2021 and references therein).
heartbeat. This is therefore an unprecedented challenge and Owing to the non-uniform distribution of the release
a real disquieting hazard. In fact, whole human history is of heat-flow over the globe, different regions experience
being developed during the present heartbeat, although a comparatively either higher or lower thermal expansion
the 50,000 year error-bar forbids to assess whether the of the mantle. The formation of huge superswells - almost
peak already occurred, or is still going to happen. A like huge hills - determines the sliding of the lithosphere
higher-resolution gauge is urgently needed. and thrusting into megasynclines, maybe altogether with
Unquestionable and documented information is available some crustal folding. This phenomenon causes orogeny
for heartbeats during at least 70 Ma, but clear indication is and the formation of continents that are later destroyed by
available also during at least 250 Ma or even longer. A recent weathering and erosion, with a cycle of ~100-200 Ma
investigation (Rampino et al., 2021) found-consistently with (maybe ~180 Ma, i.e., Mortari cycle). Therefore, a
the more precise determination of Fig. 1 - a global geologic heartbeat is associated to the enhancement altogether of
activity with pulses displaying an underlying ~ 27.5 Ma geodynamic activity, of volcanism and of the exhalation
cycle, evidenced by a Fourier analysis of 89 major geological of hot fluids into the ocean/atmosphere system The
events during last 260 Ma. In general, on the occasion of incompatibility ought to be pointed out of the best known
every heartbeat, a large extinction event always occurred, and fashionable plate tectonic model, that is unsuited to
mainly involving oceanic biota, resulting from anomalous explain several morphological features (e.g., Gregori,
fluid exhalation from the ocean floors. The challenge is 2002; Gregori and Leybourne, 2021).
therefore to avoid that the present climate change is going to Hence, an ever greater scatter of climate is to be
cause the extinction of humankind. Moreover, all actions expected, that perhaps might occur in the next years with
must be carried out that can prevent and mitigate respect to a mild trend. However, during the next decade
catastrophes, causalities sufferance. the greater solar activity, with an expected maximum in
On the occasion of every heartbeat, a Large Igneous 20241 (Velasco Herrera et al., 2021), ought to temperate
Province (LIP) always was generated. The present a little bit the violence of phenomena. In fact, a higher
ongoing heartbeat is perhaps very close to a maximum. solar activity implies a concentration of sunspots into one
The associated LIP is the birth of Iceland that ~2 Ma or very few areas. The Parker spiral pattern of the solar
ago did not exist. wind shifts from 4 sectors to 2 sectors. Thus, the
The prime driver of climate change is an anomalous electromagnetic (e.m.) induction in the Tide-Driven (TD)
release of endogenous heat, that is manifested through an dynamo of the Earth is affected by a lower frequency e.m.
increase of soil exhalation of hot fluids on the planetary signal (by a factor 1/2), hence by a deeper skin-depth of
352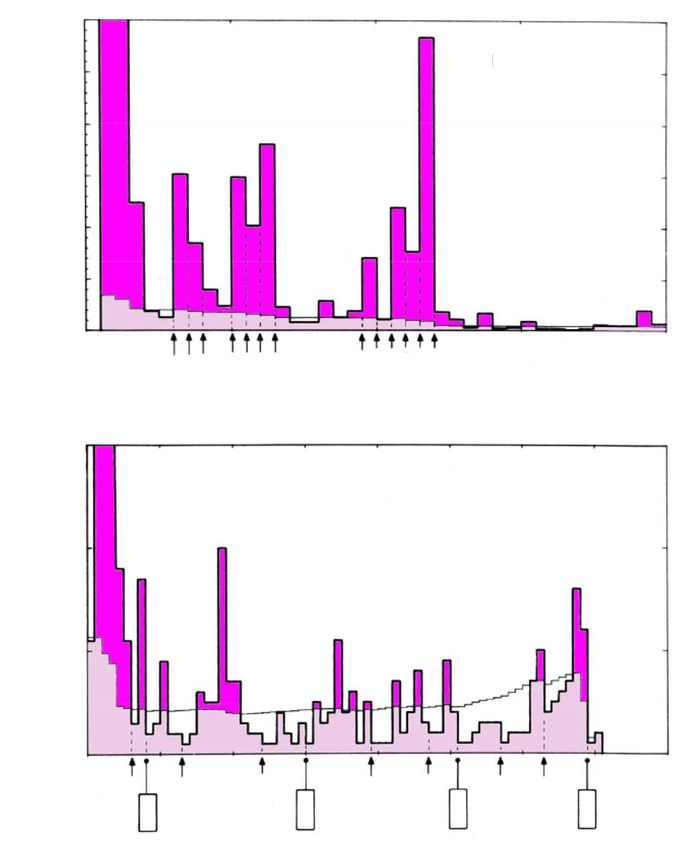
Giovanni Pietro Gregori and Gabriele Paparo / American Journal of Engineering and Applied Sciences 2021, 14 (2): 351.363
DOI: 10.3844/ajeassp.2021.351.363
penetration (see Gregori, 2002; Gregori and Leybourne, “double-eyes” is suggestive of no regular pattern and
2021). The consequent modulation of the TD dynamo is nobody ever gave an explanation for this seemingly
more effective soil exhalation increases. Therefore, when ubiquitous “double-eye” morphological feature.
the Sun is more active, climate is milder, consistently with The double-eye feature is observed in every reported
available observations. geomagnetic anomaly map, e.g., also all over the
The primary energy source is the TD dynamo, supplied Tyrrhenian Sea floor, etc.
mainly by the lunar tide (Gregori, 2002; Gregori and
Detection by Volcanism of Climate Change –
Leybourne, 2021). Energy propagation occurs by the
Hamilton’s variation principle, generating several spikes that Volcanic Cycles (time Resolution 50,000 Years
make the Earth’s interior to look like a sea-urchin, where Through Several 10 Years)
every spike is the conductor of intense DC electric currents, There is urgent need to focus on some proxy capable
that decay by Joule heat at the very top of every spike. This of improving the time-resolution of climate change
explains, e.g., the double-eye pattern of the magnetic
monitoring. Indeed, every action that ought to be taken is
anomalies of the area around a volcanic edifice (Fig. 2).
In fact, the magnetic anomaly of every volcano has a effective when phenomena are at an early stage, in order
typical “double-eye” structure, a pattern that is to be to prevent any larger-scale impact.
associated with DC currents flowing perpendicular to the At present, the time resolution of climate change is
axis joining the centres of such two “eyes”. A usual data very low, as we can only rely on some generalized almost
handling of magnetic anomalies in volcanic areas is subjective feeling of an increased scatter of
concerned with the topographic reduction, by which it is meteorological parameters, or of a seemingly larger
guessed that the outpoured magma solidifies within an seismic activity, etc. As far as volcanoes are concerned,
ambient B, hence the volcano is composed of material that they operate like security valves of a pressure cooker, with
is entirely uniformly magnetised along one and the same a typical timing that can be even of several centuries.
direction. Thus, a higher topographic elevation Therefore, in any case the time-resolution of monitoring
corresponds to a stronger geomagnetic anomaly. Hence, it
of the primary energy supply is very poor.
is customary to subtract, from the observed anomaly,
As far as the output is concerned of the Hawai’i
the contribution that is likely to be originated by the
topographic elevation and by assuming some constant hotspot - that gives evidence of the heartbeats (Fig. 1) - it
specific volume magnetisation. Even after applying can permit only a time resolution of ~50,0000 years, due
such a correction the “double-eye” pattern remains. to intrinsic error-bars (i.e., uncertainty of measurement
Moreover, to our knowledge, the geographic both of volumes of submarine volcanic edifices and of the
distribution of the orientation of the direction of such age of the earliest lava-emplacement).
2.0
1.5
Q (km3/Ma)
1.0
0.5
0.0
10
v (degrees/Ma)
8
6
4
2
0
0 10 20 30 40 50 60 70
Age (Ma)
Fig. 1: Earth’s electrocardiogram derived from the magma emplacement rate vs. time from the Hawai’i hotspot. The top plot refers to
the time rate of the emplaced volume, the lower plot to the speed of the lithospheric drift on top the hotpot. The lower plot has
smaller error-bars. For details refer e.g., to Gregori and Leybourne (2021) and references therein
353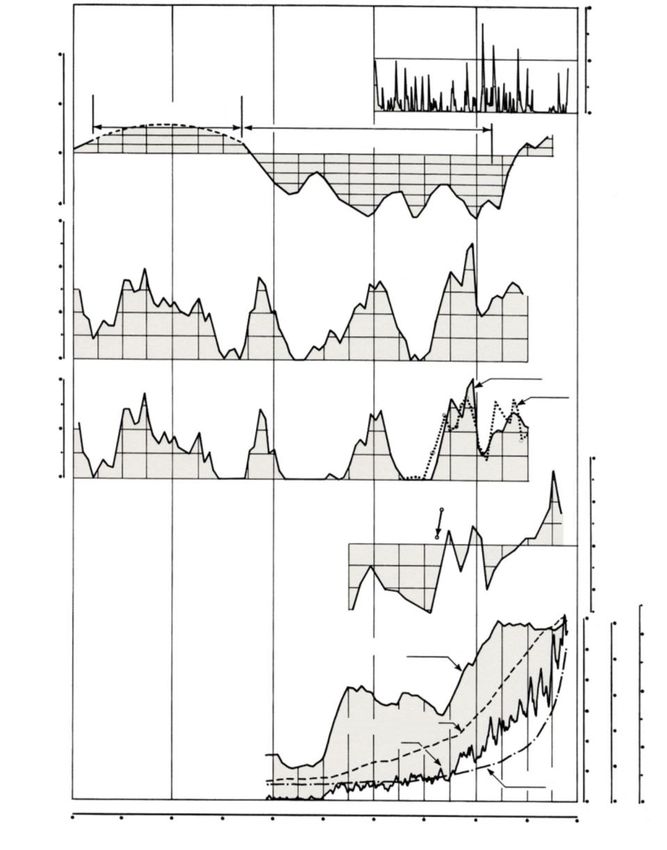
Giovanni Pietro Gregori and Gabriele Paparo / American Journal of Engineering and Applied Sciences 2021, 14 (2): 351.363
DOI: 10.3844/ajeassp.2021.351.363

                                                                                                B

                                                                                  j

                                               3135                                                                nT
                                                                                                                   1300
                                                                                                                   1100
                                               3130
                                                                                                                   900
                                                                                                                   700
                                               3125                                                                500
                                    UTM (Km)

                                                                                                                   300
                                                                                                                   100
                                               3120
                                                                                                                   -100
                                                                                                                   -300
                                               3115                                                                -500
                                                                                                                   -700

                                               3110
                                                  325    330        335        340        345        350
                                                                     UTM (Km)

Fig. 2: (a) -Cartoon showing the scheme of the shallowest extension of a DC circuit supplying the top point of a sea-urchin spike. The
        magnetic field B, that is generated (green), causes a local geomagnetic anomaly of opposite sign (red and blue) on either side
        of the ''horizontal'' segment of such a circuit. The positive or negative sign depends on whether one considers either one
        hemisphere, as the conventional definition of positive and negative sign can have a different meaning, although with no
        ambiguity. (b) -Topography-corrected geomagnetic anomalies of Pico de Teide (Tenerife) (after García et al., 1997; units are
        kilometres; the colour version of the figure is a courtesy by A. Garcìa, I. Blanco and M. Torta)

    Concerning the so-called and generally reported                                   very low thermal conductivity. Glaciers flow like huge
“climatic parameters”, it is well-known that no “mean”                                ice-rivers at a speed even of a few hundred meter per year.
global temperature can be defined. Rather, it is evident that                         Icebergs are formed when an ice sheet is overloaded by an
the scatter of “climate” with respect to a mean trend is more                         excess precipitation at high altitude. Thus, the glacier is
significant compared to every “smooth” and “mild” trend                               pushed downslope, until it floats on ocean water like some
(Pavese and Gregori, 1985). But, the availability of historical                       kind of “ice-tongue”- this is called “outlet glacier”. When
information is in any case very limited, inhomogeneous and                            it abruptly breaks, a large number of icebergs is released.
concerned with very restricted regions.                                               That is, the phenomenon depends on atmospheric
    The often mentioned proxies of glacier retreat                                    precipitation upstream, not on atmospheric temperature.
and/or of sea-level change are of very little help - if any                               In any case, it should be emphasized that a crucial
- as these phenomena are controlled by a large number                                 drawback is the impossibility to estimate the total water
of drivers and mechanisms that are not understood.                                    content that is stored in the four natural reservoirs, i.e.,
Hence, every reported trend can be explained by                                       either in the atmosphere, or in the oceans, or in ice
several competing and contradictory models and no                                     sheets, or underground. In fact, the water storage in
reliable information can be attained. In this respect, a                              every such a reservoir can change vs. time by some even
false though very often mentioned concern refers to                                   very large amount.
icebergs that are claimed to be associated to the increase                                For instance, an enhancement of endogenous heat-flow
of atmospheric temperature. Ice (and also lava) have a                                causes rock dehydration and favors subsequent

                                                                              354
Giovanni Pietro Gregori and Gabriele Paparo / American Journal of Engineering and Applied Sciences 2021, 14 (2): 351.363
DOI: 10.3844/ajeassp.2021.351.363
serpentinization, that reduces friction at the ALB, That is, spikes further penetrate upward, when they reach
increasing geodynamic phenomena and seismicity. But, a sufficiently shallow depth, the reduced lithostatic
owing to serpentinization, the asthenosphere increases pressure permits melting. A new fluid is thus formed - i.e.,
thickness and total volume, hence the total amount is larger magma - that eventually outpours like lava effusion. That
of supercritical water that is stored inside it. is, the system obviates to the deficit of standard fluids and
At the same time, the enhanced hot fluid exhalation creates a new fluid.
from soil originates a greater evaporation of water into This lava generation mechanism - related to the
the atmosphere, while ocean floors and sea bottoms are lithostatic pressure - applies for both primary energy
largely affected by tectonism, that dramatically source (i.e., either Joule or friction). Lava effusion is a
influences the local sea-level change. spectacular seldom-occurring manifestation, much like
In addition, it should be considered that even the a rainbow is an occasional although seldom-occurring
interannual variation of the total cloud cover cannot be event. That is, volcanism is a much more general
monitored, due to the instrumental drift of satellite phenomenon than lava effusion. Huge volcanic
infrared measurements. eruptions eventually imply no lava effusion (e.g., no
Therefore, there is urgent need for alternative and lava effusion is reported from the famous Pompeii AD
more reliable gauges of climate change. 79 eruption).
Unlike what has been generally believed, volcanism Summarizing, a volcano operates like the security
can provide with significant information. However, as valve of a pressure cocker cyclic features can be
a premise there is need the get rid of the conventional effectively monitored as follows. Consider the sequence
way to look at volcanoes, that - as reported also in the of the time-lags t between two subsequent eruptions of
most recent literature - according to some generally one given volcano plot t vs. order number in the
agreed and unconscious feeling are believed to be sequence (this is called “Imbò histogram”). Vesuvius and
supplied by some network of pipelines for lava flow, Etna are the historically best documented volcanoes
reminding about the water-pipes in a building. Thus, (Fig. 3 and 4), even though the bias is evident due to the
reference is often found to “magma chambers” and to incompleteness of the historical data series. The data
the eventual connection between different magma
sources of Fig. 3 and 4 are the volcanic catalogue of the
chambers.
Smithsonian Institution (Simkin et al., 1981) and
That is, the ancient unproven and naïve myth survives
Gasparini and Musella (1991). But, also the assessment of
of the Earth conceived like a hot fluid-ball that cools in
a new eruption, with respect to the continuation of
space. This is a basically unconscious belief, reminding
about the famous naturalist George-Louis Leclerc Comte previous event, is to be critically considered. No detail can
de Buffon (1707-1788) who studied the cooling of bronze be here given. Use is made of the “atl-line” explained in
cannon-balls. The Buffon model seems to be still the captions of Fig. 3.
fashionable, although undeclared, in the literature. Concerning Stromboli, only recently a complete
Observational evidence is in contrast with such a historical data set was published by Bevilacqua et al.
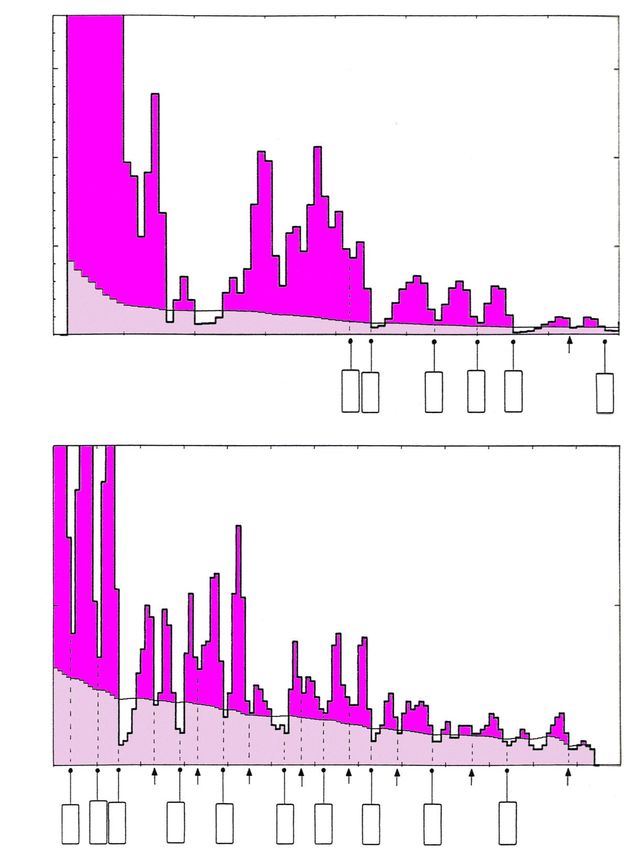
naïve concept. A volcano is just a restricted area (for (2020). The corresponding Imbò histogram (Fig.5) is not
simplicity identify it with a “point”) of anomalous high very expressive, while the Imbò cycles plotted vs. date -
local release of endogenous heat. The energy supply instead of vs. order number - is indicative of a cyclic
can be either (i) by Joule heat on top of a bunch of sea-urchin feature. The great lack of data is evident after 1950. This
spikes (Fig. 2), or (ii) by friction heat consequent to the deficit of information is a clear indication of a lack of any
geodynamic activity and to the sliding of the interest by the scientific community for the physical
lithosphere on the ALB. For instance, the largest significance of Stromboli as a proxy.
number of volcanoes of the Pacific ring of fire is Apart the obvious “prediction” of a possible future
supplied by friction heat. In any case, a magma sub-Plinian eruption of Vesuvius on the basis of the bi-
chamber is always a strictly local feature, specific of millennial historical eruption series (Gregori, 1993;
every given volcano, related to the endogenous heat 1996a, 1996b), one can recognize a cycle in every
source, of any kind. volcanic data series. In order to minimize errors,
The propagation of volcanic heat through the conventionally define that a cycle begins (or ends)
shallowest crustal layers occurs by fluid advection (i.e., corresponding to a minimum of t. Consider the mean
water, oil, geogas others), although only as far as a energy supply per unit time during one cycle of the volcano.
sufficient amount of fluid is available. When the available This mean energy supply is inversely proportional to t. This
fluids are insufficient for energy balance, the local argument is briefly called “calorimetric criterion”. Then, plot
temperature increases, hence also the local electrical the mean energy supply vs. time.
conductivity. The currents of the sea-urchin spike can thus When such an algorithm is applied to Vesuvius and
expand upward according to Hamilton’s principle, etc. Etna (Fig. 6), it is surprisingly found that solar activity
355
Giovanni Pietro Gregori and Gabriele Paparo / American Journal of Engineering and Applied Sciences 2021, 14 (2): 351.363
DOI: 10.3844/ajeassp.2021.351.363
modulates the volcanic supply. In addition, it is of long-range trend deriving from the planetary
paramount importance the fact that, compatibly with the endogenous heat release that affects volcanic cycles.
available historical information, the same trend of heat Differently stated, the lack of any apparent correlation
supply is synchronous for every historical volcano all over of DVI with other indices shows that independent
the world (Gregori et al., 1992). The data source is the phenomena are the volcanic cycles the explosive
aforementioned catalogue by Simkin et al. (1981). eruptions that cause a “nuclear winter scenario”.
Figure 6 was formerly drawn in the early 1990s, in The 2nd diagram (top to bottom) in Fig. 6 shows a
order to check the physical significance and reliability of conventional, classical well known (Eddy, 1976) trend of
the time variation of the primary energy supply to the historical climate. The 3rd and 4th plots were derived
Vesuvius and Etna, as it is inferred from the Imbò cycle by (Stuiver and Braziunas, 1988; 1989 references therein)
analysis of Fig. 3 and 4. The purpose was to compare upon considering that a comparatively higher solar
the result with other known climate proxies. At that activity implies a lower cosmic ray flux impinging on the
time, the available data were the DVI (Dust Veil Index) Earth (Forbush decrease), hence a smaller 14C production
that refers to dust in the atmosphere that reduces solar rate. Two related regression lines are needed (not here
radiation at Earth’s surface. In addition, a well-known shown) that refer to 14C content vs. – respectively - either
Eddy curve was available, plus a tree ring analysis of sunspot number or some indices of geomagnetic activity.
14
C that is indicative of a variation of sunspot cycle. These curves were calibrated by Minze Stuiver et al. by
Finally, a statistical curve was available of global means of available historical observations. Then, the 14C
volcanic activity vs. time, based on the whole content in tree rings (of a given age) was used to infer -
Smithsonian Institution catalogue, upon “normalizing” through the previously determined calibration - either the
the reported eruption number to the total world solar or the magnetic activity index during previous and
non-documented epochs.
population. That is, world population was likened to a
“detector” that reported eruptions. These data are plotted in the 3rd and 4th plots, where
The result displayed in Fig. 6 was surprising and was the dotted line shows, for comparison purpose, the curve
one of the several hunches that formerly triggered Gregori derived from direct sunspot observation. Note that the
(2002). Gregori (2002) later generated other tree-ring-derived curve is physically more objective and
investigations, including the three engines that control significant than the subjective standard astronomical
climate evolution, as reminded in Gregori and Leybourne definition of sunspot numbers. To our knowledge, the most
(2021). It should be pointed out, however, that volcanic recent aforementioned reconstruction of past sunspot cycles
cycles have never been fashionable in the (Velasco Herrera et al., 2021) was not yet correlated with tree
volcanological community. In fact, the study of rings series. Such a very recent reconstruction was derived
volcanic cycles was started in 1928 by the late from Artificial Intelligence (AI) algorithms applied to
Giuseppe Imbò, who later became a renowned Director sunspot data series. In this respect, AI application to
of the Osservatorio Vesuviano. But volcanic cycles astronomical and astrophysical phenomena recently
were later unduly abandoned due to an incorrect use experienced a relevant expansion (see e.g., Fluke and Jacobs,
(and subsequent debate) made by other authors 2019), more specifically, the Deep Learning (DL) and
referring to the Hawai’i volcanism, on the basis of an Machine Learning (ML) algorithms, that are particularly
unsuited data base. This caused an oblivion of this suited for time series analysis (e.g., Lewis, 2016; Nielsen,
algorithm. Owing to brevity purpose, no detail can be 2019). In any case, as far as the application is concerned to
here given. See e.g., a historical account in Bullard volcanic series, a warning is that the observational data base
(1984). This explains, however, the lack of more recent is particularly scant and inhomogeneous the effectiveness of
literature on these topics. any kind of algorithm can be seriously hampered and
A more detailed description of Fig. 6 is as follows. considered with great care.
The top diagram in Fig. 6 is the old classical Dust Veil The 5th plot in Fig. 6 shows the time variation of the
Index (DVI) that denotes the volcanic dust injected into primary energy supply to Etna and Vesuvius in terms of
the stratosphere by explosive eruptions. These events the aforementioned "calorimetric criterion", applied to the
also caused famous famines. The DVI is derived by Imbò histograms of Fig. 3 and 4. The plot conventionally
means of several proxies. See Lamb (1983) and reports the computed ratio relative to the heat supply
references therein. That is, DVI refers to the so-called occurred in AD 1886. The choice of this year was only
“nuclear winter scenario”, which is the object of determined in order to minimize error bars. The trend is
several climate models. Therefore, Fig. 6 shows that found to increase by 500-600% during the last 5-6
this phenomenon is occasional and local, although centuries. This effect can well justify the transition from
implying a planetary catastrophe, in contrast with the the Little Ice Age to present climate.
356Giovanni Pietro Gregori and Gabriele Paparo / American Journal of Engineering and Applied Sciences 2021, 14 (2): 351.363
DOI: 10.3844/ajeassp.2021.351.363
Vesuvius (raw data)
300
Until ~ 1700 A.D.
250
200
150
100
50
0
Time interval
1270
1631
1139
1367
1068
1150
787
968
536
685
472
387
235
30
Since ~ 1100 A.D.
20
10
0
1837
1758
1891
1660
1810
1867
1698
1941
1854
1770
1680
Fig. 3: Imbò histogram both for the bi-millennial and for more recent historical eruption series of Vesuvius. The smooth line is the
mean of all values of the histogram at the right of every respective point (called “average-time-lag-line” or “atl” line) used to
give an objective definition of cycle boundaries. After Gregori (1996a)
357Giovanni Pietro Gregori and Gabriele Paparo / American Journal of Engineering and Applied Sciences 2021, 14 (2): 351.363
DOI: 10.3844/ajeassp.2021.351.363
Etna (smoothed data)
Until ~ 1600 A.D.
150
100
50
0
1578
Time interval
1044
1446
1329
1535
1160
1609
20
Since ~ 1300 A.D.
10
0
1838
1735
1578
1634
1928
1882
1672
1781
1609
1535
1446
1864
1946
1763
1329
1805
1688
1908
Fig. 4: Imbò histogram for Etna (see captions of Fig. 3). After Gregori et al. (1992)
358Giovanni Pietro Gregori and Gabriele Paparo / American Journal of Engineering and Applied Sciences 2021, 14 (2): 351.363
DOI: 10.3844/ajeassp.2021.351.363
50 50
Stromboli – Imbò cycles Vs. year
45 45
40 40
35 Stromboli – Imbò histogram 35
t (years)
t (years)
30 30
25 25
20 20
15 15
10 10
5 5
0 0
2 4 6 8 10 12 14 16 18 20 22 24 26 28 30 32 34 1880 1900 1920 1940 1960 1980 2000 2020
Order number 2020 Year AD
Fig. 5: Imbò histogram for Stromboli Imbò cycles Vs. year. Unpublished figure based on data after Bevilacqua et al. (2020)
8
Laki, asama
Tambora
Kamchatka
Coseguina
El chichon
Krakatoa
Awu
1.0 DVI
T(°C)
0.5
Medieval worm period 40
Little ice age
0
-0.5
60
Āa
40
20
0
Calculated
80 Wolf Spörer Maunder Observed
No of sunspots
minimum minimum minimum
40
1.8
0
(1886.0)
1.4
Vesuvius
(t)/
1.0
Etna and
vesuvius
0.6
Reporting index (% of known volcanoes active)
Volcanoes known and population (107)
60 30
Reporting index 400
Volcanoes active per year
40
20
known
Volcanoes 200
active 20 10
Population
0 0 0
1000 1200 1400 1600 1800 2000
Year (A.D.)
Fig. 6: Comparison of volcanic cycle evidence and climate proxies. See text. Figure after Gregori et al. (1992) and Gregori (2002)
359Giovanni Pietro Gregori and Gabriele Paparo / American Journal of Engineering and Applied Sciences 2021, 14 (2): 351.363
DOI: 10.3844/ajeassp.2021.351.363
In addition, as already mentioned, such a time Gregori and Paparo (2006) reported the interpretation of this
variation of the primary supply to volcanoes is found to phenomenon in terms of the records of Acoustic Emission
be synchronous for every historical volcano from all over (AE), i.e., passive ultrasound monitoring, that measures the
the globe. This is important. In fact, only one volcano is response of the solid materials of the volcanic edifice to the
thus suited to act as a planetary gauge. time-varying impact of the pressure by endogenous hot fluids
The bottom diagram in Fig. 6 - redrawn after the (see details of methods e.g., in Gregori, 2020 and references
Smithsonian Institution Simkin et al. (1981) volcanic therein). To our knowledge AE monitoring resulted to be the
catalogue - shows several parameters, namely a suitably unique specific available instrumental monitoring of the
smoothed trend (i) of the total world population, (ii) of the paroxysm-except seismic records. Two frequencies were
total number of known volcanoes, (iii) of the total number monitored, i.e., a Low-Frequency AE (LF AE) at 25 kH
of reported active volcanoes (iv) of the ''reporting index'', a High Frequency AE (HF AE) at 200 kH. Unlike LF AE
i.e., of the ratio of reported active volcanoes with respect that reflect the mechanical yield of the solid structures
to the total number of known volcanoes. of the volcanic edifice, the HF AE are indicative to the time-
It is worth noting that this same diagram was not reported varying supply of the primary endogenous energy. These AE
in the second edition of the volcanic catalogue of the techniques and methods are quite general suited to monitor
Smithsonian Institution (Simkin and Siebert, 1994), the performance and security of every either natural or
evidently believing that it is not physically significant. This manmade structure (e.g., Gregori, 2020 references therein).
is clearly suggestive of the underestimation of volcanism as The different information is to be stressed between the
a proxy suited to monitor endogenous heat release. Such a amplitude of the recorded HF AE signal (Fig. 7) and the
prevention and drawback derives from an improper concept fractal dimension Dt of the signal (Fig. 8). In fact, the
of the prime drivers of volcanism, related to the fractal dimension denotes how the crystalline bonds of the
aforementioned Buffon’s concept of an Earth considered like solid materials respond to the increasing stress originated
a hot ball that is cooling in space. The completely by the endogenous hot fluids. That is, Dt monitors the
unprecedented perspective, that is highlighted e.g., in performance of the solid structure of the volcanic edifice,
Gregori (2002) on in Gregori and Leybourne (2021), rather than the intensity of the applied stress.
envisages an Earth that behaves like a battery that stores and A similar phenomenon - displaying the typical
releases energy at different times. Thus, a plot, like the difference between raw AE records and D t - was
bottom diagram in Fig. 6 - that was formerly considered observed in the laboratory by stressing by a mechanical
physically unreliable - is found to be significant, even though press - until final rupture - concrete cubes of 15 cm
the historical data base is largely uneven and discontinuous. side, getting plots analogous to Figs. 7 and 8 (Gregori
Summarizing, if one relies on the duration of volcanic and Paparo, 2006 and references therein).
cycles, one can infer a time resolution – for monitoring It is thus found in Fig. 8 that Dt steadily increased during
the endogenous heat that controls climate change - that is several months. The records were interrupted on September
compatible with the duration of a volcanic cycle, such as 23rd, 2002, due to a bad functioning of the recording device.
in Fig. 6. On the other hand, the time resolution is in the Consider the unfriendly environmental conditions where
order of magnitude of at least several decades, or even of instruments are operated. It is therefore very reasonable to
a few centuries. In addition, the historical information is infer that when the threshold Dt = 1 was attained, the volcanic
scant - in the ultimate analysis - this proxy is therefore of edifice yielded and new boas were opened on the flank of the
volcano, causing also a small tsunami.
little practical use.
Some fluctuations in Fig. 8 are associated to the erratic
Stromboli (Time Resolution a Few Days) changes of the endogenous fluid pressure, that are shown
in Fig. 7. The 4-5 day periodical variation in Fig. 8 is
Stromboli is peculiar, as it displays a unique and classical
probably associated to the meteorological circulation, by
well-known morphology. The size of Stromboli is
which the weight exerted on the volcanic edifice by the
comparable to Etna’s - unlike Vesuvius that has a linear size
three times smaller. But, unlike Etna (which is up to 3326 m atmospheric pressure modulates the response of the stress
high, although the height is increasing), Stromboli is almost applied to the materials.
entirely immersed in water, with peak elevation at 926 m When the rupture threshold is attained, the paroxysm
above sea level. Hence, unlike Etna, Stromboli has a huge occurs the volcano is reset. That is, Stromboli - through
availability of water that, by advection, periodically releases the fractal dimension of cyclic activity - is an effective
the energy that is accumulated during a time-lag of, say, t natural probe suited to monitor in real time the time-
20 min. Instead, Etna accumulates the internal heat until the variations of endogenous heat supply.
stored energy is sufficient to generate an adequate amount of The interpretation was also checked with CO 2
lava. Thus, a lava effusion can occur the phenomenon is exhalation recorded in several wells that other authors
repeated at a pace of the order of, say, 2-3 years. independently monitored on the island. However, soil
On 28-30 December 2002, Stromboli had an unusual exhalation of fluids is sensitive to the enormous local
great paroxysm, that also caused a small tsunami. space-gradient of soil porosity, by which measurements are
360Giovanni Pietro Gregori and Gabriele Paparo / American Journal of Engineering and Applied Sciences 2021, 14 (2): 351.363
DOI: 10.3844/ajeassp.2021.351.363
greatly scattered and affected by large error-bars. In any case, On May 19th, 2021, Stromboli had a new violent
the mean trend was found to be consistent with the AE paroxysm, reported by all mass media, with no
records, although upon allowing for a conspicuous scatter. consequences. This is consistent with the several other
It is therefore concluded that the peculiar nature of reported proxies that indicate an ongoing climate
Stromboli permits to monitor in real time the trend of the change. Unfortunately, no AE recording station is
time-variation of the endogenous heat supply, with the presently operated on the island.
time-resolution permitted by the variations of the It can be stated that every eventual volcano with a
atmospheric baric pressure, i.e., with a time-resolution of similarity to Stromboli - even though with a different timing
the order of magnitude of, say, one or a few days, as the of cycles - can be considered an efficient natural gauge of the
performance of the volcanic edifice responds to the mean time-variation of the planetary primary endogenous heat
supply. Every such a volcano operates almost like a
trend of the endogenous time-varying stress.
dedicated probe, aimed to monitor - on the time-scale of the
The Stromboli monitoring looks therefore precise,
cycle - the variations all over the globe of the release of
objective sensitive to minor changes.
endogenous heat by the TD dynamo.
300
200
AE (mV)
100
0
0 5 10 15 20 25 30 4 9 14 19
Aug Sep
Fig. 7: ''The result of applying the triangular weigh function of width t = 12 h to the August and September raw data set (every raw
datum is a 15 min average). Figure after Paparo et al. (2004).'' Figure and captions after Gregori and Paparo (2006)
Stromboli HF AE fractal dimension D
0.9 August-September
2002
0.8
0.7
0.6
D
0.5
0.4
0.3
Date 10 20 30 9 19 29
Aug Sep
Fig. 8: ''Fractal dimension Dt computed on the point-like process that results after subtracting the 12 h running-average, shown in
Fig. 7, from the unsmoothed raw data set (i.e., every raw datum is an average over 15 min). The point-like process is defined
by choosing only 'YES' events that result above some given threshold. Every Dt value was computed for one day. Whenever
the number of 'YES' events available for one given day resulted insufficient, several subsequent days were considered altogether
and they are here plotted like several days with the same Dt. We stress the significant circumstance by which, when the volcanic
edifice is 'deflating' and Dt results comparatively low, the AE events in the point-like process seldom occur, due to a temporary
reduction, or lack, of any prime energy breeding to the volcano. Figure after Paparo et al. (2004).'' The added orange arrow
shows the increasing trend that presumably continued until reaching on December 28th a value Dt = 1. See text. Figure
(modified) and captions after Gregori and Paparo (2006)
361Giovanni Pietro Gregori and Gabriele Paparo / American Journal of Engineering and Applied Sciences 2021, 14 (2): 351.363
DOI: 10.3844/ajeassp.2021.351.363
Ocean Floor Biota Also deep ocean-floor biota is a possible proxy, with a
time-resolution defined by the frequency of deep ocean
Even though we have no competence in microbiology, sampling and by the sensitivity of biota to changes of
another possible and important gauge of the time variation endogenous soil exhalation. Monitoring the mutation of
of the endogenous heat supply - with a time resolution of, deep ocean-floor biota, depending on the change of
say, a few months - can be provided by the time variations endogenous geothermal flux, is an important proxy for
of deep ocean floor biota. understanding the role of the biosphere in the Earth
In fact, it is now well-assessed that life (microorganisms) evolution and, maybe, even a way to know in advance the
are steadily and endemically regenerated of the deep ocean eventual birth of new pathogens that can even trigger
floors, being supplied by endogenous exhalation of hot CH4 unprecedented diseases or pandemics.
(Judd and Hovland, 2009). It is therefore reasonable to
expect that, maybe, a relevant change of the release of
Acknowledgement
endogenous heat flow can produce a possible mutation of the
generated microorganisms. We want to acknowledge all co-workers that, in
In this respect, since several decades it is well- different ways and at different times, contributed to the
known that vaccines have to be continuously updated, exploitation of the analyses mentioned in the present
due to the mutations of the pathogens. This means that, study. We like also to thank for the warm encouragement
maybe, also pandemic phenomena can be originated by we had from several outstanding scientists, such as Iginio
changes of the microorganisms that are spontaneously Marson and the late Arnaldo D’Amico. We also thank the
generated at deep ocean floors. unknown referees for useful suggestions.
That is, if this tentative hypothesis is correct, biota
could be a reliable proxy aimed to monitor the effect of Funding Information
some forthcoming impact of the biosphere on climate,
including some expected pathogens that might eventually All investigations mentioned in this study were carried
imply a pandemic hazard. out - before retirement of both authors - in the framework
Therefore, a reasonable recommendation is that samples of the institutional activity of IDASC of the Italian CNR.
of matter (sand) from deep ocean floors ought to be
systematically collected every few months by Autonomous Author’s Contributions
Underwater - or Unmanned - Vehicles (AUV) in order to Giovanni Pietro Gregori: Data analysis and
monitor the ongoing mutations of micro-biota. This could be writing the paper.
a way to monitor the role of endogenous heat exhalation on Gabriele Paparo: Instrument instalment and
life evolution and also a way to know - in advance - the operation in the field, data acquisition, relevant physical
eventual possible trigger of any new unpredictable contribution to discussion and interpretation.
pandemics. This is speculative, although realistic.
The time resolution that can be attained depends on the Ethics
AUV operation costs, but mainly on the unknown
sensitivity of the biological sensor to changes of This article is original and contains unpublished
endogenous heat flow. If successful, this would result to material. Authors declare that there are not ethical issues
be a highly reliable and precise monitoring of the and no conflict of interest that may arise after the
mutations of the global environment, while whole Earth publication of this manuscript.
is a unique natural system, including the biosphere.
References
Conclusion Fluke, C. J., & Jacobs, C. (2020). Surveying the reach and
Climate change is an unprecedented challenge for maturity of machine learning and artificial intelligence
humankind and must be monitored objectively and with high in astronomy. Wiley Interdisciplinary Reviews: Data
time-resolution in order to be able to plan timely actions Mining and Knowledge Discovery, 10(2), e1349.
aimed either to prevent catastrophes or to mitigate the hazard. https://onlinelibrary.wiley.com/doi/abs/10.1002/widm.
Climate change can be indicatively monitored by 1349
means of several proxies that give a quantitative and García, A., Blanco, I., Torta, J. M., & Socías, I. (1997).
objective gauge, however with various time-resolution. High-resolution aeromagnetic survey of the Teide
The focus is here on volcanic cycles - that are a generally volcano (Canary Islands): A preliminary analysis.
underestimated proxy - and, more specifically the focus is Annals of Geophysics, 40(2).
on Stromboli that gives information with a precise highly https://www.annalsofgeophysics.eu/index.php/ann
valuable time-resolution of a few days. als/article/view/3915
362Giovanni Pietro Gregori and Gabriele Paparo / American Journal of Engineering and Applied Sciences 2021, 14 (2): 351.363
DOI: 10.3844/ajeassp.2021.351.363
Gasparini, P., & Musella, S. (1991). Un viaggio al Rampino, M. R., Caldeira, K., & Zhu, Y. (2021). A pulse
Vesuvio. Il Vesuvio visto attraverso diari, lettere e of the Earth: A 27.5-Myr underlying cycle in
resoconti di viaggiatori. Liguori Editore, 307. coordinated geological events over the last 260 Myr.
https://www.ibs.it/viaggio-al-vesuvio-vesuvio-visto- Geoscience Frontiers, 12(6), 101245.
libro-paolo-gasparini-silvana- https://doi.org/10.1016/j.gsf.2021.101245
musella/e/9788820720896 Judd, A., & Hovland, M. (2009). Seabed fluid flow: the
Gregori, G. P. (1993). The next eruption of Somma- impact on geology, biology and the marine
Vesuvius. Schröder (1993), 191-213. environment. Cambridge University Press.
Gregori, G. P. (2002). Galaxy-Sun-Earth relations. The https://doi.org/10.1017/CBO9780511535918
origin of the magnetic field and of the endogenous Lamb, H. H. (1983). Update of the chronology of
energy of the Earth, with implications for volcanism, assessments of the volcanic dust veil index. Climate
geodynamics and climate control and related items of Monitor, 12(3), 79-90.
concern for stars, planets, satellites and other Lewis, N. D. C. (2016). Deep learning made easy with R:
planetary objects. A discussion in a prologue and two a gentle introduction for data science. AusCov.
parts. Beitrage zur Geschichte der Geophysik und https://www.amazon.com/Deep-Learning-Made-
Kosmischen Physik, 3, 471. Easy-Introduction/dp/1519514212
http://ncgtjournal.com/additional-resources.html Nielsen, A. (2019). Practical time series analysis:
Gregori, G. P. (2020, September). Climate Change, prediction with statistics and machine learning. "
Security, Sensors. In Acoustics (Vol. 2, No. 3, pp. O'Reilly Media, Inc.".
474-504). Multidisciplinary Digital Publishing https://www.amazon.com/Practical-Time-Analysis-
Institute. https://doi.org/10.3390/acoustics2030026 Prediction-Statistics/dp/1492041653
Gregori, G. P., & Leybourne, B. A. (2021). Climate Paparo, G., Gregori, G. P., Taloni, A., & Coppa, U.
change-An unprecedented challenge for (2004). Acoustic emissions (AE) and the energy
humankind survival. Energy exploitation from the supply to Vesuvius-“Inflation” and “deflation” times.
atmospheric electrical circuit, American Journal Acta Geodaetica et Geophysica Hungarica, 39(4),
Engineering Applied Science, in the press. 471-480.
Gregori, G. P., & Paparo, G. (2006). The Stromboli crisis https://doi.org/10.1556/AGeod.39.2004.4.14
and tsunami of 28-30 December 2002. Acta Pavese, M. P., & Gregori, G. P. (1985). An Analysis of
Geodaetica et Geophysica Hungarica, 41(2), 273-287. Six Centuries (XII through XVII Century AD of
https://doi.org/10.1556/AGeod.41.2006.2.10 Climatic Records from the Upper Po Valley.
Gregori, G. P. (1996a). Satellites, volcanoes and global Historical events and people in geosciences, 185-220.
change. Earth Space Review, 5(1), 17-26. Simkin, T., & Siebert, L. (1994). Volcanoes of the World.
https://doi.org/10.1016/0273-1177(95)00071-L Geosciences Press, Inc. Tusson.
Gregori, G. P., (1996b). The next eruption of Somma- Simkin, T., Siebert, L., McClelland, L., Bridge, D.,
Vesuvius. In Proceedings of the 4th Workshop of Newhall, C., & Latter, J. H. (1981). Volcanoes of the
Progetto Strategico Clima, Ambiente e Territorio world: a regional directory, gazetteer and chronology
nel Mezzogiorno, Lecce, November 11-14, 1991, 2 of volcanism during the last 10,000 years. US
vol., V. Piccione and C. Antonelli (eds), CNR, Hutchinson Ross Publishing. ISBN-10: 0879334088
Roma., pp. 399-468. Stuiver, M., & Braziunas, T. F. (1988). The solar
Gregori, G. P., Banzon, V. P., Leonardi, R., & de Franceschi, component of the atmospheric 14 C record. In
G. (1992). Geomagnetic activity versus volcanic cycles Secular Solar and Geomagnetic Variations in the Last
and their forecasting. Application to Etna and Vesuvius. 10,000 Years (pp. 245-266). Springer, Dordrecht.
Schröder and Legrand (1992), 188-222. https://doi.org/10.1007/978-94-009-3011-7_15
Herrera, V. V., Soon, W., & Legates, D. R. (2021). Does Stuiver, M., & Braziunas, T. F. (1989). Atmospheric 14 C
Machine Learning reconstruct missing sunspots and and century-scale solar oscillations. Nature,
forecast a new solar minimum?. Advances in Space 338(6214), 405-408.
Research. https://doi.org/10.1016/j.asr.2021.03.023 https://doi.org/10.1038/338405a0
363You can also read