Total Ortholog Median Matrix as an alternative unsupervised approach for phylogenomics based on evolutionary distance between protein coding genes ...
←
→
Page content transcription
If your browser does not render page correctly, please read the page content below
www.nature.com/scientificreports
OPEN Total Ortholog Median Matrix
as an alternative unsupervised
approach for phylogenomics
based on evolutionary distance
between protein coding genes
Sandra Regina Maruyama1*, Luana Aparecida Rogerio1, Patricia Domingues Freitas1,
Marta Maria Geraldes Teixeira2 & José Marcos Chaves Ribeiro3*
The increasing number of available genomic data allowed the development of phylogenomic
analytical tools. Current methods compile information from single gene phylogenies, whether based
on topologies or multiple sequence alignments. Generally, phylogenomic analyses elect gene families
or genomic regions to construct phylogenomic trees. Here, we presented an alternative approach
for Phylogenomics, named TOMM (Total Ortholog Median Matrix), to construct a representative
phylogram composed by amino acid distance measures of all pairwise ortholog protein sequence
pairs from desired species inside a group of organisms. The procedure is divided two main steps, (1)
ortholog detection and (2) creation of a matrix with the median amino acid distance measures of all
pairwise orthologous sequences. We tested this approach within three different group of organisms:
Kinetoplastida protozoa, hematophagous Diptera vectors and Primates. Our approach was robust and
efficacious to reconstruct the phylogenetic relationships for the three groups. Moreover, novel branch
topologies could be achieved, providing insights about some phylogenetic relationships between
some taxa.
Reconstruction of phylogenetic relationships has extensively been performed by molecular systematics; in which
traditionally, different methods encompassing multiple sequence alignments and tree reconstruction algorithms
analyze ribosomal sequences or conserved protein-coding g enes1. Molecular phylogenetic trees are based on
mutations differentially accumulated in orthologous gene pairs, being constructed either with DNA or amino
acid sequences. Evolutionary changes in amino acid sequences are useful for long-term evolution informa-
tion; because they are more conserved than DNA ones as they reflect the selection effects of non-synonymous
nucleotide changes on c odons2. However, choosing the right orthologous pair is not straightforward. Sequences
that are very constrained are also very conserved, so no differences between species may be found. On the other
hand, sequences that are very divergent can lead to distorted phylogenies.
The post-genomic era has provided large and unprecedent sequence datasets for thousands of organisms
across several taxa of the Tree of Life. Consequently, molecular phylogenetics has benefited; phylogenomics has
emerged as a relevant field, integrating molecular evolutionary analyses with genomic d ata3,4. Methods such as
supertree5,6, supermatrices7–9, mega-phylogeny10 and multispecies coalescent model11,12 have been applied to
reconstruct large phylogenies in a way that multi-gene phylogenies represent collectively a single evolutionary
landscape.
Each method mentioned differs in some or many points among them, but all of them share the principle of
combining individual gene phylogenies to plot a representative phylogenetic tree. Briefly, the supertree method
relies on the compilation of topologies from several source gene trees for producing a single tree, whereas the
supermatrix method is based on building a large multiple sequence alignment for simultaneous analyses of
1
Department of Genetics and Evolution, Center for Biological Sciences and Health, Federal University of São Carlos
(UFSCar), São Carlos, SP 13565‑905, Brazil. 2Department of Parasitology, ICB, University of São Paulo (USP), São
Paulo, SP, Brazil. 3Vector Biology Section, Laboratory of Malaria and Vector Research, National Institute of Allergy
and Infectious Diseases, National Institutes of Health, 12735 Twinbrook Parkway rm 2E32, Rockville, MD 20852,
USA. *email: srmaruyama@gmail.com; jribeiro@niaid.nih.gov
Scientific Reports | (2021) 11:3791 | https://doi.org/10.1038/s41598-021-81926-w 1
Vol.:(0123456789)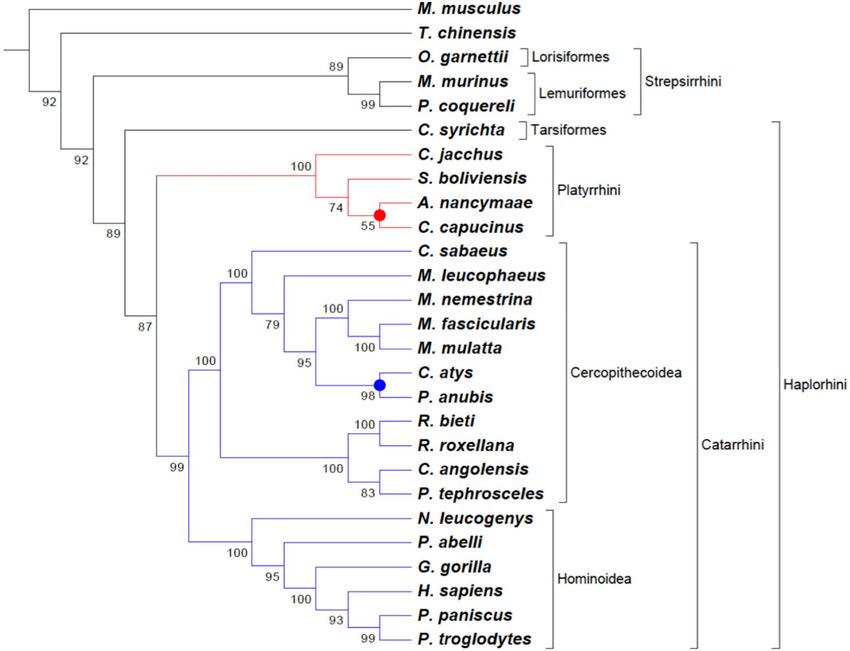
www.nature.com/scientificreports/
a giant phylogenetic matrix. Mega-phylogeny method is derivative from the latter, with some improvements
during construction of multiple sequence alignments. Lastly, coalescent-based species tree method integrates
population genetics processes with mathematical model to deal with heterogeneity and incongruity of gene trees
to build a single tree.
Here, we present TOMM (Total Ortholog Median Matrix) as an alternative approach for phylogenomics, in
which we propose the use of all orthologous pairs from the desired species for building a matrix based on their
median amino acid distance obtained from the proteome (i.e., protein sequences of all protein-coding genes
from a genome). Thus, we obtain a phylogeny based on the orthologous forest of sequences (an unsupervised
strategy) rather than sets of trees knowingly selected (a supervised strategy).
TOMM retrieves orthologous proteins by using the Reciprocal Smallest Distance (RSD) method, which
provides evolutionary distance measures used to build a distance matrix to obtain comprehensive phylograms.
To evaluate the efficiency of such new approach, we have tested TOMM in three eukaryote groups of organisms:
Kinetoplastida protist, Diptera hematophagous insects, and human and non-human Primates. We used these
emblematic groups because of their relevance in the association among the taxa related to parasite-vector-host
interaction. Moreover, this triad covers, in a modest way, a reasonable and feasible diversity of eukaryotes, includ-
ing unicellular, invertebrate, and higher vertebrate organisms.
Kinetoplastid protists are flagellate excavates belonging to the phylum Euglenozoa. The members of the
Kinetoplastea are characterized by the presence of circular DNA network disks (called kDNA) inside a large
mitochondrion. This group presents a great biological variety, from free-living to parasitic organisms. Most
known members belong to the family Trypanosomatidae, which are all obligate endoparasitic, comprising either
monoxenous (single host, restricted to invertebrates) or dixenous (two hosts, a vertebrate or plant and an inver-
tebrate vector) life cycles. The family Trypanosomatidae comprises 22 genera distributed in six formally recog-
nized subfamilies13. Although most trypanosomatid genera are monoxenous, being able to infect only insects,
this family is well known because of the dixenous genera Leishmania and Trypanosoma, which comprise species
pathogenic to humans, causing serious insect-borne infectious diseases, such as leishmaniasis and Chagas’s
disease, respectively. Because of the medically important species and their biological diversity, kinetoplastids
represent an interesting model for understanding the evolution of both parasitism and pathogenicity.
The blood feeding habit evolved independently multiple times among the 400 hematophagous arthropod gen-
era (over 14,000 species)14, including within the Diptera where it developed independently within the Brachycera
(tsetse and tabanid flies), and at least twice in the suborder Nematocera to produce the mosquitoes and sand
flies. These organisms are vectors of leishmaniasis, African trypanosomiasis, malaria, filariasis, and several viral
diseases such as yellow fever, dengue, and zika.
Closing the triad, we performed the TOMM approach in higher vertebrates, represented herein by the Pri-
mates order, which is one of the most diverse among the mammals, comprising over 470 s pecies15. Primates
present extraordinary variations regarding ecological, behavioral, morphological, and evolutionary aspects.
Genomic and genetic characterizations of primates are not only important for species conservation and evo-
lutionary insights16,17, but also for understanding human evolution and genome structure from a biomedical
perspective [reviewed in18]. Indeed, evolutionary genomics of host–pathogen interaction has been considered
a trait for molecular phylogeny, and correlations between immunity against infections and Primates evolution
have been targeted to understand how viral, bacterial, and parasitic diseases emerged to elucidate their different
manifestations depending on host s pecies19.
Overall, we implemented the TOMM phylogenomic approach for the three focal groups of organisms. The
TOMM resulting trees are in good agreement with latest phylogenetic thoughts for the three groups of organisms.
Results and discussion
The overall procedure of TOMM approach is diagramed in Fig. 1. TOMM efficiently recovered known phyloge-
netic relationships and additionally was able to provide new phylogenetic insights. The three data sets analyzed
herein produced well-resolved phylogenies. The Kinetoplastid tree (Fig. 2) showed congruent results with the
most recent studies on this g roup13,20,21, with additional new possible relationships between some genera. Simi-
larly, the hematophagous dipteran tree (Fig. 3) resembled the most recent phylogenetic relationships consid-
ered for the vectors of Malaria, viral diseases, leishmaniasis, and sleeping s ickness22. For the Primates, TOMM
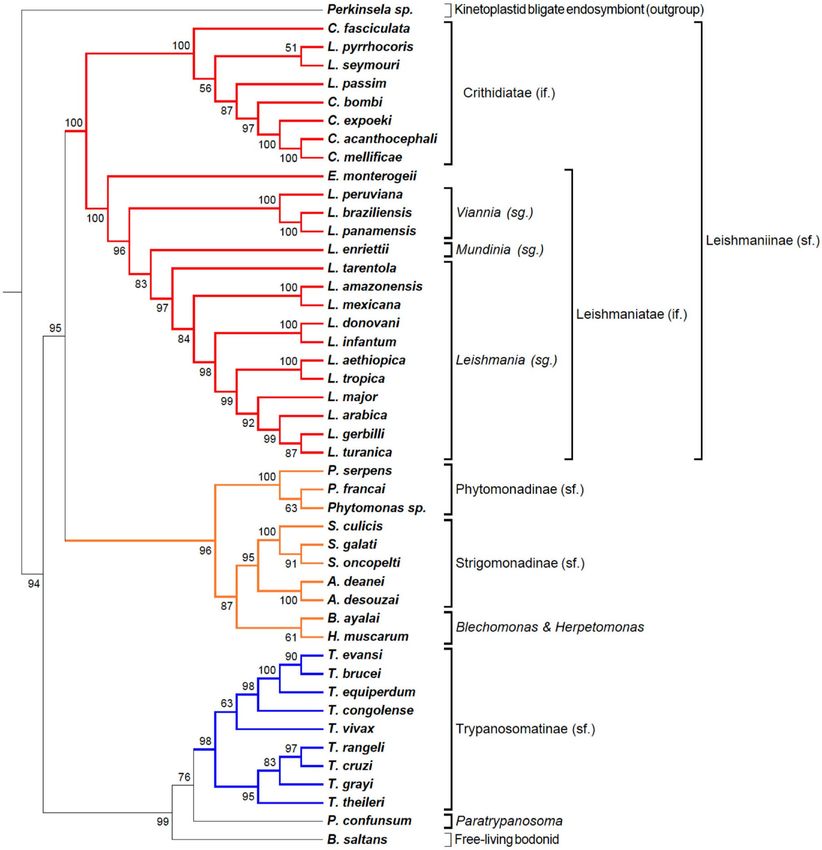
phylogeny revealed two main clades, separating the most primitive primates (Strepsirrhini) from the other ones
(Haplorrhini), that include Tasiiformes and Simiiformes. Among the haplorrhines, Platyrrhini formed a distinct
well-supported clade from Catarrhini (Fig. 4), as expected18,23. However, TOMM was not efficient in recovering
Cebus and Saimiri as a single clade of Cebidae family, clustering Cebus and Aotus in a non-supported clade (a.u.
55). Similarly, non-expected results were observed to C. atys and P. nubis, though with a high probability support
(a.u. 98). The resulting trees are described and discussed in more detail hereafter.
Kinetoplastid tree. In the past decades, molecular phylogenetics using rRNA sequences and protein
sequences have shed light in the evolutionary biology of this group, showing that parasitism evolved several times
inside Kinetoplastea13,24. Comparative genomics of dixenous and monoxenous trypanosomatids were compared
to the free-living kinetoplastid, Bodo saltans, thought to be the closest relative of the trypanosomatids13,20.
Important phylogenomics studies brought up key phylogenies across representative kinetoplastids from gen-
era Leishmania, Trypanosoma, Phytomonas, Leptomonas, and Bodo20. More recently, such analyses were expanded
to over 30 species encompassing several members for each life cycle: free-living, monoxenous, and dixenous
parasites13. Collectively, these phylogenies were constructed using some gene families and a core of 64 conserved
proteins. The TOMM approach has already been applied to Trypanosomatidae family in a study that identified a
new parasite found in a fatal case of visceral leishmaniasis, where 36 genomes from trypanosomatids were u sed25.
Scientific Reports | (2021) 11:3791 | https://doi.org/10.1038/s41598-021-81926-w 2
Vol:.(1234567890)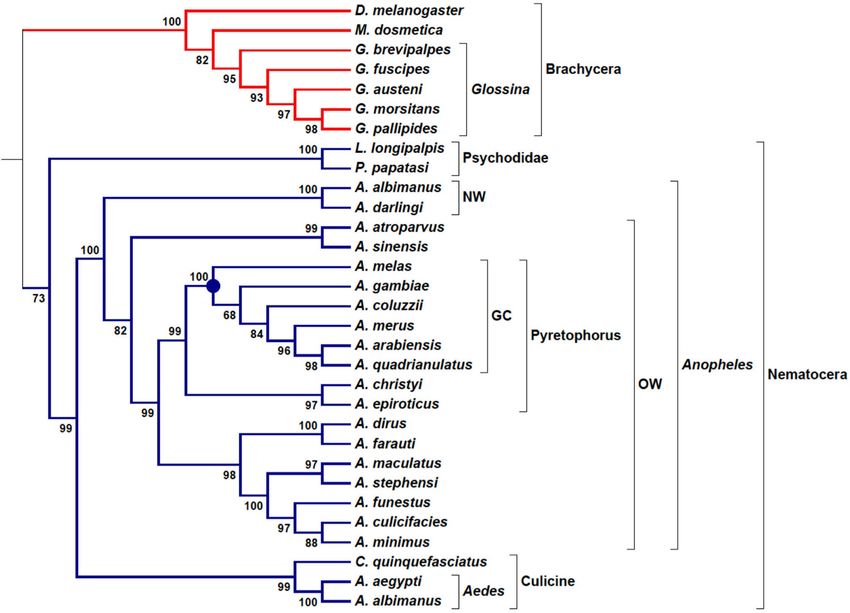
www.nature.com/scientificreports/
Figure 1. Workflow of TOMM approach for Phylogenomics. Main procedures are depicted, along with used
software in each step. 1: open reading frame; 2: coding sequences; 3: High-Performance Computing.
Here, we presented a phylogenomic analysis of kinetoplastids based on at least 1473 orthologous proteins across
45 species with published genomes, comprising flagellates of all lifestyles (see Table 1).
The resulting tables of pairwise orthologs were sorted to find the median value of the amino acid distance
and thus populate a pairwise matrix (Supplemental Table 1, sheet “AA distance”). The minimum number of
ortholog sequences found in the condition above was 1473, found for the Perkinsela sp./Phytomonas serpens
pair, and the maximum was 8434 sequences, found for the Crithidia spp./Leptomonas pyrrhocoris proteome pair
(Supplemental Table 1, sheet “Number-50”). This matrix was submitted to the program Pvclust, which provides
statistical evaluation of the tree nodes expressed as approximately unbiased (a.u.) α values, where α = 1 − P. The
phylogram was exported as a Newick file, including the a.u. values and annotated using the program MEGA 6.
The resulting phylogram built using the total proteome median matrix from kinetoplastid species harboring
bacterial endosymbionts, free-living, monoxenous, and dixenous parasites is shown on Fig. 2. The enigmatic non-
flagellated kinetoplastid Perkinsela spp, an obligate endosymbiont of Paramoeba (an amoeba genus considered
an opportunistic pathogen of fish and marine invertebrates)26,27, is a clear outgroup. Usually, the free-living Bodo
saltans, the closest known free-living relative of trypanosomatids, served as an outgroup for phylogenomics of
trypanosomatids13,20. This Bodonidae species was placed in a sister position to Trypanosoma, whereas previous
phylogenomic studies based on 64 well-conserved proteins strongly supported (1/100 BI posterior probabilities
and ML bootstrap values) the late emergence of trypanosomatids as a sister group of Bodo saltans (Eubodo-
nida)28. Here we were able to provide a higher statistical probability node support (a.u. 99), based on an average
of 4999 orthologous proteins with a minimum (1833) and maximum (6022) ortholog pairs with Perkinsela spp
and Trypanosoma theileri, respectively (Supplemental Table 1). In our analysis, between Trypanosoma spp. and
B. saltans (free-living) is placed the monoxenous Paratrypanosoma confunsum, an early-branching trypano-
somatid. In previous analyses, P. confusum branched at the base of the family Trypanosomatidae, representing
Scientific Reports | (2021) 11:3791 | https://doi.org/10.1038/s41598-021-81926-w 3
Vol.:(0123456789)www.nature.com/scientificreports/
Figure 2. Phylogenomic tree of Kinetoplastid protozoa. Phylogram constructed with the TOMM approach
using approximately 5636 orthologous protein pairs across 46 Kinetoplastida species with genome sequence
available (Table 1 and Supplemental Table S1). Numbers next to the branches represent the percentages of
ackage82 in R (R
approximate unbiased support probabilities for 10,000 bootstraps, calculated using the pvclust p
Core Team. R: A language and environment for statistical computing. R Foundation for Statistical Computing,
Vienna, Austria, 2018, URL: https://www.R-project.org/). The Newick file was annotated using the program
MEGA 6. Abbreviations: if (infra family); sg (subgenus); sf (subfamily).
a link between the ancestral free-living bodonids and the parasitic trypanosomatids13,21,29. The heterogeneity
composition regarding the kinetoplastid life cycles make this clade a valuable source of information to elucidate
the evolution of parasitism.
Corroborating the most recent expanded phylogeny tree of trypanosomatids from Lukes et al. (2018), the
phylogram indicates the existence of two subfamilies with strong statistical support, Trypanosomatinae and
Leishmaniinae. The Trypanosomatinae includes the parasites from the genus Trypanosoma, all dixenous species
excepting T. evansi and T. equiperdum24, with important pathogens for humans and livestock. Trypanosoma vivax
Scientific Reports | (2021) 11:3791 | https://doi.org/10.1038/s41598-021-81926-w 4
Vol:.(1234567890)www.nature.com/scientificreports/
Figure 3. Phylogenomic tree of hematophagous Diptera. Phylogram constructed with the TOMM approach
using approximately 8168 orthologous protein pairs across 31 Diptera species with genome sequence available
(Table 2 and Supplemental Table S2). Numbers next to the branches represent the percentages of approximate
vclust82 package in R (R Core Team.
unbiased support probabilities for 10,000 bootstraps, calculated using the p
R: A language and environment for statistical computing. R Foundation for Statistical Computing, Vienna,
Austria, 2018, URL: https://www.R-project.org/). The Newick file was annotated using the program MEGA 6.
NW New World, OW Old World, GC gambiae complex.
occupies a basal position within a clade with T. brucei, representing the African trypanosomes pathogenic to
ungulates. The basal position of T. vivax in the clade is in accordance with previous r esults30,31.
The Leishmaniinae subfamily comprises two major Sections, Euleishmania (Leishmania) and Paraleishmania
(Porcisia and Endotrypanum)32–35. The two sister clades, representing Euleishmania and Paraleishmania, were
recently proposed as the infrafamily Leishmaniatae, whereas Crithidiatae infrafamily comprises all other genera
of Leishmaniinae: Crithidia, Leptomonas, Lotmaria, Novymonas, Zelonia, and Borovskiya36,37.
The “Crithidiatae” clade is composed of monoxenous species and presented maximum statistical node sup-
port (a.u. 100), but subclades composed by Leptomonas, Lotmaria, and Crithidia species resulted from low node
support (a.u. 56 and a.u. 51), with Crithidia fasciculata clustered apart from the Crithidia clade composed of C.
bombi, C. expoeki, C. acanthocephali, and C. mellificae (a.u. 97). This reinforces the non-monophyletic origins of
Crithidia members, and the revision of Crithidia genus as claimed by others38,39. Although monoxenous, Crith-
idiatae members, such as Leptomonas, have been detected in humans as co-infections in visceral leishmaniasis
clinical cases40–42.
The Leishmaniatae (all dixenous) are clearly divided into the Leishmania and Viannia sub-genera, with L.
tarentolae, a lizard parasite, occupying the most basal position in the Leishmania subgenus. Previously, this
species was classified in the subgenus Sauroleishmania but was later shown from molecular phylogenetics to be
closer to members of the Leishmania subgenus43,44. Leishmania enriettii from the subgenus Mundinia is located
between the Viannia and Leishmania subgenera, as inferred by other phylogenetic studies45–47. However phy-
logenetic analyses, including other members of Mundinia, such as L. (Mundinia) martiniquensis and L. (M.)
macropodum, support the most basal position of this subgenus in the genus Leishmania33–35. Endotrypanum is the
only known kinetoplastid able to infect erythrocytes of their mammalian host (sloths)48. In the present study, E.
monterogeii clearly clustered apart from all other subgenera of Leishmania as observed previously33–35. Between
the clades Trypanosomatinae and Leishmaniinae, our analysis supports a clade sister to Leishmaniinae formed
by two very-well supported clades: one comprising the genus Phytomonas (Phytomonadinae subfamily), whose
Scientific Reports | (2021) 11:3791 | https://doi.org/10.1038/s41598-021-81926-w 5
Vol.:(0123456789)www.nature.com/scientificreports/
Figure 4. Phylogenomic tree of Primates. Phylogram constructed with the TOMM approach using
approximately 23,826 orthologous protein pairs across 25 Primates species with genome sequence available
(Table 3 and Supplemental Table S3), and two outgroup species. Numbers next to the branches represent the
percentages of approximate unbiased support probabilities for 10,000 bootstraps, calculated using the p vclust82
package in R (R Core Team. R: A language and environment for statistical computing. R Foundation for
Statistical Computing, Vienna, Austria, 2018, URL: https://www.R-project.org/). The Newick file was annotated
using the program MEGA 6.
species parasitize plants and another encompassing the bacterial-symbiont harboring genera, Strigomonas and
Angomonas (Strigomonadinae subfamily). Interestingly, in our study Herpetomonas muscarum, which parasitize
dipteran flies and Blechomonas ayalai, a parasite of fleas, formed a unique subclade sister to Strigomonadinae, a
subfamily which includes bacterial endosymbiont harboring trypanosomatids of i nsects49–52. From these previ-
ous studies, the genus Herpetomonas is more closely related to the genera Phytomonas (transmitted to plants by
phytophagous hemipterans) and Lafontella, the three genera forming the subfamily Phytomonadinae, whereas
Blechomonas ayalai constituted the monogeneric b lechomonadinae24,51. To the best of our knowledge, this is the
first phylogenomic analysis that includes Herpetomonas and Blechomonas, whose species are found in closely
related orders of insect hosts, Diptera and Siphonaptera, more phylogenetically related between them, than to
Hemiptera, the order of the Phytomonas vectors53. However, phylogenomics, including more species of Herpe-
tosoma, and the genus Lafontella, are still required to sustain this relationship.
To test the robustness of the method, we generated phylograms using the 25th and 75th percentiles instead of
the median 50th percentile (Supplemental Figures S1 and S2, respectively), as well as running the RSD program
with 1e−20 instead of 0.001 value for the blast including parameter, and 0.5 instead of 0.8 for the sequence length
ratio including parameter (Supplemental Fig. S3). We also randomly reduced the proteomes to one half of their
sizes and calculated the resulting median-based phylogram (Supplemental Fig. S4). They are all very similar, with
some small deviations in the a.u. values, and T. vivax presented shifted placement within Trypanosoma cluster,
but always with a.u. values smaller than 90.
Many orthology detection strategies are available, which raise many discussions about the ideal ortholog iden-
tification method, concerning to sensitivity and specificity. So far none of them is considered a gold s tandard54.
The RSD method was applied within the TOMM pipeline because it is the only method which outputs an evolu-
tionary distance measure. The OrthoMCL algorithm has been considered a balanced method identification and
Scientific Reports | (2021) 11:3791 | https://doi.org/10.1038/s41598-021-81926-w 6
Vol:.(1234567890)www.nature.com/scientificreports/
Species name Life cycle Genome source Protein sequence source1 Publication Genome size (Mb) Number of s equences2
Endosymbiont-bearing mon-
Angomonas deanei NCBI Orf/blastx REFSEQ PMID23560078 23 6255
oxenous
Endosymbiont-bearing mon-
Angomonas desouzai NCBI Orf/blastx REFSEQ PMID21420905 24.3 6282
oxenous
Blechomonas ayalai Monoxenous TriTrypdb TriTrypdb PMID27021793 N/A 8037
Bodo saltans Free living NCBI NCBI PMID19068121 39.9 17,840
Crithidia acanthocephali Monoxenous NCBI Orf/blastx REFSEQ PMID23560078 33.8 11,800
Crithidia bombi Monoxenous NCBI Orf/blastx REFSEQ PMID29304093 31.4 7675
Crithidia expoeki Monoxenous NCBI Orf/blastx REFSEQ PMID29304093 34 10,254
Crithidia mellificae Monoxenous NCBI Orf/blastx REFSEQ PMID24743507 58.7 7660
Crithidia fasciculata Monoxenous TriTrypdb TriTrypdb N/A 41.3 9489
Endotrypanum monterogeii Dixenous TriTrypdb TriTrypdb N/A 32.5 8285
Herpetomonas muscarum Monoxenous NCBI Orf/blastx REFSEQ N/A 30.8 10,297
Leishmania amazonensis Dixenous Unicamp Unicamp PMID23857904 31.3 7316
Leishmania arabica Dixenous TriTrypdb TriTrypdb N/A 31.3 8646
Leishmania aethiopica Dixenous TriTrypdb TriTrypdb N/A 32.6 8722
Leishmania enriettii Dixenous TriTrypdb TriTrypdb N/A 30.8 8731
Leishmania gerbilli Dixenous TriTrypdb TriTrypdb N/A 31.4 8599
Leishmania braziliensis Dixenous NCBI NCBI PMID26384787 35.2 8151
Leishmania donovani Dixenous NCBI NCBI PMID22038251 32.4 7960
Leishmania infantum Dixenous NCBI NCBI PMID29273719 32.4 8141
Leishmania major Dixenous NCBI NCBI PMID16020728 32.3 8306
Leishmania mexicana Dixenous NCBI NCBI PMID26452044 32.1 8137
Leishmania panamensis Dixenous NCBI NCBI PMID25707621 31 7742
Leishmania peruviana Dixenous NCBI Orf/blastx REFSEQ PMID26384787 33.4 7155
Leptomonas pyrrhocoris Monoxenous NCBI NCBI PMID27021793 30.4 9284
Leptomonas seymouri Monoxenous NCBI NCBI PMID26317207 27.1 8485
Leishmania tarentolae Dixenous TriTrypdb TriTrypdb N/A N/A 8305
Leishmania tropica Dixenous TriTrypdb TriTrypdb N/A 32.3 8824
Leishmania turanica Dixenous TriTrypdb TriTrypdb N/A 32.2 8608
Trypanosoma evansi Monoxenous TriTrypdb TriTrypdb N/A N/A 12,838
Lotmaria passim Monoxenous NCBI NCBI PMID26146231 27.7 4850
Perkinsela sp. Obligate endosymbiont NCBI NCBI PMID28916813 9.5 5192
Phytomonas francai Dixenous (plants) NCBI Orf/blastx REFSEQ PMID28082482 17.7 6410
Phytomonas sp. Dixenous (plants) NCBI NCBI PMID24516393 18 4905
Phytomonas serpens Dixenous (plants) TriTrypdb TriTrypdb N/A 25.7 7329
Endosymbiont-bearing mon-
Strigomonas galati NCBI Orf/blastx REFSEQ PMID24015778 27.2 6785
oxenous
Endosymbiont-bearing mon-
Strigomonas culicis NCBI Orf/blastx REFSEQ PMID23560078 25.4 6778
oxenous
Endosymbiont-bearing mon-
Strigomonas oncopelti NCBI Orf/blastx REFSEQ PMID24015778 25 9642
oxenous
Trypanosoma brucei Dixenous NCBI NCBI PMID16020726 26.5 8132
Trypanosoma congolense Dixenous NCBI NCBI N/A 39.2 19,062
Trypanosoma cruzi Dixenous NCBI NCBI PMID24482508 30.4 7659
Trypanosoma equiperdum Dixenous NCBI NCBI PMID28138343 26.2 10,001
Trypanosoma grayi Dixenous NCBI NCBI PMID25977781 20.9 10,576
Trypanosoma rangeli Dixenous NCBI NCBI PMID25233456 18.1 7331
Trypanosoma theileri Dixenous TriTrypdb TriTrypdb N/A 29.8 11,312
Trypanosoma vivax Dixenous TriTrypdb TriTrypdb N/A 24.7 11,362
Paratrypanosoma Monoxenous NCBI NCBI PMID29078369 27.5 9606
Table 1. Characteristics and source of genome-derived proteomes of kinetoplastids used in this work. 1.
Protein sequences were obtained from NCBI, TriTrypDB, or deduced from genome by obtaining open reading
frames and adjusting starting Met by blastx to Protozoa-Refseq NCBI database; 2. After clusterization at 99%
and removal of sequences smaller than 50 aa. N/A: not available.
Scientific Reports | (2021) 11:3791 | https://doi.org/10.1038/s41598-021-81926-w 7
Vol.:(0123456789)www.nature.com/scientificreports/
its database OrthoMCL-DB is a well-known portal for grouping orthologous protein sequences in a genome-scale
across multiple s pecies55. However, OrthoMCL does not provide an evolutionary distance measure. Regardless,
we checked the RSD-derived orthologs with OrthoMCL-DB via TriTrypDB using the same set of species in
which proteins were retrieved from the latter on (Table 1, as indicated in “Protein sequence source” column), in
order to enable comparisons between the ortholog lists from obtained RSD and OrthoMCL-DB (Supplemental
Table S4). From the total of 78 pairs of species comparison, an average of 87% ± 7.4% (Mean ± SD) of orthologs
were detected by both methods. In half of the species combination (39 pairs), the RSD method was able to identify
a higher number of orthologs in 16 pairs (20%), representing ortholog pairs exclusively detected by RSD over 50%
higher than OrthoMCL-DB (pairwise comparisons with ratio of unique orthologs ≥ 1.5 at column “M” in Sup-
plemental Table S4, e.g. L. enrietti vs T. evansi pair #38, which presented 755 unique orthologs with RSD against
446 unique orthologs with OrthoMCL). In turn, 29 pairs of species comparison (37%) represented number of
orthologs exclusively detected by OrthoMCL-DB that were over 50% higher than RSD (e.g. pairwise comparisons
with ratio of unique orthologs ≤ 0.5 at column “M” in Supplemental Table S4, e.g. L. tropica vs L. gerbilli pair #43,
which presented 189 unique orthologs with OrthoMCL against 56 unique orthologs with RSD). In the remaining
comparisons (43%) the number of unique orthologs detected by each method were homogenous (Supplemental
Table S4). Overall, the orthology inference was very dependent for a given pair of species (e.g. Endotrypanum
monterogeii vs Leishmania tarentolae or Leishmania gerbilli vs Trypanosoma evansi), but we observed few and
homogenous differences between the number orthologs detected by OrthoMCL and RSD, without significant
difference between them (Supplemental Fig. S7).
To further test the robustness of our approach, we employed another pipeline for identification of orthologs,
using the S onicParanoid56 program with the MCL algorithm. This program produces an output with the pre-
dicted ortholog pairs from a two species comparison but lacks the calculation of the average amino acid dis-
tance between these pairs. We thus wrote a program that generated a fasta file containing the sequences of
each ortholog pair, which was submitted to Clustal57 alignment, which in turn was submitted to a subroutine
of the Mega X package58 to calculate the average amino acid distance for the pair. This allowed to generate a
SonicParanoid-based amino acid distance matrix that was submitted to Pvclust as described above for the RSD-
derived orthologs. The phylogenetic trees of kinetoplastid species generated by the TOMM-RSD and TOMM-
SonicParanoid methods can be viewed in Supplemental Figs. S5 and S6. All the branches of the trees depicting the
various subgroups are congruent. The main difference between the trees is the location of Boldo saltans, which is
within the Trypanosomatidae in the RSD-derived tree, with a support of 92%, but in the SonicParanoid tree it is
located in between the Leishmanidae and Trypanosomatidae. We conclude that the use of an alternate method
of determining the orthologs does not affect the results of the TOMM approach to phylogeny determination.
The Sonic approach has the advantage of being very fast compared with the RSD, but the lack of an output of the
paired amino acid distances removes this advantage compared to the RSD method. It would be very useful if the
sonic paranoid pipeline included the resulting average amino acid distance of the ortholog pairs.
Hematophagous dipteran tree. The phylogenomic tree for Diptera vectors was built with 29 species
from Brachycera (Tsetse flies, Glossina) and Nematocera (the majority are Anopheles mosquitoes) suborders
(Table 2), using the non-hematophagous D. melanogaster as outgroup and M. domestica as a comparator species
for Glossina genus. Here, the main vectors related to Kinetoplastid parasites are species from the Glossina genus
and Psychodidae family (sandflies), which transmit, respectively, African Trypanosoma and Leishmania proto-
zoans. Hematophagous hemipterans from the subfamily Triatominae are another important group of vectors for
Trypanosoma parasites; however they were not considered here, because of the high distance in phylogenetic
relationship between the Diptera and Hemiptera orders. In fact, due to the great diversity of insects, even inside
the Diptera order, it is observed as a very large distance among the families. Such diversity can be verified by the
wide range in genome sizes and number of protein-coding genes shown in Table 2.
The phylogram for hematophagous dipterans was based on an average of 8168 orthologous proteins, with a
minimum number of ortholog sequences (5893) found in Anopheles maculatus/ Lutzomyia longipalpis pair of
vectors species. The highest number of2 ortholog sequences was 13,161 between the Tsetse flies Glossina austeni
and Glossina pallipides (Supplemental Table ). To the best of our knowledge, these are the highest numbers of
orthologous genes considered for taxa inside Diptera, as collectively surveyed p reviously59.
The well-known D. melanogaster was considered an outgroup species to hematophagous dipterans, but as
a dipteran it has not presented a proper isolation of an outgroup, being positioned inside the highly supported
Brachycera clade (a.u. 100). In general, as observed for Primates and Kinetoplastida, the TOMM approach was
also robust in building the phylogenetic relationships to this group of dipterans (Fig. 3). The Nematocera clade
presented a moderate support (a.u. 73), which can be explained by a split in two families, Psychodidae (Lutzo-
myia longipalpis and Phlebotomus papatasi) and Culicidae (Anopheles, Aedes and Culex) (Fig. 3). Interestingly,
in previous insect phylogenomics studies, Culicidae species have been placed apart from all other dipterans,
and although more externally, Psychodidae is positioned in the same clade with Glossina and Drosophila54.
However, here we have found an opposite topology reached by TOMM phylogram for Psychodidae species, in
which Phlebotomus and Lutzomyia were more closely related to Culicidae (all Nematocera) than the Brachycera
species (Glossina genus).
The evolutionary relationships of Anopheline mosquitoes are widely studied because of the great medical
importance of this group as vectors of Malaria, especially the Anopheles gambiae complex, which is composed of
eight species morphologically indistinguishable; however the species display differential traits such as, behavior,
ecological niche, and vector competence60. Using whole-genome reference sequences, different phylogenetic
relationships between genomic regions have been inferred for A. gambiae complex when differential analyses
target autosomes or sex chromosomes and coding or non-coding loci60,61. A consensus phylogenetic relationship
Scientific Reports | (2021) 11:3791 | https://doi.org/10.1038/s41598-021-81926-w 8
Vol:.(1234567890)www.nature.com/scientificreports/
Total number of
Species Order level Family Common name Disease’s vector Geneset version Genome size (Mb) sequences
Dengue, yellow fever,
Nematocera, Culico-
Aedes aegypti Culicidae Yellow fever mosquito chikungunya and Zika AaegL5.1 1278 16,355
morpha
(all viruses)
Dengue, La Crosse
Nematocera, Culico-
Aedes albopictus Culicidae Asian tiger mosquito encephalitis and West AaloF1.2 1923 15,564
morpha
Nile fever
Nematocera, Culico- American Malaria Malaria (Plasmodium
Anopheles albimanus Culicidae AalbS2.5 173 11,882
morpha mosquito protozoan)
Nematocera, Culico- African Malaria Malaria (Plasmodium
Anopheles arabiensis Culicidae AaraD1.8 247 13,221
morpha mosquito protozoan)
Nematocera, Culico- European Malaria Malaria (Plasmodium
Anopheles atroparvus Culicidae AatrE2.1 225 13,717
morpha mosquito protozoan)
None; comparator
Nematocera, Culico-
Anopheles christyi Culicidae Mosquito species for A. gambiae AchrA1.6 173 10,696
morpha
complex
Nematocera, Culico- African Malaria Malaria (Plasmodium
Anopheles coluzzii Culicidae AcolM1.6 225 14,502
morpha mosquito protozoan)
Malaria (Plasmo-
Nematocera, Culico- Asian Malaria mos-
Anopheles culicifacies Culicidae dium; Apicomplexa AculA1.5 203 14,138
morpha quito
protozoan)
Nematocera, Culico- American Malaria Malaria (Plasmodium
Anopheles darlingi Culicidae AdarC3.7 137 10,493
morpha mosquito protozoan)
Nematocera, Culico- Asian Malaria mos- Malaria (Plasmodium
Anopheles dirus Culicidae AdirW1.7 216 12,711
morpha quito protozoan)
Nematocera, Culico- Asian Malaria mos- Malaria (Plasmodium
Anopheles epiroticus Culicidae AepiE1.6 223 11,854
morpha quito protozoan)
Nematocera, Culico- Asian/Oceania Malaria Malaria (Plasmodium
Anopheles farauti Culicidae AfarF2.4 172 12,967
morpha mosquito protozoan)
Nematocera, Culico- African Malaria Malaria (Plasmodium
Anopheles funestus Culicidae AfunF1.8 225 13,163
morpha mosquito protozoan)
Nematocera, Culico- African Malaria Malaria (Plasmodium
Anopheles gambiae Culicidae AgamP4.9 251 13,474
morpha mosquito protozoan)
Nematocera, Culico- Asian Malaria mos- Malaria (Plasmodium
Anopheles maculatus Culicidae AmacM1.5 302 14,828
morpha quito protozoan)
Nematocera, Culico- African Malaria Malaria (Plasmodium
Anopheles melas Culicidae AmelC2.5 224 14,738
morpha mosquito protozoan)
Nematocera, Culico- African Malaria Malaria (Plasmodium
Anopheles merus Culicidae AmerM2.7 288 13,264
morpha mosquito protozoan)
Nematocera, Culico- Asian Malaria mos- Malaria (Plasmodium
Anopheles minimus Culicidae AminM1.7 202 12,455
morpha quito protozoan)
Anopheles quadrian- Nematocera, Culico- African Malaria Malaria (Plasmodium
Culicidae AquaS1.9 283 13,168
nulatus morpha mosquito protozoan)
Nematocera, Culico- Asian Malaria mos- Malaria (Plasmodium
Anopheles sinensis Culicidae AsinC2.2 298 19,247
morpha quito protozoan)
Nematocera, Culico- Asian Malaria mos- Malaria (Plasmodium
Anopheles stephensi Culicidae AsteI2.3 223 11,699
morpha quito protozoan)
lymphatic filariasis
Nematocera, Culico- Southern house (worm), West Nile
Culex quinquefasciatus Culicidae CpipJ2.4 579 18,364
morpha mosquito fever and St. Louis
encephalitis (viruses)
Drosophila mela- Brachycera, Musco- None; comparator
Drosophilidae Fruit fly – 138 17,261
nogaster1 morpha species for dipterans
Animal African
Brachycera, Musco- Trypanosomiasis
Glossina austeni Glossinidae Tsetse fly GausT1.6 370 19,732
morpha (Trypanosoma pro-
tozoan)
Animal African
Brachycera, Musco- Trypanosomiasis
Glossina brevipalpis Glossinidae Tsetse fly GbreI1.6 315 14,650
morpha (Trypanosoma pro-
tozoan)
Human African
Brachycera, Musco- Trypanosomiasis
Glossina fuscipes Glossinidae Tsetse fly GfusI1.6 375 20,141
morpha (Trypanosoma pro-
tozoan)
Human and Animal
Brachycera, Musco- African Trypanoso-
Glossina morsitans Glossinidae Tsetse fly GmorY1.9 355 12,507
morpha miasis (Trypanosoma
protozoan)
Continued
Scientific Reports | (2021) 11:3791 | https://doi.org/10.1038/s41598-021-81926-w 9
Vol.:(0123456789)www.nature.com/scientificreports/
Total number of
Species Order level Family Common name Disease’s vector Geneset version Genome size (Mb) sequences
Human African
Brachycera, Musco- Trypanosomiasis
Glossina pallidipes Glossinidae Tsetse fly GpalI1.6 357 19,308
morpha (Trypanosoma pro-
tozoan)
American Visceral
Nematocera, Psycho-
Lutzomyia longipalpis Psychodidae Sand fly Leishmaniasis (Leish- LlonJ1.4 154 10,284
domorpha
mania protozoan)
Brachycera, Musco- None; comparator
Musca domestica Muscidae House fly MdomA1.3 636 15,116
morpha species for Glossina
Old World cutaneous
Nematocera, Psycho-
Phlebotomus papatasi Psychodidae Sand fly Leishmaniasis (Leish- PpapI1.4 364 11,152
domorpha
mania protozoan)
Table 2. Characteristics of genome-deduced proteomes (all* from VectorBase, www.vectorbase.org ) from
hematophagous Diptera insects used in this work. *Except for Drosophila; 1. Obtained from NCBI.
between A. gambiae (G) and A. coluzzi (C) as a sister group (G + C) was found in two comprehensive studies using
X chromosome or autosomes, employing Maximum-Likelihood- (ML)60 or Bayesian Multispecies Coalescent
model-61 based methods. In addition, another sister group composed of A. arabiensis (A) and A. quadrianulatus
(Q) was inferred only when X chromosome genomic regions were u sed60,61.
Here, the clade topology of A. gambiae complex reached by TOMM approach (Fig. 3) corroborates the sister
group A + Q inferred by known X chromosome phylogenies with high confidence (a.u. 98). However, the topol-
ogy for other species relationships depicted a different scenario. Of note, G + C were not placed together in a
same branch and A. merus (R), often branched in a more external position of the trees, was significantly (a.u. 96)
placed more internally close to A + Q pair. Moreover, A. melas (L) was the earliest branched species in the clade;
whereas in known phylogenies, A. merus was placed in this position. Thus, while the most recent t opologies61
for A. gambiae complex presented patterns as (R((L(A + Q))(G + C))) for non-coding and ((L(A + Q))(R(G + C)))
for coding data from X chromosome, the TOMM approach reassembled the pattern (L(G(C(R(A + Q))))) using
all sets of orthologous proteins (over 8000 coding sequences) found for the 29 species used.
Primates tree. The Primates phylogenomic tree included 25 species presenting published whole-genome
sequence, encompassing all sublevels of the order, including lemurs, lorises, tarsiers, New World Monkeys
(NWM), Old World Monkeys (OWM), big apes, and humans15, and includes the two additional mammals spe-
cies that were used as outgroups (see Table 3). The Primates phylogram was based on aveage 23,826 ortholo-
gous proteins, with a minimum number of ortholog sequences (19,185) found in Propithecus coquereli/Carlito
syrichta pair of primate species. If considered the entire phylogram, which includes the two outgroups species,
the overall minimum number of ortholog sequences was 18,970 (Tupaia chinensis/Carlito syrichta pair). The
highest number of ortholog sequences was 39,341 between Homo sapiens and Pan troglodytes, showing that the
topology achieved by the TOMM approach accounts for both the number of orthologs, as well as amino acid
distances (Supplemental Table 3).
The Primates phylogram showed correctly Mus musculus as an outgroup and several well-formed clades
within the Strepsirrhini and Haplorrhini suborders (Fig. 4). Main taxonomic groups at suborder sublevels (Catar-
rhini and Platyrrhini), as well as at family level (Cercopithecidae and Hominidae), resemble current knowledge
(Lockwood et al. 2004; Langergraber et al. 2012; Freitas et al. 2018). Among the superfamily Hominoidae, the
human location and its relationship with the gorilla and chimpanzee/bonobo clades (a.u. 100) from the Homi-
ninae subfamily was similar to that shown in previous studies62–64, suggesting an accelerated evolution of human
genes, as proposed by Hubisz and P ollard65. The position of Nomascus leucogenys, the critically endangered gib-
bon from the Hylobatidae family, is also accurate66. However, two clades showed different clustering compared to
other Primates phylogenomic s tudies18,23: one regarding OWM (Catarrhini) from Cercopithecoidea (highlighted
in blue) and another clustering NWM (Plathyrrhini) from Aotus and Cebus genres (highlighted in red) (Fig. 4).
Cercocebus atys is an OWM, who inhabits the West African forests (from Senegal and Congo), consid-
ered, by IUCN, as Vulnerable (VU)66. This species is naturally infected by the Simian Immunodeficiency Virus
(SIVsmm), and due to its close-relationship with humans, the hazardous form of this virus, HIV-2 (Human
Immunodeficiency Virus, type 2), was transmitted to m an67. Such genus has been commonly placed closer to
the baboons from Mandrillus genus68,69. However, we did not use any protein collection from Mandrillus species
in our approach. The most related species from Papionini tribe used herein was from Macaca genus and from
the widest-ranging baboon Papio anubis, which clustered with C. atys, and then to Macaca species, that showed
highly supported clades.
Related to the NWM platyrrines, Cebus capucinus from the Cebidae family clustered with the only night
monkey species with complete genome sequence available, Aotus nancymaae from the Aotidae family, rather
than the other Cebidae representative, Saimiri boliviensis (Fig. 4). Aotus neotropical monkeys are often used as a
primate biological model for Plasmodium infection in Malaria researches70, raising extensive discussions about
their evolutionary relationships with other N WM71. Classical overviews on adaptive radiation of neotropical
primates, discussing phylogenetic relationships and inconsistences among Saimiri, Cebus and Aotus, highlighted
discordances between morphological and molecular analyses72,73. Nevertheless, mostly molecular approaches
have usually considered Saimiri and Cebus as representatives from the Cebidae family, and Aotus as a distinct
Scientific Reports | (2021) 11:3791 | https://doi.org/10.1038/s41598-021-81926-w 10
Vol:.(1234567890)www.nature.com/scientificreports/
Total number of
Species Order levels Family Abbreviation Common name Genome size (Mb) sequences1
Aotus nancymaae Simiformes, Platyrrhini Aotidae AOTNAN Ma’s night monkey 2862 30,849
Callithrix jacchus Simiformes, Platyrrhini Cebidae CALJAC White-tufted-ear marmoset 2733 31,373
Carlito syrichta Tarsiiformes Tarsiidae CARSYR Philippine tarsier 3454 26,764
Cebus capucinus Simiformes, Platyrrhini Cebidae CEBCAP White-faced sapajou 2718 35,515
Cercocebus atys Simiformes, Catarrhini Cercopithecidae CERATY Sooty mangabey 2848 38,743
Chlorocebus sabaeus Simiformes, Catarrhini Cercopithecidae CHLSAB Green monkey 2790 38,532
Colobus angolensis Simiformes, Catarrhini Cercopithecidae COLANG Angolan colobus 2970 28,757
Gorilla gorilla Simiformes, Catarrhini Hominidae GORGOR Western gorilla 3074 31,611
Homo sapiens Simiformes, Catarrhini Hominidae HOMSAP Human 3096 54,793
Macaca fascicularis Simiformes, Catarrhini Cercopithecidae MACFAS Crab-eating macaque 2947 36,852
Macaca mulatta Simiformes, Catarrhini Cercopithecidae MACMUL Rhesus monkey 3097 34,238
Macaca nemestrina Simiformes, Catarrhini Cercopithecidae MACNEM Pig-tailed macaque 2949 37,815
Mandrillus leucophaeus Simiformes, Catarrhini Cercopithecidae MANLEU Drill 3062 28,631
Microcebus murinus Lemuriformes Cheirogaleidae MICMUR Gray mouse lemur 2487 33,966
Nomascus leucogenys Simiformes, Catarrhini Hylobatidae NOMLEU White-cheeked gibbon 2962 28,771
Small-eared galago, or
Otolemur garnettii Lorisiformes Galagidae OTOGAR 2520 25,278
Bushbaby
Pan paniscus Simiformes, Catarrhini Hominidae PANPAN Pigmey chimpanzee 3287 31,623
Pan troglodytes Simiformes, Catarrhini Hominidae PANTRO Chimpamzee 2892 45,468
Papio anubis Simiformes, Catarrhini Cercopithecidae PAPANU Olive baboon 2959 39,065
Piliocolobus tephrosceles Simiformes, Catarrhini Cercopithecidae PILTEP Ugandan red Colobus 2923 33,549
Pongo abelli Simiformes, Catarrhini Hominidae PONABE Sumatran orangutan 3253 32,655
Propithecus coquereli Lemuriformes Indiidae PROCOC Coquerel’s sifaka 2798 23,684
Rhinopithecus bieti Simiformes, Catarrhini Cercopithecidae RHIBLE Black snub-nosed Monkey 2977 32,121
Rhinopithecus roxellana Simiformes, Catarrhini Cercopithecidae RHIROX Golden snub-nosed monkey 2900 28,672
Saimiri boliviensis boliviensis Simiformes, Platyrrhini Cebidae SAIBOL Bolivian squirrel monkey 2609 26,794
Tupaia chinensis (outgroup) Euarchontoglires, Scadentia Tupailidae TUPCHI Chinese tree shrew 2847 27,162
Mus musculus (outgroup) Euarchontoglires, Rodentia Muridae MUSMUS Common mouse 2654 76,190
Table 3. Characteristics of genome-deduced proteomes (all from NCBI*) from mammals used in this work.
* https://www.ncbi.nlm.nih.gov/genome ; protein sequences were retrieved from RefSeq database. 1. After
clusterization at 99% and removal of sequences smaller than 50 aa.
clade from Aotidae63,64,73. Such results were also observed by the most complete primate mitogenomics performed
to date17. Our TOMM phylogenomic tree revealed a low probability supported clade (a.u. 55), clustering Aotus
and Cebus when a cutoff value of 50% was considered. Such unresolved clustering may have been shaped by
influence of the total number of orthologous proteins found among the three species, since Aotus-Cebus pair pre-
sented more orthologous proteins (25,629), than Saimiri-Cebus (24,085) or Aotus-Saimiri (23,205) (Supplemental
Table 3). Thus, the results presented here should maintain this evolutionary debate within the field of primatology.
Concluding remarks
Even with genomic data available for several groups of organisms along the tree of life, reaching a definitive
evolutionary relationship among taxa is still hard. That is because evolution of genomes undergoes great dynamic
evolutionary processes with different pressures depending on the genomic region and gene product function.
Evaluating phylogenomic relationships depends on numerous supervised methods and procedures, all subject to
variable benefits and disadvantages, where a trade-off between accuracy and objectivity is pondered relying on the
type of application. Despite all these caveats, there is no hesitation that Phylogenomics is a powerful integrated
field that is raising key questions in the evolutionary history of several group of organisms and providing very
useful information, whether for biodiversity conservation or in agriculture, livestock, and biomedical matters.
Here, we presented the TOMM approach for phylogenomic analysis, which uses genome-wide protein-
coding sequences for a given group of organisms, gathering orthologous predicted proteomes between pairs
of desired taxa in order to build a single phylogram based on their median amino acid evolutionary distances.
This unsupervised approach was basically divided in two extensive steps, where the first consists of orthology
inference and the second is composed of steps to build a large pairwise amino acid distance matrix; this latter is
the novelty along the rational analysis for Phylogenomics.
Regarding the first step, as any other phylogenetic analysis, TOMM approach relies on inferring orthologs.
Reliable orthologs identification between genome sequences is challenged by how different evolutionary mecha-
nisms operate in different genomic regions. As surveyed and discussed e lsewhere74, there are several methods
for orthology inference, all presenting advantages and limitations, but the most common methods are based
on sequence similarity. Here, we used Reciprocal Smallest Distance (RSD) m ethod75, which is obtained from
Scientific Reports | (2021) 11:3791 | https://doi.org/10.1038/s41598-021-81926-w 11
Vol.:(0123456789)www.nature.com/scientificreports/
sequence similarity metrics within an evolutionary distance matrix. Also, RSD uniquely provides an amino acid
distance measure. Many different orthology inference methods were not evaluated during TOMM approach,
because our aim was not to test orthology detection performance, rather to perform a comprehensive phylog-
enomic analysis based on all pairwise orthologous pairs found inside a group.
Since there is no choice of gene families or genomic regions, as many phylogenomic studies ascribed them, we
denominate our approach as unsupervised and “total”. The originality of our phylogenomic analysis is related to
the second step of procedure, through the construction of a species matrix populated with evolutionary distance
measurements calculated in the previous step, rather than performing multiple sequence alignments. However,
sequence alignments were embedded during orthology detection. We assigned the “median” amino acid distance
between two taxa as a measurement to populate the species matrix and then building the phylogram, but by
testing other percentiles of distance measures, we observed that the TOMM approach has kept the robustness
of results about well-known phylogenetic relationships.
Possible criticisms concerned to our approach are i) the computational resources needed, because the RSD
method is computationally intensive, and it worsens for large genomes and ii) the customized programs to help
building the amino acid distance matrix are operational system-restricted (Windows Microsoft). The first step
is not feasible to common PC machines and it must be performed within HPC resources. However, with the
increasing availability of HPCs whether offered by public or private institutions and virtual machines as emula-
tors of computational systems, make these two concerns minor caveats. Another concern is related to sampling
taxa; the benefit of use the total predicted proteomes has a limitation in the number of publicly available organ-
isms with annotated genome sequences. Even though, we showed here that TOMM approach is applicable and
robust for wide range of taxa presenting distinct genome sizes and complexity, since we applied to Kinetoplastid
(9.5–58.7 Mb haploid genome size), hematophagous Diptera (137–1923 Mb haploid genome size), and Primates
(2487–3454 Mb haploid genome size). Its robustness was also verified when trees were generated from genomes
reduced randomly to 50% of their sizes, when very similar trees were obtained (Supplemental Fig. S4).
Finally, this approach was not only able to corroborate the main knowledge in phylogenetic relationships of
tested groups of organisms, but also to present novel branch topologies. We believe that our results with TOMM
should contribute to supporting and enriching the evolutionary insights to the field.
Methods
Sequence datasets. We used protein sequences of all protein-coding genes (proteome), deduced from a
complete genome for a given species, downloading data from Kinetoplasdida, Diptera, and Primates, as well as
other external organisms (Table 1, 2, 3).
The Kinetoplastid genomic sequences from 46 species were downloaded from NCBI (https://www.ncbi.nlm.
nih.gov/genome) or TriTrypDB (http://tritrypdb.org/tritrypdb/) databases, according to information provided
in Table 1. The protein sequences corresponding to coding sequences from a given Kinetoplastid genome were
downloaded when available. When protein sequences were not available, as the genes of these organisms do
not contain introns, we straightforwardly translated them in-house from genomic sequences by obtaining open
reading frames from six the translations using the EMBOSS t ool76 and adjusting the starting Methionine by
BLASTX to the Protozoa-RefSeq NCBI database. This information was specified in Table 1 at “protein sequence
source” column. Perkinsela sp. was used as outgroup.
For the hematophagous dipterans dataset, all protein sequences were downloaded from V ectorBase77 (https
ads) as specified in Table 2, except for Drosophila melanogaster, which was down-
://www.vector base. org/downlo
loaded from RefSeq NCBI database. Both the non-hematophagous flies, Musca domestica and D. melanogaster.
were used as related species.
For the Primates, we used annotated complete genomes of 25 species, including Homo sapiens. Mus musculus
(House mouse) and Tupaia chinensis (Chinese tree shrew) were used as an outgroup. All protein sequences of
the mammalians were downloaded from RefSeq Protein NCBI database (https://www.ncbi.nlm.nih.gov/refse
q/) (Table 3).
Data analyses. The TOMM pipeline was performed in several steps, as shown in Fig. 1. First, the protein
sequences were dereplicated, and then clustered at 99% identity. The centroids were saved using the Usearch pro-
gram version 9.078. Only downloaded protein sequences or translated protein-coding genomic sequences larger
than 50 amino acids were used in the subsequent analyses. To sample the proteome to 50% of its level, we used
the program Seqtk available at https://github.com/lh3/seqtk. Second, the proteomes from each of the down-
loaded genomes (or translated coding sequences in-house) were pairwise submitted to the program Reciprocal
Smallest Distance (RSD)75 to obtain a table of orthologs and their amino acid (aa) distances. The RSD algorithm
employs global sequence alignment by using ClustalW79 and maximum likelihood by using PAML80 to estimate
the amino acid substitutions. To build the matrix of median pairwise amino acid distances (AAD) from genome-
derived protein sequences, pairs of proteomes [the number of pairs is equal to (n2 – n)/2, where n = number
of species], for each taxonomic group used here, were submitted to the program RSD using the NIH Biowulf
cluster (https://hpc.nih.gov/systems/). For the Kinetoplastida and hematophagous Diptera, we used the RSD
settings of 0.001 for the blast e-value of acceptance, and the value of 0.8 for the minimum ratio of the smallest
sequence to the larger one. For Primates, the e-value of acceptance was 0.1. The RSD tables were sorted by their
AAD’s to obtain the desired percentile values of AAD. Matrices were constructed for specified percentile values.
These matrices were then submitted to the H clust81 and Pvclust82 packages into R version 3.5.283 to obtain phy-
lograms, after 10,000 bootstraps. The APE p ackage84 was used to export the trees (in Newick format), and these
were annotated using the MEGA 6 s oftware85. The approximately unbiased values of the nodes (expressed as α
values, where α = 1- P), as provided by Pvclust, were exported to a Newick file by modifying a function provided
Scientific Reports | (2021) 11:3791 | https://doi.org/10.1038/s41598-021-81926-w 12
Vol:.(1234567890)www.nature.com/scientificreports/
at https://stackoverfl ow.com/questions/22749634/how-to-append-bootstrapped-values-of-clusters-tree-nodes
-in-newick-format-in. The R script for these operations is shown in Supplemental File 1.
To compare the orthologs identified by RSD with those inferred by MCL algorithm, we used SonicParanoid. A
in-house script compiled the protein sequences of each ortholog pair in a fasta file, which in turn was submitted
to multiple sequence alignment (MSA) using C lustal57. Then, the amino acid divergence was calculated using the
MSA in a routine of the the Mega X package58, resulting in a SonicParanoid-based amino acid distance matrix.
To compare the orthologs detected by RSD with those of the TriTypDB database, searches were performed
using the TriTypDB database (https://tritr ypdb.org). For this, all genes of the species Endotrypanum monter-
ogeii, Leishmania aethiopica, Leishmania arabica, Leishmania enriettii, Leishmania tropica, Leishmania gerbilli,
Leishmania turanica, Leishmania tarentolae, Trypanosoma evansi, Trypanosoma vivax, Trypanosoma theileri,
Blechomonas ayalai and Crithidia fasciculata were compared in pairs using “Identify Genes based on Orthology
Phylogenetic Profile” tool, determined by the OrthoMCL algorithm86 under OrthoMCL-DB, yielding 78 pairwise
comparisons. For method comparison, intersections between RSD-derived and OrthoMCL-derived orthologs
were calculated using respective gene ID lists as input in custom Venn diagram tool available at http://bioin
formatics.psb.ugent.be/webtools/Venn/.
Customized In‑House programs to retrieve orthologous sequence from RSD. Three programs
were written in Visual Basic v6.0 to facilitate the step of orthologous identification in the pipeline. These are
named RSD-maker, Batcher, and RSD2Table. They are available for download at https://s3.amazonaws.com/
proj-bip-prod-publicread/transcriptome/Tomm/Tomm-executables.zip.
RSD-maker takes as input a list of FASTA file names and produces a tab-delimited list of all pairs of FASTA
files to be submitted to RSD. It can take also an additional list of FASTA pairs already processed, and in this case,
it outputs only the missing pairs. This is useful when an additional proteome is added after RSD has been run
on a group of sequences. The sequence pairs for each pairwise RSD comparison are then provided as input to
the program Batcher, which also takes as input the command line for the RSD program, such as “rsd_search -q
INPUT1 -subject-genome = INPUT2 -outfmt 1 -de 0.8 0.1 -o output/INPUT1-INPUT2-0.8_0.1.tbl”. Upon run-
ning the program, INPUT1 and INPUT2 will be substituted by the tab-delimited pair to produce a file containing
hundreds or thousands of commands as dictated by the number of pairs used as input (RSD resulting files). Such
resulting file is used to run simultaneously as a swarm in the NIH Biowulf HPC (High-Performance Comput-
ing; http://hpc.nih.gov). The RSD resulting files (Supplemental File 2, as compressed folders “RSD-Primates”,
“RSD-Flies”, RSD-kinetoplastids”) contain gene ID lists tabulated for INPUT1 species (first column) and INPUT2
(second column), they are then processed by the program RSD2Table. It takes as input the list of FASTA files as
well as a list of the RSD results, and the desired percentile value. It then sorts the RSD files in ascending order
of the AAD values and finds the AAD corresponding to the desired percentile. This program can also receive a
list of desired percentiles and then produces all matrices in a single run. In addition to the aa distance matrix of
the orthologs, it also produces a table indicating the number of ortholog pairs found by RSD. The matrices are
written as “table-10.tbl” or “table-50.tbl”, where 10 and 50 are the pre-determined percentiles. These matrices
can then be submitted to the program Batcher, that will take as INPUT1 the list of percentiles and the R script
shown in Supplemental File 1, to produce an output that can be pasted on the R console to produce the Pvclust
results and Newick file as described in the previous paragraph.
The main computationally intensive job for identification of orthologous sequences is the calculation of the
RSDs, which can take a few hours per CPU for the smaller Kinetoplastid genomes, to over one day for the larger
genomes such as from the Primates. For example, the 27 mammal species used in this work lead to 351 pairwise
comparisons, which could consume over one year of computational time for a single CPU. However, no more
than 4 GB of memory is needed per CPU, and the job can be easily parallelized on an HPC system, so the results
were obtained in approximately two days.
Data availability
The Supplemental File 2 is a compressed folder available in the Dryad repository at https: //doi.org/10.5061/dryad
.b1k526g, as well as all other supplemental data supporting the results of this article.
Received: 17 June 2020; Accepted: 5 January 2021
References
1. Pyron, R. A. Post-molecular systematics and the future of phylogenetics. Trends Ecol. Evol. 30, 384–389 (2015).
2. Nei, M. & Kumar, S. Molecular Evolution and Phylogenetics (Oxford University Press, Oxford, 2000).
3. Eisen, J. A. & Fraser, C. M. Phylogenomics: intersection of evolution and genomics. Science 300, 1706–1707 (2003).
4. Delsuc, F., Brinkmann, H. & Philippe, H. Phylogenomics and the reconstruction of the tree of life. Nat. Rev. Genet. 6, 361–375
(2005).
5. Bininda-Emonds, O. R. P. The evolution of supertrees. Trends Ecol. Evol. (Amst.) 19, 315–322 (2004).
6. Moore, B. R., Smith, S. A. & Donoghue, M. J. Increasing data transparency and estimating phylogenetic uncertainty in supertrees:
approaches using nonparametric bootstrapping. Syst. Biol. 55, 662–676 (2006).
7. McMahon, M. M., Sanderson, M. J. & Savolainan, V. Phylogenetic supermatrix analysis of GenBank sequences from 2228 papil-
ionoid legumes. Syst. Biol. 55, 818–836 (2006).
8. de Queiroz, A. & Gatesy, J. The supermatrix approach to systematics. Trends Ecol. Evol. 22, 34–41 (2007).
9. Philippe, H. et al. Pitfalls in supermatrix phylogenomics. Eur. J. Taxonomy 283, 1–25 (2017).
10. Smith, S. A., Beaulieu, J. M. & Donoghue, M. J. Mega-phylogeny approach for comparative biology: an alternative to supertree
and supermatrix approaches. BMC Evol. Biol. 9, 37 (2009).
Scientific Reports | (2021) 11:3791 | https://doi.org/10.1038/s41598-021-81926-w 13
Vol.:(0123456789)You can also read