Towards quantitative lightning forecasts with convective-scale Numerical Weather Prediction systems - WMO Library
←
→
Page content transcription
If your browser does not render page correctly, please read the page content below
Towards quantitative lightning forecasts
        with convective-scale
 Numerical Weather Prediction systems
                Olivier Caumont*
            CNRM (Météo-France, CNRS)

   * with contributions from Éric Defer (LA), Jean-Pierre Pinty
   (LA), Christophe Bovalo (CNRM), Christelle Barthe (LACy),
      Sylvain Coquillat (LA), and Dominique Lambert (LA)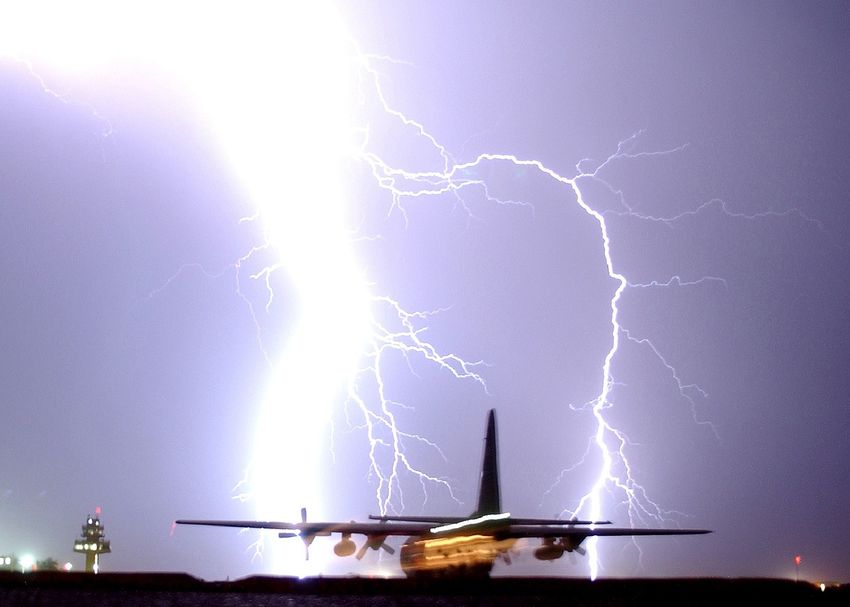
Outline
1. Introduction

2. Methodology & Results

3. Conclusion & Perspectives

                               2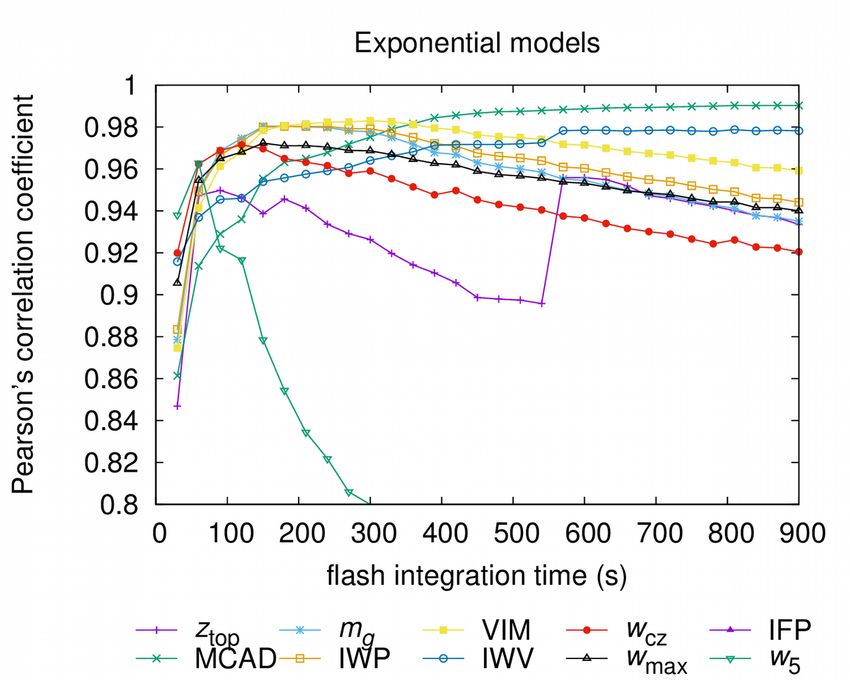
1. Introduction
Thunderstorms: a major threat to aviation
●
    Damaging hail,
                           → Need for thunderstorm
●
    Heavy precipitation,
                           detection and prediction
●
    Icing,
                           → Use lightning observations
●
    Turbulence,
                           to this purpose
●
    Wind shear,
●
    Lightning.

                                                     3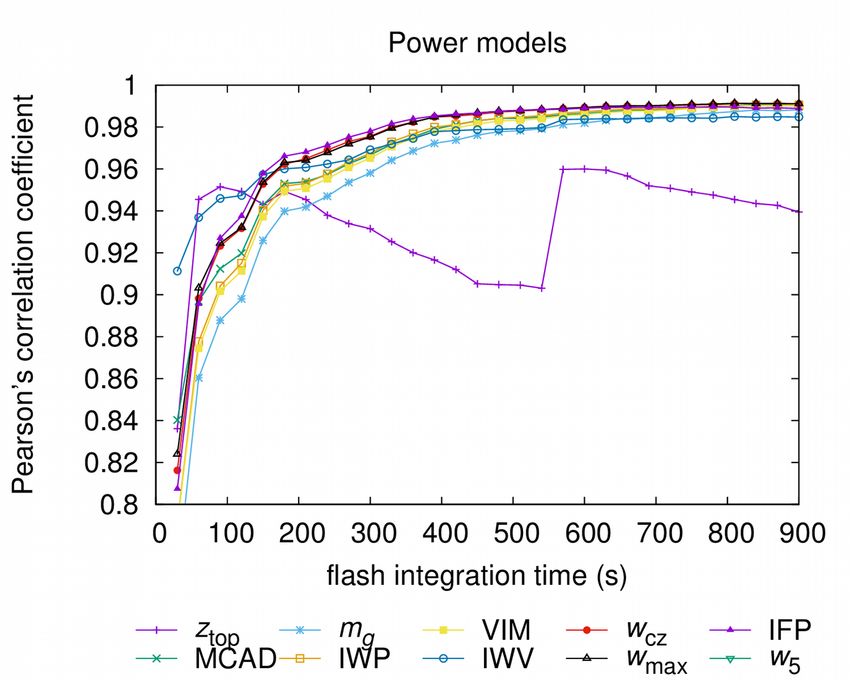
1. Introduction
The advent of km-scale NWP systems
●
    Examples: WRF (USA), LFM (Japan), UKV (UK),
    COSMO-DE (Germany), AROME (France), etc.
●
    Common features:
    –   Deep convection resolved,
    –   Increasing realism and accuracy,
    –   Advanced assimilation of regional data (from aircraft, satellites,
        ground-based weather stations and radars, balloons, etc.).

→ lightning usually not predicted and lightning
observations not assimilated.
                                                                             4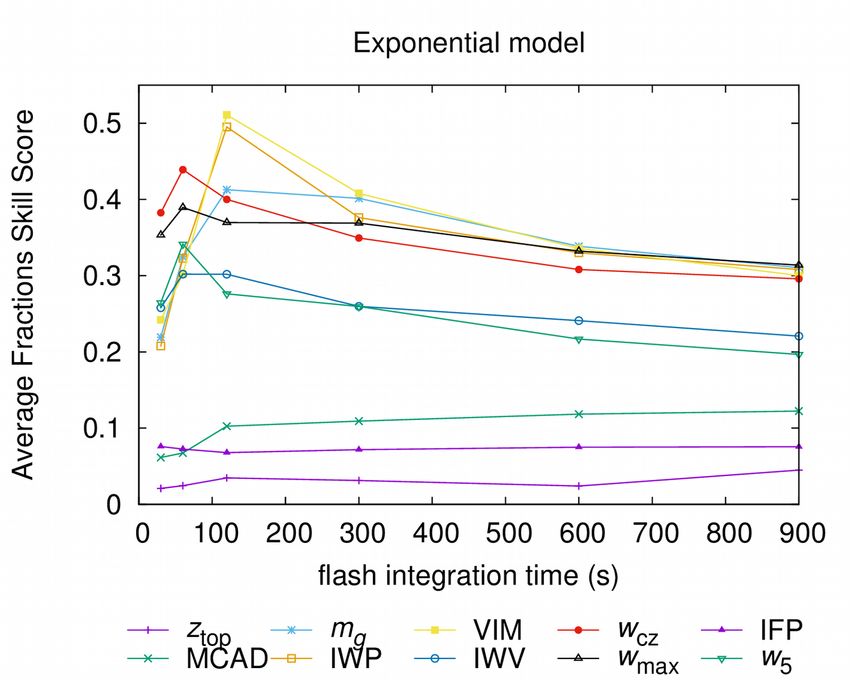
Lightning observation:         1. Introduction
The promise of GEO lightning imagers
●
    Lightning observation from geostationary orbits has started
    and will expand in the forthcoming years:
    –   The Geostationary Lightning Mapper (GLM) aboard GOES-R (USA) since Nov.
        2016,
    –   The Geostationary Lightning Imager (GLI) aboard FY-4 (China) since Nov. 2016,
    –   The Lightning Imager (LI) aboard MTG (EU) to be launched in 2021.
●
    Key advantages:
    –   Detection of total lightning = intra-cloud + cloud-to-ground flashes,
    –   Space-time coverage and resolution (wrt. lightning imagers aboard low-orbit
        satellites),
    –   Complement ground-based weather radars over sea and in mountainous
        regions.

                                                                                        5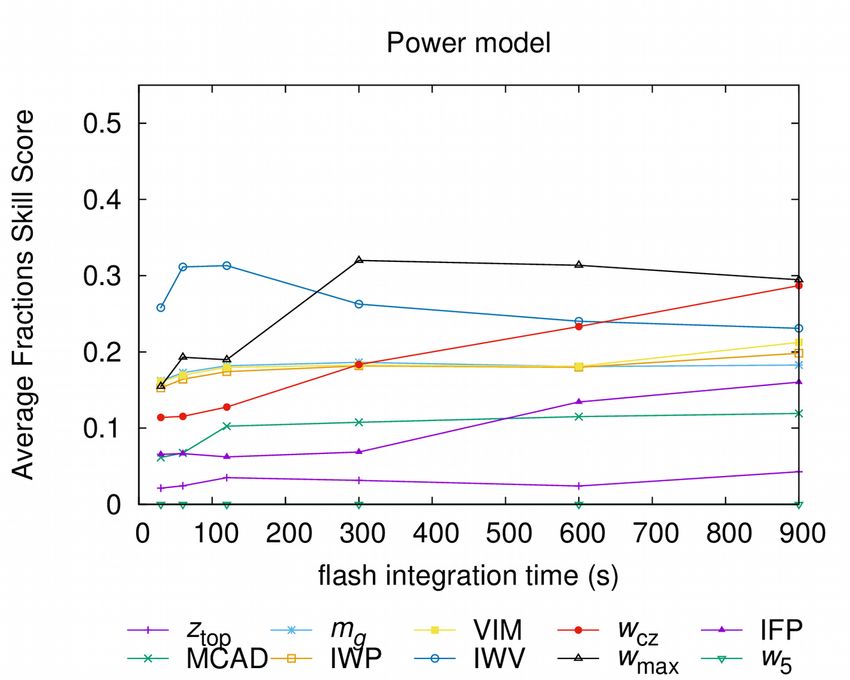
1. Introduction
The challenge of observation operators
●
    Simulating or assimilating lightning
    observation requires an observation operator
    = a tool that simulates the observation from
    model prognostic variables
●
    Difficulty:
    –   Lightning loosely related to model variables
        → Complex simulators that explicitly represent the
        lightning discharge exist but are numerically too
        expensive for real-time (= operational) applications.

                                                                 6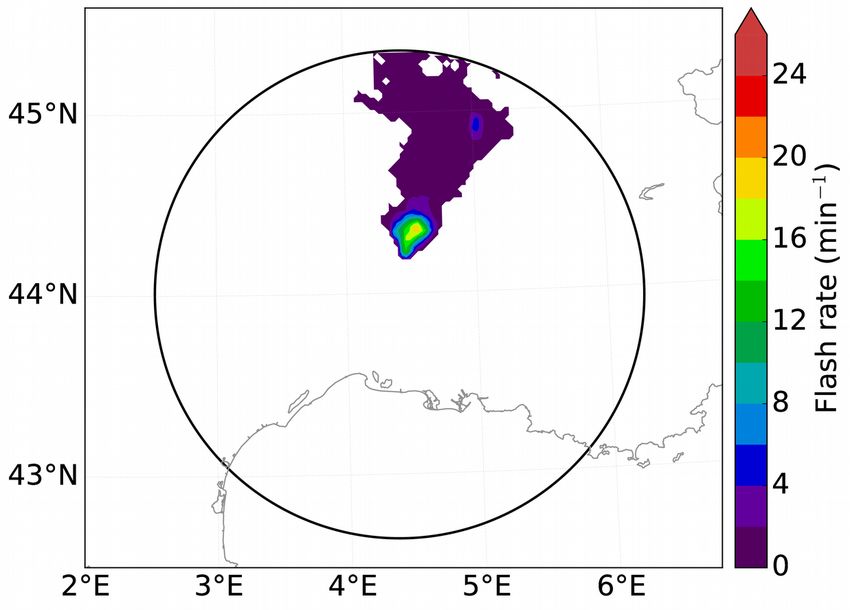
The challenge of evaluating                      1. Introduction
lightning simulations
●
    Conventional ‘point-to-point’ metrics suffer from the
    ‘double-penalty’ problem:

                                   (a-d) yield a Critical Success
                                   Index (CSI) of 0 while (e)
                                   yields CSI>0.
                                   → counter-intuitive result.

                                                                 7
    (from Davis et al. MWR 2006)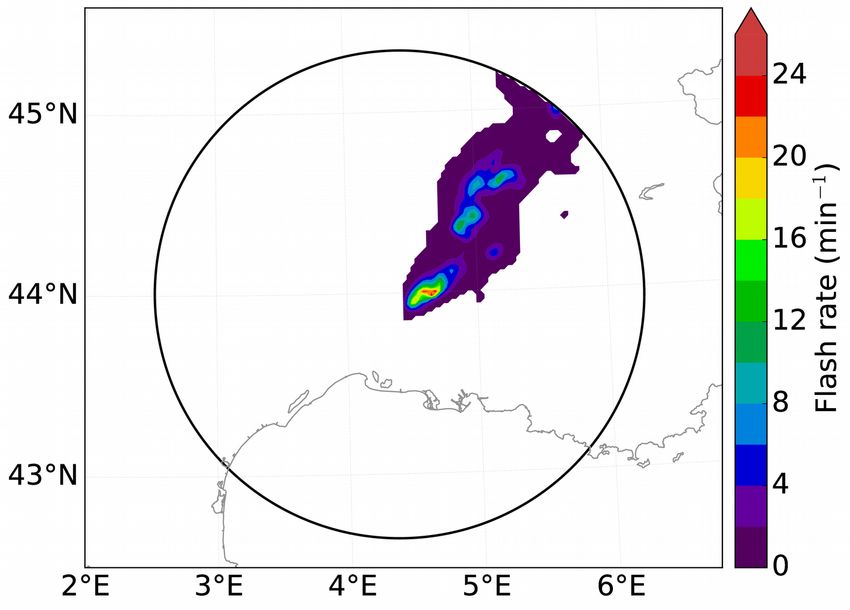
1. Introduction
Scientific questions
●
    How to simulate lightning from a convective-
    scale model for real-time applications?

●
    Which observation product does best match
    simulations?

●
    How to evaluate the match between lightning
    observations and simulations?
                                                     8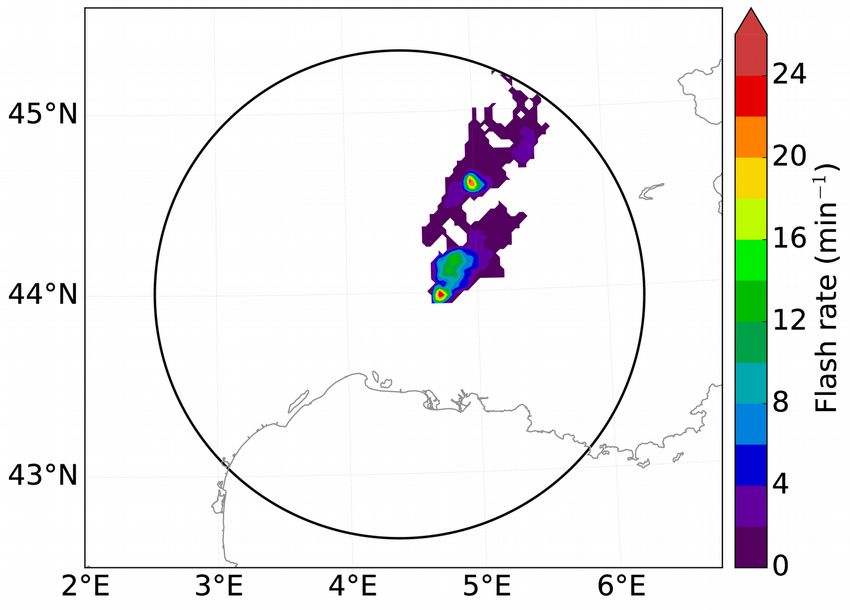
2. Methodology & Results
Overview of methodology
●
    Use available, high-quality observations of total lightning.
    → Lightning Mapping Array (LMA).

●
    Use efficient diagnostics to simulate lightning from model
    fields.
    → Proxies calibrated on a statistical basis.

●
    Evaluate proxies and flash integration times.
    → Based on metrics bypassing the ‘double penalty’ issue.

                                                                   9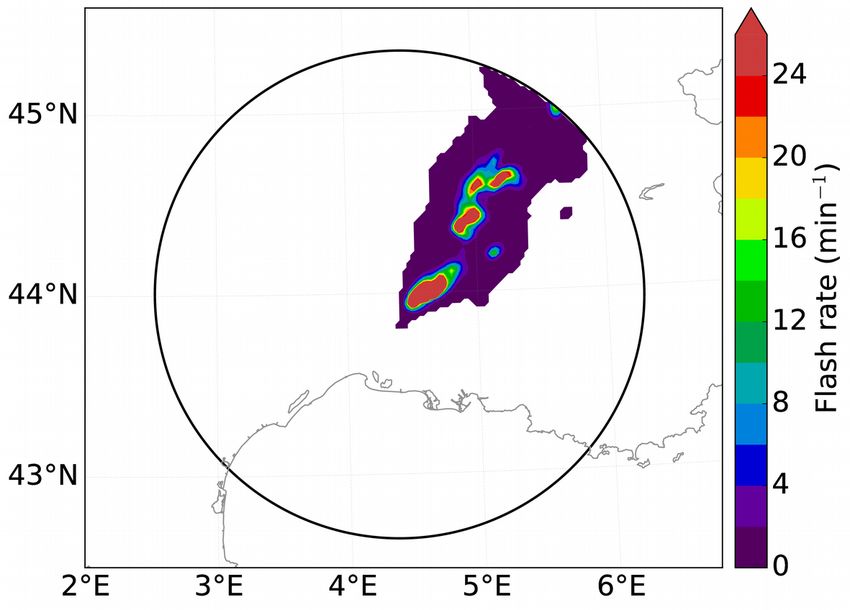
2. Methodology & Results
Model and Observations
●
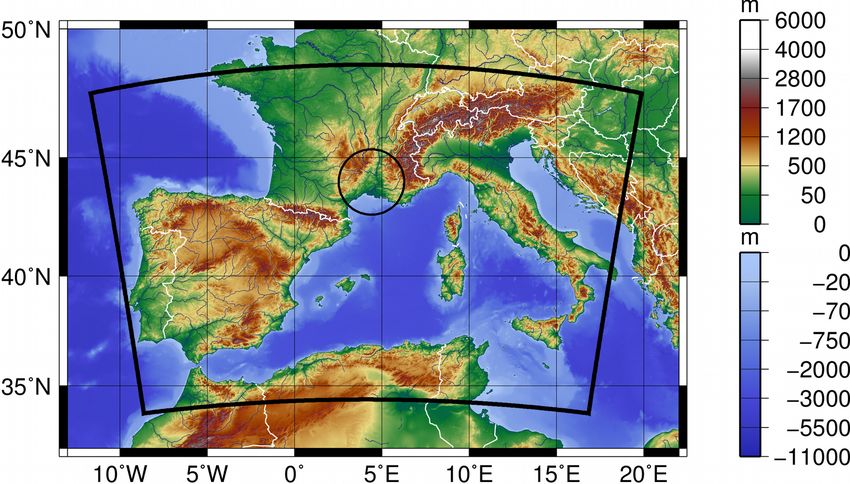
Model: Arome-WMed (2.5 km over western Mediterranean area) 3-h forecasts.
●
Observations: HyMeX LMA (HyLMA) VHF sources converted to flash extent data
on Arome-WMed grid. Maximum range = 150 km.
●
Period: Whole HyMeX SOP1 (1st September to 13 November 2012). 24-51
comparison times.
LMA flash rate observation (averaged
over 300 s) on 24 Sep 2012 03 UTC. 102. Methodology & Results
Proxies
ztop: cloud top height (Price and Rind JGR 1992)
height
●
● MCAD: Mass-Centre Altitude Difference between cloud ice and graupel
● mg: mass of graupel above -5°C (Deierling et al. JGR 2008)
● IWP: precipitation Ice Water Path above -10°C (Petersen et al. GRL 2005)
mass
● VIM: Vertically-integrated Ice Mass (McCaul et al. WAF 2009)
● IWV: Integrated Water Vapour
● wcz: vertical velocity at the base of the charging zone (Formenton et al. NHESS 2013)
velocity
● wmax: maximum updraft speed (Price and Rind JGR 1992)
● IFP: product of precipitating and non-precipitating fluxes at the top of the charging
zone (updraft with coexisting graupel, snow, and supercooled water) (Blyth et al. AR
flux
2001)
volume
● w5: updraft volume (w > 5 m/s) above -5°C (Deierling and Petersen JGR 2008) 112. Methodology & Results
Converting proxy into flash rate
●
Off-the-shelf relationships from the literature unsuitable:
- Different resolutions, different models, etc.
→ Calibration needed.
●
Calibration in past studies:
- Based on maximum value (McCaul et al. WAF 2009).
- Based on correlation coefficient between ‘matched’
storms (Barthe et al. JGR 2010).
→ Go a step further and match ‘climatological’ PDFs.
122. Methodology & Results
PDF matching
●
Proxy fields thresholded so that
number of simulated flash extent
data matches observations.
●
Regressions for whole SOP1:
linear, exponential, and power
models.
→ Linear models perform worst.
→ Exponential models perform
best at short integration times
(< 350 s).
→ Power models perform best at
long integration times (> 350 s).
Simulation of Lightning Observations — 013
13The need 2. Methodology & Results
for spatial evaluation
Flash rate on 24 Sep 2012 06 UTC
Arome-WMed flash rate (IWV). R = 0.98.
LMA flash rate observation
averaged over 900 s.
Arome-WMed flash rate (VIM). R =140.96.2. Methodology & Results
The Fractions Skill Score
●
Categorical score based on the Brier Skill
Score (Roberts and Lean MWR 2008; observation model
Roberts Met Apps 2008).
●
Accounts for scale and double penalty
issues.
●
FSS=1−
∑ ( P o−P m )
2
,
∑ P 2o + ∑ P 2m
where Po (Pm) is the fraction of observed
(model) pixels above threshold in a given
window.
●
Ranges from 0 (complete mismatch) to 1 (from Roberts and Lean MWR 2008)
(perfect match).
●
Here, it is averaged over all thresholds
and window lengths → AFSS.
152. Methodology & Results
Average Fractions Skill Scores
→ Exponential models better overall and especially for short integration times
(around 2 min).
→ Best proxies are those based on hydrometeor mass (mg, IWP, VIM) and vertical
velocity (wmax and wcz).
162. Methodology & Results
Illustration
Flash rate on 24 Sep 2012 06 UTC
LMA flash rate observation averaged over 120 s. Arome-WMed flash rate (VIM).
→ Similar distribution, location, and maximum values.
173. Conclusion & Perspectives
Summary and Outlook
●
Main results:
- A 2-step methodology to evaluate flash rate proxies.
- Best proxies: based on hydrometeor mass or vertical velocity.
- Best integration time: around 2 min.
●
Future work:
Sensitivity to:
- Horizontal resolution.
→ Towards satellite-based observations (~10 km).
- Flash sorting algorithm.
- Lightning detection instrument (LMA, LLS, optical like GLM and LI).
- Model, especially microphysical scheme.
→ LIMA (Vié et al. GMD 2016).
18Thank you
19You can also read