TUI GROUP INVESTOR PRESENTATION - May 2022
←
→
Page content transcription
If your browser does not render page correctly, please read the page content below

TUI GROUP
INVESTOR PRESENTATION
May 2022

FORWARD-LOOKING STATEMENTS
    This presentation contains a number of statements related to the
    future development of TUI. These statements are based both on
    assumptions and estimates. Although we are convinced that these
    future-related statements are realistic, we cannot guarantee them,
    for our assumptions involve risks and uncertainties which may give
    rise to situations in which the actual results differ substantially from
    the expected ones. The potential reasons for such differences
    include market fluctuations, the development of world market
    fluctuations, the development of world market commodity prices,
    the development of exchange rates or fundamental changes in the
    economic environment. TUI does not intend or assume any
    obligation to update any forward-looking statement to reflect
    events or circumstances after the date of these materials.

2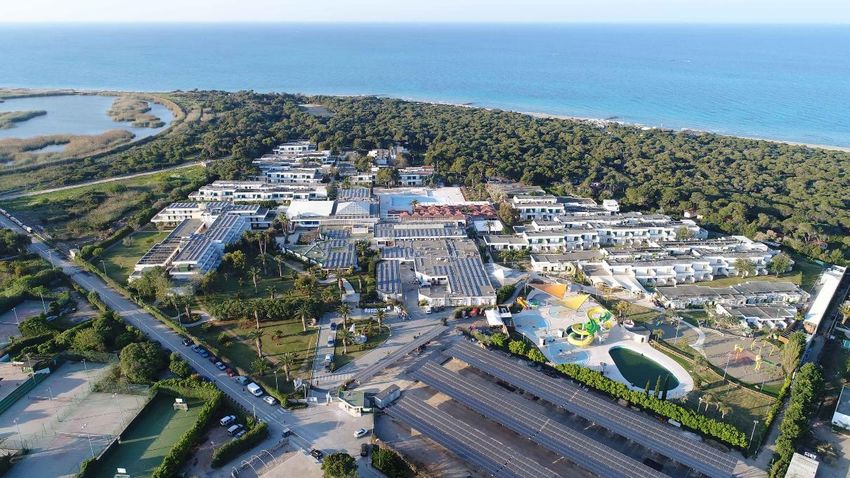
AGENDA

     1   TUI at a glance

     2   Recap FY22 Q2 Highlights

     3   FY22 Q2/H1 Results

     4   Mid-term ambitions & Strategic Summary

     5   Appendix

3
TUI Group at a glance – normalised levels pre C-19

                                              TUI GROUP                                                                                                 HOLIDAY EXPERIENCES (~70% EBIT2)

                         21m Customers1                                                                                                                           €452m                  Leading leisure hotel and club brands around
                                                                                                                                                                   EBIT                  the world; investments, operations, ownership

                                                                                                                                                                   €366m
                        €18.9bn Turnover                                                                                                                            EBIT Leading German & UK cruise brands

                                                                                                                                                                    €56m                 Tours, activities and service provider in
                       €893m EBIT / excl. MAX €1,186m EBIT2                                                                                                          EBIT                destination

                         15.5% ROIC / excl. MAX ~21%                                                     ROIC2                                             MARKETS & AIRLINES (~30% EBIT2)

                                                                                                                                                                   €425m2 Market leaders in packaged distribution, fulfilment,
                       ~71,500 Employees                                                                                                                            EBIT strong market and customer knowledge

4   * FY19 Results pre IFRS 16 adoption I 1 defined as our Markets & Airlines customers – excludes 7m customers from our joint ventures in Canada and Russia as well as direct and 3rd party distribution customers from our Hotels & Resorts
    and Cruise brands which would total 28m customers I 2 Excluding €293m cost impact of Boeing 737 MAX grounding in Markets & Airlines segment
TUI‘s unique and integrated business model continues to be the foundation
of our success
                    INTEGRATED BUSINESS MODEL
                                                                                                                                           •   Integrated business model with differentiated
      MARKETS & AIRLINES                                                     HOLIDAY EXPERIENCES                                               product and service offering along the whole
                                                                                                                                               value chain
            21m customers1                                                             413 Hotels2                                         •   Strong brand reputation with double
                                                                                                                                               diversification across source markets and
                                                                                                                                               destinations
            128 aircraft3                                                              16 Cruise ships3                                    •   Customer ownership: digitalised product
                                                                                                                                               upselling
            Omni-channel own &
            3rd party distribution                                                     “Things to do” in >120                              •   Strong yields and occupancies driven by
                                                                                       countries                                               access to broad customer base

                                                                                                                                           •   Pioneering ESG initiatives embedded across
                                                                                    DIFFERENTIATED                                             operations - enhancing the positive impact of
    STRONG CUSTOMER BASE
                                                                                       CONTENT                                                 tourism

             Integrated omni-channel business with diversified customer base and distribution power
                                      offering unique & exclusive products

5    1 FY19 normalised level pre C-19 I 2 Includes Group hotels and 3rd party concept hotels as at 31 March 2022 | 3 As of 31 March 2022
AGENDA

     1   TUI at a glance

     2   Recap FY22 Q2 Highlights

     3   FY22 Q2/H1 Results

     4   Mid-term ambitions & Strategic Summary

     5   Appendix

6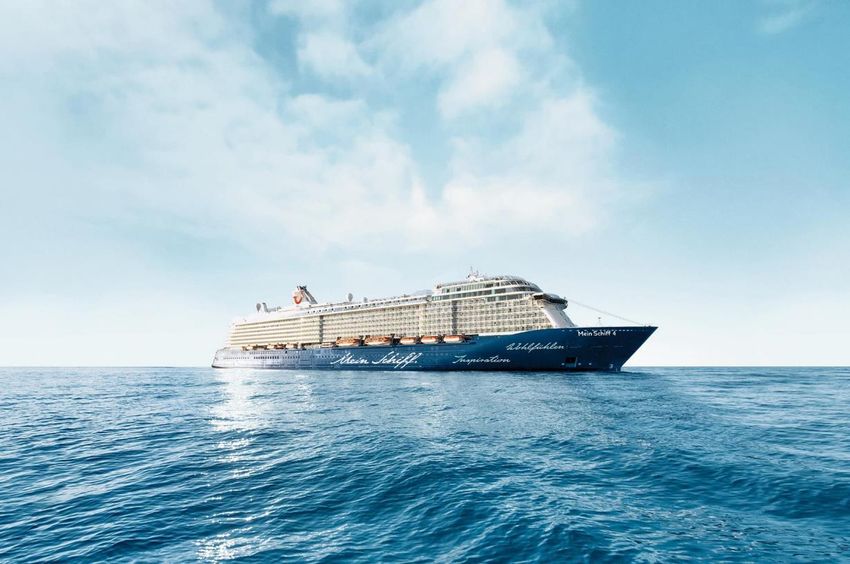
Strong recovery building through Q2, confident
     Summer 22 will be close to S19 levels
    FY22 Q2 delivering further operational and financial progress
        • 71% capacity of FY19 Q2 operated, ahead of mid-point of initial expectations

        • 1.9m customers departed in the quarter, +1.7m versus prior year, achieving 84%
          load factor

        • Q2 Und. EBIT loss of €330m, almost halving the prior Q2 (FY21 Q2: €633m
          loss)

        • Hotels & Resorts delivering a third successive positive quarter since start of
          the pandemic

        • Strong FCF generation of €1.2bn, improving +€2.0bn versus prior year, driven by
          strong inflow of working capital and operational ramp-up

        • Post first hand-back of €0.7bn of German state support in April, liquidity
          position remains strong at €3.8bn as of 6 May

    SUMMER 22 - positive bookings momentum continues
        • Bookings in the last 6 weeks firmly surpassing 2019 levels with UK S22 bookings
          11% ahead of S19

        • After two years of turbulence, we expect to return to significantly positive
          Und. EBIT1 and remain committed to reducing debt and German government
          exposure further
7
    1 Refer to page 29 footnote 1
Omicron-related travel restrictions eased throughout the quarter…

 Nov
                           January                                  February                                               March
  &
               7th UK                                    11th UK                                          7th Belgium       18th UK removes all
 Dec           Replaces PCR testing with lateral         Removes lateral flow               24th Russia   Relax national    remaining travel
               flows & pre – departure. tests            testing requirement           invades Ukraine    restrictions      restrictions

Omicron-                 9th-21st Germany                                 15th Netherlands                3rd Germany
related                  adds >90 countries to “high-                     removes all Covid               Removes all countries
restrictions             risk” list                                       restrictions                    from “high-risk” list
introduced

                                                                      Q2 Impact
                         Hotels - resilient occupancy and                             Markets & Airlines - Omicron restrictions
                         increasing average daily rates                               impacted near-term departures and increased
                         driven by benefit of integration                             short-term cancellations

                         Cruise - reduced to 8 ships in operation                     •   Nordics departures subdued due to
                         out of 16 in January due to port                                 restricted long-haul destinations
                         closures. As of April, all 16 ships have                     •   Key markets largely unaffected by war in
                         resumed services                                                 Ukraine (only Nordics and Poland subdued)

  8
… leading to a strong operational recovery in the second half of Q2, with
  underlying EBIT almost halving

                               Hotel & Resorts                                                    Cruise
                      (Available bednights & Occupancy %)                          (Available Passenger days & Occupancy %)

            Benefits of integration and strong brands, driving a third    Performance impacted by destination port closures,
            consecutive quarter of positive EBIT contribution             limiting itineraries in Jan & Feb and overall result for
                                                                          Cruise in Q2

Capacity    FY22 Q2       JAN         FEB          MAR          APRe     FY22 Q2        JAN          FEB          MAR          APRe

% of 2019    91%         91%          90%          91%         ~ 90%       71%          59%          70%          81%         ~ 90%

% of 2021    163%                                                         297%

             6.9m                                                         1,631k
                                                   2.5m        ~ 2.8m                                             686k         ~ 750k
                         2.3m         2.1m
                                                                                        440k         506k

 Occ. %      65%         56%          66%          72%         ~ 75%     29-53%        25-56%       26-51%      34-58%        ~ 50-60%

  9
Returning consumer confidence in departure clearly evident in March and
  April with ramp up gaining momentum

                                 TUI Musement                                             Markets & Airlines
                                 (Excursions sold)                                     (Departed Pax & Load Factor %)

            Continues to benefit from increased integration and            Solid ramp up of operations in March & April in line with
            digitalisation – halving Q2 losses on prior year               returning consumer confidence in departure – overall Q2
                                                                           EBIT improved by €168m YoY

            FY22 Q2       JAN          FEB           MAR           APRe    FY22 Q2      JAN          FEB          MAR          APRe

% of 2019    70%         60%           70%           80%          ~ 105%    66%         56%          67%          75%         ~ 80%

% of 2021   1,037%                                                         1,172%

             681k                                                          1,857k
                                                                  ~ 450k                                                     ~ 1,100k
                                                     282k                                                         771k
                          184k         216k                                             484k         603k

  Load                                                                      84%         71%          91%          89%         ~ 90%
Factor %

 10
11m bookings across both seasons – Winter closed out in line with
expectations – L6W of S22 firmly surpassing S19 levels
S22 Net weekly bookings as % of S19 Versus 2018/19 W21/22 S22
BOOKINGS1 -34% -15%
+13%pts +13% +20%
ASP
Short-term impact from Ukraine, Holding up strongly Holding up strongly
L6W trending above S19 levels 115% Closed out ~mid-point of
Close to normalised
CAPACITY between 60%-80%, in line
S19 levels
100% with expectations
∑ 85%
∑ 72%
W21/22 S22
~5m bookings added across both
seasons since last update
50% TOTAL NET
7,644
BOOKINGS1
(K)
3,320 3,522
2,508
0
30 Jan 27 Feb 3 Apr 8 May 8 May
30 Jan 1 May 30 Jan 8 May
Net weekly as % of S19 Cumulative as % of S19
11 1 Bookings up to 8 May 2022 compared to Summer 2019 programme (undistorted by C-19), relate to all customers whether risk or non-risk and includes amendments and voucher re-bookingsS22 Net monthly bookings as % of S19 by market
UK Nordics Germany
41% of booked position 3% of booked position 28% of booked position
135%
S22 +11% cumulative
98%
100% 100% 100%
65%
0 0 0
JAN FEB MAR APR JAN FEB MAR APR JAN FEB MAR APR
Netherlands Belgium
9% of booked position 10% of booked position
127%
97%
100% 100%
0 0
JAN FEB MAR APR JAN FEB MAR APR
We are confident Summer 22 will be close to Summer 19 levels
12TUI UK & GERMANY #1 brand of choice according to recent share of traffic
DIRECT WEB VISITS
JANUARY TO MARCH 20221
UK GERMANY
10% 7%
7%
16% 2
45%
28% 59%
28%
TUI Comp.A Comp.B Comp.C
TUI’S STRONG BRAND APPEAL IS EVIDENT IN UK & GERMAN WEB TRAFFIC
13
13 1 Source: Similarweb web traffic panel service, Ave. Share % | 2 o/w TUI.co.uk 40% and Firstchoice.co.uk 5%Summer 22: Our diversified and integrated model continues to be a clear
advantage for the Holiday Experiences segment
CURRENT TRADING ENVIRONMENT
HOTELS & • Expect the Canaries, Balearics, Greece and Turkey to be key summer destinations for both Markets & Airlines
RESORTS and third-party customers
• We expect occupancies and average rates to develop strongly through H2 and the short-term booking
environment to contribute significantly to a strong Summer
• Mein Schiff & Hapag-Lloyd Cruises – operating full fleet of 12 ships as of April, resuming itineraries in the
CRUISE Western and Eastern Mediterranean and around the world
• Marella Cruises operating full fleet of 4 ships from April, in the Canaries and the Caribbean
• Cruise recovery is expected to be slower, with short-term bookings continuing to represent a large share of
overall bookings. We see H2 calendar year building steadily. Bookings are currently trending at higher rates
for all three cruise brands
TUI MUSEMENT • We expect EATs to develop beyond the capacity assumptions of Markets & Airlines for Summer 22, as third-
party sales return, across global cities and sun & beach destinations, in line with a more normalised pre-
pandemic travel environment
14 EAT Excursions, activities & toursOur integrated model with its strong distribution power
is a success factor in every market environment
SHARE OF CUSTOMERS TO TUI HOTELS & RESORTS
UK GERMANY
+5%pts
+2%pts
24% 27%
22% 21%
S19 S22 S19 S22
• During the C-19 pandemic, we took advantage of our distribution power of ~21m1 customers across our
diverse source markets to increase share of customers to our own hotels
• Our customers benefit from the attractive portfolio of hotel destinations - 30% of our hotel beds are
located in the Caribbean and 21% in the Western Mediterranean (with 93% rated in the 4-5* category)2
• Enabling stronger yields, occupancies and higher NPS/CQS as a result
15
15
1 As of FY19 | 2 As of FY21Outperformance of occupancy and rates driven by
our ability to steer our broad Markets & Airlines
customer base
Base occupancy achievable due to distribution power of our differing
source markets
FY19 Q41 FY20 Q41 FY21 Q41
88
66 63
Room 49 44
occupancy 29
(in %)2
TUI H&R Leisure TUI H&R Leisure TUI H&R Leisure
Peer Peer Peer
147 161
142
107 122
Avg. rate 103
per room
(in
€/night)3
TUI H&R Leisure TUI H&R Leisure TUI H&R Leisure
Peer Peer Peer
129
Figures excluding Blue Diamond 101
1 TUI’s Financial Q4; period of July to September Revenue
2 Occupied rooms divided by capacity (Group owned or leased hotel rooms per 71 70
multiplied by opening days per quarter) available 53
3 Arrangement revenue divided by occupied rooms
room 29
4 Arrangement revenue divided by capacity (Group owned or leased hotel
rooms multiplied by opening days per quarter) (in €)4
16
16 TUI H&R Leisure TUI H&R Leisure TUI H&R Leisure
Peer Peer PeerOur leisure hotel brand TUI Blue will drive
further asset-light growth
MANAGED AND FRANCHISE PARTNERINGS
We are empowering hotel partners with deep customer insights and smart
technology to create enriching, personalised experiences to achieve peak
performance
BUILDING REGIONS
We are heading afield from our euro-centric success to stretch into new
destinations
GENERATING VOLUME THROUGH ASSET-LIGHT OWNERSHIP MODEL
We have ambitious goals to grow our portfolio of ~100 TUI Blue hotels as a leading
leisure hotel brand to 300+ hotels by 2031
INCREMENTAL HOTEL GROWTH THROUGH MANAGED AND
FRANCHISED STRUCTURES
17
17TUI Musement
Leveraging our scale, expanding strategic B2B partnerships and into new
markets
• Digital first sales mix supported by
state-of-the-art CRM and personalized
DIGITAL FIRST recommendations
SALES • Selling to non-package TUI customers Total EATs
(flight only, accom only, overland) across
both sun & beach and city portfolio FY18 H1 FY22 H1
1,734k
B2B STRATEGIC
PARTNERSHIPS 1,242k 30%
+25%pts
5%
95% 70%
TUI core markets (= support brand stretch)
NEW TUI
CUSTOMERS & TUI 3rd Party
MARKETS
New markets (= international growth)
18 EAT Excursions, activities & toursAGENDA
1 TUI at a glance
2 Recap FY22 Q2 Highlights
3 FY22 Q2/H1 Results
4 Mid-term ambitions & Strategic Summary
5 Appendix
19Income Statement – Q2 Und. EBIT loss of €330m, almost halving versus
prior year
REVENUE
• Q2 Revenue of €2.1bn, up €1.9bn YoY, reflecting the more normalised pre-
In €m (IFRS 16) FY22 Q2 FY21 Q2 FY22 H1 FY21 H1 pandemic travel environment versus prior year and ramp-up of operations
after a more subdued January and February post Omicron restrictions
Revenue 2,128 248 4,498 716
Underlying EBITDA -123 -398 -188 -856
UNDERLYING EBIT(DA)
Depreciation & Amortisation -207 -235 -415 -453 • Q2 EBIT loss reduced by €303m to -€330m, with all segments seeing
Underlying EBIT -330 -633 -603 -1,309 improved results and Cruise expecting a later recovery. Hotels & Resorts
delivered a third consecutive quarter of positive EBIT
Adjustments (SDI's and PPA) -13 33 -11 10
• Depreciation reduced by c. €28m YoY due to one-off impairments booked
EBIT -343 -600 -614 -1,299 in the prior year
Net interest expense -123 -136 -257 -245
EBT -467 -737 -871 -1,544 ADJUSTMENTS
Income taxes 145 29 163 46 • Adjustments includes restructuring costs related to the Global Realignment
Programme (mostly airline). Prior year includes provision release relating to
Group result cont. operations -321 -708 -708 -1,498 lower restructuring requirements
Minority interest -14 13 -12 23 • FY22 assumption: range between -€90m and -€110m unchanged
Group result after minorities -336 -695 -720 -1,475
NET INTEREST
Basic EPS (€) -0.21 -0.67 -0.47 -1.82
• YoY improvement (+€13m) lower than for cash interest (~+€30m YoY
improvement) due to accounting treatment of partial early repayment of
WSF Bond with warrant and accrued interest on the convertible bonds
issued during H2 FY21
20 • FY22 assumption: range between -€380m and -€425m unchangedQ2 – All segments seeing improved results with Cruise expecting a later
recovery. Hotels & Resorts delivered a third consecutive positive EBIT
HOLIDAY EXPERIENCES MARKETS & AIRLINES
FY22 Q2 FY21 Q2 FY22 Q2 FY21 Q2
24
Q2 YoY Q2 YoY
Und. EBIT €m
Und. EBIT €m
HOTELS & Occ. Bednights: 4.5m +191% NORTHERN Departed pax: 0.8m n.m.
RESORTS Occupancy: 65% +29%pts REGION
Load Factor: 83%
Ave. Rate: €86 +€17
-102 -181
-221
Und. EBIT €m
Und. EBIT €m
Q2 YoY Q2 YoY
CENTRAL -21 Departed Pax: 0.5m +502%
CRUISE Ach. Pax Days 0.8m +338% REGION
-55 Load Factor: 87%
-74 Occupancies: 29% to 53%
-123
Und. EBIT €m
Und. EBIT €m
Q2 YoY Q2 YoY
-17 -29
TUI # EAT sold: 0.7m +937% WESTERN Departed Pax: 0.6m +782%
MUSEMENT REGION
# Transfers: 2.5m +848% Load Factor: 84%
-57
-83
21Q2 result – Significant improvement year on year due to increased level of
operations
FY21 Q2 vs. FY22 Q2 UNDERLYING EBIT IN €M
-330
Holiday Experiences: +€120m
• Hotels & Resorts 4.5m occ. bednights, up 3.0m YoY (+191%) and
occupancy 65%, up 29%pts, with all key destinations improving.
Also includes impact of PY impairments of +€10m.
15
-633 • Cruises 0.8m ach. passenger days overall, up 0.6m YoY (+338%)
• TUI Musement 0.7m EAT sold, up 0.6m YoY (+937%) and 2.5m Markets & Airlines +€168m
transfers operated, up 2.2m YoY (+848%) • Departed pax of 1.9m, up 1.7m vs FY21 Q2; 84%
168 load factor achieved
• Early part of Q2 impacted by Omicron restrictions,
however softening of restrictions saw improved
performance in second half of Q2
-19 13 • Result also includes €50m Covid costs compensation
from German State (Central Region benefit), net YoY
126 impact of Fuel Hedge Ineffectiveness of +€18m and
PY impairments of +€13m.
FY21 Q2 Hotels & Cruises TUI Musement Markets & Airlines AOS FY22 Q2
Und. EBIT Resorts Und. EBIT
22Q2 Cash flow driven by significant WC inflow from customer bookings
WORKING CAPITAL
In €m (IFRS 16) FY22 Q2 FY21 Q2 FY22 H1 FY21 H1
• Inflow driven by increase in customer deposits as a result of strong bookings and
Underlying EBITDA -123 -398 -188 -856 pricing development
Adjustments -7 42 3 25
Reported EBITDA -130 -357 -185 -832 OTHER CASH EFFECTS
Working capital 1,561 -307 624 -707 • YoY improvement mainly driven by lower reversal of non-cash P&L hedging effects
Other cash effects -19 -116 41 -52
At equity income 33 53 36 157 CASH INTEREST
Dividends received (JV's, associates) - 5 - 10 • YoY improvement in cash interest due to significantly reduced RCF drawings
Tax paid -4 3 -10 -5
Interest (cash) -78 -107 -171 -214
NET INVESTMENTS
Pension contribution & payments -39 -23 -68 -51
• YoY increase driven by prior year sale & leaseback financings
Operating Cash flow 1,325 -848 266 -1,693
• Low cash-out for capex in line with prior year due to continuous strict capex
Net Investments -83 61 -137 108 management
Free Cash flow 1,242 -787 129 -1,585 • FY22 assumption: expect upper end of cash outflow range of between -€120m to
Dividends - - - - -€280m
Free Cash flow after Dividends 1,242 -787 129 -1,585
Cash flow from financing -1,361 905 -189 1,730 FCF AFTER DIVIDENDS/ TOTAL CASH FLOW
1
o/w inflow from fin. instruments 16 1,374 1,125 2,334 • Largely driven by strong working capital inflow
o/w outflow from fin. instruments2 -1,377 -469 -1,314 -604 • Total cash flow of -€120m driven by outflow from financing of ~€1.4bn, o/w
~€1.2bn from reduction of RCF drawings; remainder reflects principal lease
Total Cash Flow -120 118 -60 145
payments
23 1 From the issue of bonds, commercial paper, equity instruments and drawings from other financial facilities | 2 For redemption of loans, commercial paper and other financial liabilitiesStrong liquidity position of €3.8bn1 post €0.7bn government hand-back
SUMMARY – LIQUIDITY DEVELOPMENT • ~ €0.7bn first step in handing back
government funding completed in April
€bn 2022
Cash & avail. fac. 3 February 2022 ~ 3.3 o €170m KfW and private banks secured
RCF
Cash inflow February, March, April, May ~ +1.2
o €91m bond portion of the €150m WSF
Hand-back of government funding – April ~ -0.7 Bond with warrant; warrant of €59m
remains in place
Cash & avail. fac. 6 May 2022 ~ 3.8 o €414m KfW unsecured RCF
Strong liquidity position will continue to build into the Summer before we enter typical
seasonal swing for Winter
24 1 Available liquidity position defined as available cash plus committed lines including financing packages as of 6 May 2022Strong reduction in net debt by €1.1bn to €3.9bn
FY22 Q1 to FY22 H1
In €m FY22 H1 FY22 Q1 In €m FY22 H1 FY22 Q1
IFRS 16 IFRS 16 QoQ ∆ IFRS 16 IFRS 16 QoQ ∆
Opening net debt as at 1 October -4,954 -4,954 - Financial liabilities -5,572 -6,837 1,264
FCF after Dividends 129 -1,112 1,242 - Lease liabilities under IFRS16 -3,146 -3,260 114
Asset Finance -139 -104 -35 - Bond with warrant -149 -124 -25
Capital Increase 1,106 1,107 0 - Convertible Bond -527 -517 -10
Other -80 -5 -75 - Liabilities to banks -1,685 -2,870 1,185
Discontinued operations - Nordotel 2 - 2 - Other liabilities -65 -65 -
Closing Net Debt -3,936 -5,070 1,134 Cash & Bank Deposits 1,636 1,767 -131
Net debt -3,936 -5,070 1,134
COMMENTS - Net Pension Obligation -551 -700 149
• SP11 and SP21 are classified as equity & dividends will be paid on the basis Memo: Lease liabilities - Aircraft -2,345 -2,419 74
of the drawn participations2. - Hotels -333 -348 15
• As at 31/03/22: - Ships -161 -167 6
o SP1 - €420m fully drawn - Other -307 -326 18
o SP2 - €671m fully drawn
o Cash RCF - €0.9bn of €1.5bn utilised Memo: Liabilities to banks - RCF -948 -2,151 1,203
o KfW RCF - €0.0bn of €3.0bn utilised - of which Cash3 -956 -1,509 558
• Post balance sheet date 6/05/22: - of which KfW 3
- -650 654
o Cash RCF - €0.7bn of €1.5bn utilised - SSD -427 -427 -
o KfW RCF - €0.0bn of €2.4bn utilised - Asset Financing -311 -293 -18
1 WSF Silent Participation – as agreed as part of third support package 2 Timing of the payment will be at the discretion of TUI AG. Any unpaid dividend has to be paid on termination or conversion of a silent participation at the latest; General comment: Gross
25 debt is defined as financial liabilities plus net pension obligation | 3 RCF detailed split includes cost of issuance and accrued interest costs amounting to ~€8m in H1 and €8m in Q1Reiterate capital structure development & ongoing priorities
GENERATE DRIVE OPERATING OPTIMISE
CASH FLOW EFFECTIVENESS FINANCING
• Continue with strict cash discipline • Lowered and continue to optimise • Maximise de-lever opportunities,
• Manage working capital flow back (fixed) capacity including new capital authorisations
• Deliver Global Realignment sought as part of 2022 AGM agenda
• Disciplined CAPEX management
Programme, further ~20% to be • Continue reduction of debt and
• Focus on asset-right strategy e.g. delivered by end FY22 German government exposure thus
initiation of hotel fund optimising interest expenses using
• Drive digitalisation & enhance quality
both organic cash and any
• Return to growth – expand dynamic generated proceeds
packaging
• Continuous improvement of credit
rating
Solid & healthy balance sheet – target return to gross leverage ratio1 of less than 3.0x
26 1 Defined as gross debt (Financial liabilities incl. lease liabilities & net pension obligation) divided by underlying EBITDA/RFurther progress with successful €0.4bn Capital Increase to accelerate
repayment of Corona state aid
Transaction Overview Summary - German government facilities
€bn 4.3
Transaction 162.3m shares issued via non-preemptive capital raise -0.2
KfW RCF (secured) 0.2
Structure of 10% utilising TUI AG’s existing capital authorisations -0.4 -0.1 3.6 KfW RCF drawing
0 -0.3
(6th May): €0.0bn
-0.7
-0.7 2.6
Proceeds €425m gross proceeds raised at €2.62 per share KfW RCF 2.9
2.4 -1.0
Proceeds and existing cash resources will be used to 2.1
further reduce interest costs and German government Warrant bond 0.2 0.1
funding: SP II 0.7 0.7
Use of 0.1
• Repaying in full the €671m Silent Participation II, SP I 0.4 0.4 0.4
proceeds saving c.€40m p.a. of net interest costs Total support 1st exit package Current 2nd agreed Pro-forma
• Reducing the outstanding KfW RCF by €336m to April 22 position exit package remaining
€2.1bn position
TUI agrees to further hand-back Corona state aid of €1bn and remains committed to reducing
debt and German government exposure
27 * For further details please refer to ad hoc notification as published on 17th May 2022AGENDA
1 TUI at a glance
2 Recap FY22 Q2 Highlights
3 FY22 Q2/H1 Results
4 Mid-term ambitions & Strategic Summary
5 Appendix
28Our priorities to transform TUI into a digital platform company enables
the delivery of our mid-term ambitions
POCKETS OF FUTURE GROWTH
Growth through asset- Execute Global
Expand tours & activity Drive digitalisation &
right financing Realignment
segment dynamic packaging
structures Programme
LEADING THE WAY TO
OUR FY22 ASSUMPTIONS OUR MID-TERM AMBITIONS
➢ S22 capacity of close to normalised S19 levels ➢ Und. EBIT to significantly build on FY192, driven by
➢ After two years of turbulence, expect return to both top line growth & GRP3 benefits
significantly positive Und. EBIT1 ➢ Return to a gross leverage ratio4 of less than 3.0x
1 In view of the ongoing COVID-19 pandemic and the war in Ukraine, the assumptions for underlying EBIT are subject to considerable uncertainty. The greatest area of uncertainty will be the impact on consumer confidence, should travel restrictions be
reintroduced, should there be further cost inflation volatility and/or an escalation of the war in Ukraine | 2 FY19A Underlying EBIT of €893m excluding €293m Boeing MAX cost impact | 3 Global Realignment Programme | 4 Defined as gross debt (Financial
29 liabilities incl. lease liabilities & net pension obligation) divided by underlying EBITDA/RAPPENDIX
TUI Group – ESG as a solid foundation for creating value

             … 2015                                                                                 … 2020                      AGENDA 2050

                               ESG ACHIEVEMENTS                                                                                                      We will innovate for a
                                                                                                                                                     more sustainable future
                                CARBON EFFICIENCY IMPROVEMENTS*                                           GOVERNANCE                                 for the tourism industry
                                                                                                                      Integrity Passport             and partner with others
                                                                                                                      Supplier Code of Conduct       to accelerate progress
     We are mindful of                                                                                                Global Employment Statement
     the importance of
     travel and tourism
                              -13.6%                    -5.2%                       -3.6%                             Group-wide crisis management
                              Cruises                   Hotels                      Airlines
     for many countries
     in the world and                                                                                                                                We will boost the positive
                               GROWTH IN SUSTAINABLE HOLIDAYS*                                             SOCIAL                                    impacts of our industry
     people living there.
                                                                                                                                                     and empower a
     We partner with                                                                                                                                 generation of
     these countries                                                                                                                                 sustainability
     and help shape
                            43m                    1,688                       257m                    Upskilling:                                   change makers
                            Greener & fairer       Sustainability              Single-use plastic      Learning Lounge &
     their future –         holidays delivered     certified hotels            items removed           Online Academies
     in a committed
     and sustainable                                                                                                                                 We will achieve net-zero
     manner.                                                                                                                                         emissions within
                                                                                                                                                     our own operations
     Think Travel.          83%                      5m                        €39m                    29%                                           and become a circular
     Think TUI.             TUI Hotels & Resorts Excursions with a             Invested to enhance     women in managerial                           business
                            sustainability certified focus on sustainability   positive impacts        positions

31
TUI leading sustainability
Ranked No.1 + No.41
for carbon-efficiency
Rhodes first sustainable destination in
public private partnership
83% of Hotels & Resorts
GSTC certified2
Most modern
fleet
32 1 atmosfair Airline Index 2018 England and Germany | 2 Pre-crisis year 2019, % of TUI Hotels & Resorts achieving Global Sustainable Tourism Council (GSTC) recognised certificationsTUI Cruises
Reduction of Food Waste: As part of a pilot project, TUI
Cruises carried out a waste analysis on board Mein Schiff
4 and subsequently tested measures to reduce food
waste. The measures saved 17% of food waste. Proven
measures were subsequently rolled out across the entire
fleet.
33ROBINSON Club Apulia
Solar Power Plant: The ROBINSON Club Apulia installed 3,280 solar
modules on a total area of 5,500 square metres. This makes the system
one of the largest in Europe and generates 1,438 megawatt hours of
electricity per year. Around 70% of the electricity generated is used for the
hotel's needs and the rest is fed into the local power grid.
See https://www.tuigroup.com/en-en/media/press-releases/2018/2018-06-21-robinson-hotel-solar-panel-system
34
34TUI Airlines
Reduction of Carbon Emissions: TUI Group has invested in
cutting edge aviation technology, such as the Boeing 737 MAX
aircraft. On average the planes are 16% more fuel-efficient than
the 737 NG aircraft they replace in the TUI Airline fleet. The
aircraft’s engine and aerodynamic design are key to its superior
fuel efficiency. The Boeing 737 MAX also has a 40% smaller noise
footprint than previous generation aircraft.
35TUI Musement
TUI Collection: Through TUI Musement, our customers can discover new places and
contribute to the local economy. TUI Collection excursions promote unique, authentic and
responsible activities. Each TUI Collection excursion must meet specific criteria for
sustainability, demonstrating that it benefits local people and minimises environmental
impact. Since 2015, customers have experienced 5 million TUI Collection excursions.
36
36Global Realignment Programme on track to meet ~€400m p.a. cost
reduction target
PILLARS RECENT PROGRESS PHASING
• ~7k reduction in FTEs to date already agreed
REDUCE driving the majority of the cost savings P&L view
COSTS ~€400m p.a / 100%
• A major part of the cost reduction measures have
been implemented to date with most benefits
sitting in Markets & Airlines €303m
€240m / 60%
REDUCE • Restructuring of the German airline has
progressed with all actions concluded to bring
CAPITAL about a reduction of 17 aircraft to a fleet of 22
INTENSITY
• Retail: further shops closed in Q2 FY22 bringing €63m ~€70m
total to 106 net closures (66 in Central Region
40 in Northern Region)
FY20A FY21A FY22e FY23e
DRIVE • During the pandemic TUI Musement successfully
DIGITALISATION transformed into a Digital Platform business.
Focus is now moving to growing this platform. Per annum benefits SDI
Further ~20% of ~€400m p.a. target on track to be delivered in FY22
37Movement in Net Debt
FY21 H1 to FY22 H1
In €m FY22 H1 FY21 H1 In €m FY22 H1 FY21 H1
IFRS 16 IFRS 16 YoY ∆ IFRS 16 IFRS 16 YoY ∆
Opening net debt as at 1 October -4,954 -6,421 1,467 Financial liabilities -5,572 -8,226 2,653
FCF after Dividends 129 -1,585 1,714 - Lease liabilities under IFRS16 -3,146 -3,378 232
Asset Finance -139 -265 126 - Bond with warrant -149 -117 -32
Capital Increase 1,106 1,489 -383 - Convertible Bond -527 - -527
Other -80 -32 -49 - Liabilities to banks -1,685 -4,714 3,029
Discontinued operations - Nordotel 2 - 2 - Other liabilities -65 -16 -49
Closing Net Debt -3,936 -6,813 2,877 Cash & Bank Deposits 1,636 1,413 224
Net debt -3,936 -6,813 2,877
COMMENTS - Net Pension Obligation -551 -727 176
• SP11 and SP21 are classified as equity & dividends will be paid on the basis Memo: Lease liabilities - Aircraft -2,345 -2,384 40
of the drawn participations2. - Hotels -333 -451 118
• As at 31/03/22: - Ships -161 -174 13
o SP1 - €420m fully drawn - Other -307 -368 61
o SP2 - €671m fully drawn
o Cash RCF - €0.9bn of €1.5bn utilised Memo: Liabilities to banks - RCF -948 -3,830 2,882
o KfW RCF - €0.0bn of €3.0bn utilised - of which Cash3 -956 -1,502 551
• Post balance sheet date 6/05/22: - of which KfW 3
- -2,328 2,332
o Cash RCF - €0.7bn of €1.5bn utilised - SSD -427 -424 -3
o KfW RCF - €0.0bn of €2.4bn utilised - Asset Financing -311 -461 150
1 WSF Silent Participation – as agreed as part of third support package 2 Timing of the payment will be at the discretion of TUI AG. Any unpaid dividend has to be paid on termination or conversion of a silent participation at the latest; General comment: Gross
38 debt is defined as financial liabilities plus net pension obligation | 3 RCF detailed split includes cost of issuance and accrued interest costs amounting to ~€8m in FY22 H1FY22 Modelling Assumptions per 11 May 2022
FY22e1 FY21A
Revenue Expect significant increase year-on-year €4,732m
Underlying EBIT After two years of turbulence, expect return to significantly positive Und. EBIT2 -€2,075m
Adjustments3 -€90m to -€110m +€63m
Net interest4 -€380m to -€425m -€449m
Net investments5 -€120m to -€280m (expect upper-end) +€699m
Leases & asset financing Broadly stable -€3,582m
Net debt Expect significant improvement year-on-year -€4,954m
1 Based on constant currency and post IFRS 16 | 2 In view of the ongoing COVID-19 pandemic and the war in Ukraine, the assumptions for underlying EBIT are subject to considerable uncertainty. The greatest area of uncertainty will be the impact on consumer
confidence, should travel restrictions be reintroduced, should there be further cost inflation volatility and/or an escalation of the war in Ukraine | 3 Adjustments include goodwill impairment and SDIs | 4 Includes non-cash interest | 5 Includes PDPs (pre-delivery
39 payments)Financing facilities and support packages overview per 6 May 2022
Support Facility
Instrument Utilisation €m Debt/equity Maturity date
package # €m
- 1,535 691m drawn Debt
RCF
Bank - 215 guarantee line - July 2024
(unsecured)
facilities
1&2 2,4361 Fully undrawn Debt
Schuldschein - 425 - Debt July 2023/25/28
Bond with warrant
2 59 - Equity-Linked Warrant-Sept 2030
WSF
Bonds
Convertible bonds Debt /
- 590 - April 2028
(incl. tap issue) Equity-Linked
3 420 - Hybrid with equity credit
Silent Silent Participation 1 & 2
-
participations WSF 3 6711 - Hybrid with equity credit
Lease
Lease liabilities - 3,1462 - Debt Various
liabilities
40 1 We announced on 17 May 2022 a non-preemptive capital raise, the proceeds of which, will be used to fully repay €671m Silent Participation 2. Additionally, we will also hand-back/reduce KfW RCF by €336m to €2.1bn | 2 As of 31 March 2022FY22 Q2 Revenue by Segment (excludes Intra-Group Revenue and
JVs/associates)1
FY22 Q2 FY21 Q2
In €m Change incl FX FX Change ex FX
IFRS 16 IFRS 16
Hotels & Resorts 181.0 27.5 153.5 4.2 149.3
- Riu 152.0 17.3 134.7 3.8 130.9
- Robinson 18.1 6.8 11.3 0.3 11.0
- Blue Diamond2 - - - - -
- Other 10.9 3.4 7.5 0.1 7.4
Cruises 41.3 1.0 40.3 1.5 38.8
- TUI Cruises2 - - - - -
- Marella Cruises 41.3 1.0 40.3 1.5 38.8
TUI Musement 62.5 8.1 54.4 1.5 52.9
Holiday Experiences 284.8 36.5 248.3 7.2 241.1
- Northern Region 847.9 52.1 795.8 27.2 768.7
- Central Region 619.6 124.2 495.4 0.6 494.8
- Western Region 366.2 28.0 338.2 -0.0 338.2
Markets & Airlines 1,833.7 204.3 1,629.4 27.8 1,601.7
All other segments 9.9 7.3 2.6 0.2 2.4
TUI Group 2,128.4 248.1 1,880.3 35.2 1,845.1
41 1 Table contains rounding effects | 2 No revenue is carried for Blue Diamond as an associate which is consolidated at equity, or for Mein Schiff and Hapag-Lloyd Cruises which are consolidated at equity within TUI Cruises JVFY22 Q2 Underlying EBITDA by Segment1
FY22 Q2 FY21 Q2
In €m Change incl FX FX Change ex FX
IFRS 16 IFRS 16
Hotels & Resorts 68.0 -45.6 113.5 3.3 110.3
- Riu 66.4 -15.0 81.4 1.5 79.9
- Robinson -1.4 -3.6 2.2 0.3 1.8
- Blue Diamond 20.8 -13.7 34.5 1.5 33.0
- Other -17.9 -13.4 -4.5 - -4.5
Cruises -55.5 -38.6 -16.8 -0.9 -15.9
- TUI Cruises² -35.6 -24.6 -11.0 - -11.0
- Marella Cruises -19.9 -14.0 -5.9 -0.9 -4.9
TUI Musement -10.9 -22.7 11.8 0.1 11.8
Holiday Experiences 1.6 -106.9 108.5 2.4 106.1
- Northern Region -105.5 -134.7 29.2 -2.5 31.7
- Central Region 7.6 -90.2 97.8 0.9 96.9
- Western Region -23.4 -50.2 26.8 2.1 24.7
Markets & Airlines -121.3 -275.2 153.8 0.5 153.4
All other segments -3.3 -16.4 13.1 -0.3 13.3
TUI Group -123.1 -398.5 275.4 2.7 272.8
42 1 Table contains rounding effects | 2 Mein Schiff and Hapag-Lloyd Cruises are consolidated at equity within TUI Cruises JVFY22 Q2 Underlying EBIT by Segment1
FY22 Q2 FY21 Q2
In €m Change incl FX FX Change ex FX
IFRS 16 IFRS 16
Hotels & Resorts 23.7 -102.6 126.3 2.8 123.5
- Riu 44.0 -36.4 80.4 1.1 79.3
- Robinson -10.3 -12.5 2.3 0.2 2.0
- Blue Diamond 20.8 -13.7 34.5 1.5 33.0
- Other -30.9 -40.0 9.1 -0.1 9.2
Cruises -73.5 -55.0 -18.5 -1.7 -16.8
- TUI Cruises² -35.5 -24.6 -10.9 - 10.9
- Marella Cruises -38.0 -30.4 -7.6 -1.7 -5.9
TUI Musement -16.8 -29.3 12.5 - 12.5
Holiday Experiences -66.6 -186.9 120.3 1.1 119.2
- Northern Region -180.9 -221.0 40.1 -6.3 46.4
- Central Region -20.7 -122.7 101.9 0.2 101.8
- Western Region -57.0 -83.3 26.3 0.6 25.7
Markets & Airlines -258.7 -427.0 168.3 -5.6 173.9
All other segments -4.6 -19.1 14.5 -0.3 14.8
TUI Group -329.9 -633.0 303.1 -4.7 307.8
43 1 Table contains rounding effects | 2 Mein Schiff and Hapag-Lloyd Cruises are consolidated at equity within TUI Cruises JVFY22 H1 Revenue by Segment (excludes Intra-Group Revenue and
JVs/associates)1
FY22 H1 FY21 H1
In €m Change incl FX FX Change ex FX
IFRS 16 IFRS 16
Hotels & Resorts 379.3 83.9 295.4 5.6 289.8
- Riu 314.4 59.2 255.2 4.9 250.3
- Robinson 38.7 13.4 25.3 0.5 24.8
- Blue Diamond2 - - - - -
- Other 26.2 11.3 14.9 0.2 14.9
Cruises 75.5 1.5 74.0 3.6 70.4
- TUI Cruises2 - - - - -
- Marella Cruises 75.5 1.5 74.0 3.6 70.4
TUI Musement 128.8 18.6 110.2 2.3 107.9
Holiday Experiences 583.6 104.0 479.6 11.5 468.1
- Northern Region 1,500.2 159.1 1,341.0 61.6 1,279.4
- Central Region 1,604.7 337.4 1,267.3 -0.2 1,267.5
- Western Region 782.2 102.1 680.2 - 680.2
Markets & Airlines 3,887.1 598.6 3,288.5 61.4 3,227.1
All other segments 26.9 13.6 13.2 0.5 12.7
TUI Group 4,497.6 716.3 3,781.3 73.4 3,707.9
44 1 Table contains rounding effects | 2 No revenue is carried for Blue Diamond as an associate which is consolidated at equity, or for Mein Schiff and Hapag-Lloyd Cruises which are consolidated at equity within TUI Cruises JVFY22 H1 Underlying EBITDA by Segment1
FY22 H1 FY21 H1
In €m Change incl FX FX Change ex FX
IFRS 16 IFRS 16
Hotels & Resorts 175.0 -87.1 262.1 4.6 257.5
- Riu 152.7 -26.1 178.8 2.1 176.7
- Robinson 9.3 -10.3 19.6 0.4 19.2
- Blue Diamond 25.7 -27.2 52.9 1.9 51.0
- Other -12.7 -23.5 10.8 0.2 10.6
Cruises -70.5 -122.3 51.8 -1.7 53.5
- TUI Cruises² -38.2 -94.2 56.0 - 56.0
- Marella Cruises -32.3 -28.1 -4.2 -1.7 -2.5
TUI Musement -17.7 -49.5 31.8 0.0 31.8
Holiday Experiences 86.7 -258.9 345.6 3.0 342.6
- Northern Region -202.0 -255.5 53.5 -9.1 62.6
- Central Region -19.5 -209.9 190.4 1.5 188.9
- Western Region -20.4 -90.7 70.3 3.3 67.0
Markets & Airlines -241.9 -556.1 314.2 -4.2 318.4
All other segments -33.3 -41.1 7.8 -1.0 8.8
TUI Group -188.4 -856.1 667.7 -2.1 669.8
45 1 Table contains rounding effects | 2 Mein Schiff and Hapag-Lloyd Cruises are consolidated at equity within TUI Cruises JVFY22 H1 Underlying EBIT by Segment1
FY22 H1 FY21 H1
In €m Change incl FX FX Change ex FX
IFRS 16 IFRS 16
Hotels & Resorts 84.8 -198.3 283.1 3.9 279.2
- Riu 106.1 -73.3 179.4 1.7 177.7
- Robinson -8.9 -29.3 20.4 0.3 20.1
- Blue Diamond 25.6 -27.2 52.9 1.9 51.0
- Other -38.0 -68.4 30.4 - 30.4
Cruises -105.3 -153.3 48.1 -3.4 51.5
- TUI Cruises² -38.2 -94.2 56.0 - 56.0
- Marella Cruises -67.1 -59.1 -7.9 -3.4 -4.5
TUI Musement -29.5 -62.0 32.5 0.0 32.5
Holiday Experiences -49.9 -413.6 363.6 0.4 363.2
- Northern Region -352.6 -418.3 65.7 -15.9 81.6
- Central Region -75.7 -272.0 196.3 0.5 195.9
- Western Region -89.4 -159.8 70.4 1.0 69.4
Markets & Airlines -517.7 -850.1 332.4 -14.5 346.9
All other segments -35.8 -45.1 9.3 -1.0 10.2
TUI Group -603.5 -1,308.8 705.3 -15.0 720.3
46 1 Table contains rounding effects | 2 Mein Schiff and Hapag-Lloyd Cruises are consolidated at equity within TUI Cruises JVANALYST AND INVESTOR ENQUIRIES
Mathias Kiep, Group Director Controlling, Corporate Finance & Investor Relations Tel: +44 (0)1293 645 925
+49 (0)511 566 1425
Nicola Gehrt, Director, Head of Group Investor Relations Tel: +49 (0)511 566 1435
Hazel Chung, Senior Investor Relations Manager Tel: +44 (0)1293 645 823
James Trimble, Investor Relations Manager Tel: +44 (0)1582 315 293
Stefan Keese, Investor Relations Manager Tel: +49 (0)511 566 1387
Jessica Blinne, Junior Investor Relations Manager Tel: +49 (0)511 566-1442
Anika Heske, Junior Investor Relations Manager Tel: +49 (0)511 566-1425You can also read