Twitter-COMMs: Detecting Climate, COVID, and Military Multimodal Misinformation
←
→
Page content transcription
If your browser does not render page correctly, please read the page content below
Twitter-COMMs: Detecting Climate, COVID, and Military
                          Multimodal Misinformation

 Giscard Biamby ∗                     Grace Luo ∗                  Trevor Darrell                 Anna Rohrbach

                                       University of California, Berkeley
                  {gbiamby, graceluo, trevordarrell, anna.rohrbach}@berkeley.edu

                         Abstract                              over 884k tweets. In our approach, we fuse
                                                               input image and text embeddings generated by
    Detecting out-of-context media, such as “mis-
    captioned” images on Twitter, is a relevant
                                                               CLIP (Radford et al., 2021) via an elementwise
    problem, especially in domains of high pub-                product, and train a classifier to distinguish real
    lic significance. In this work we aim to develop           tweets from automatically constructed random and
    defenses against such misinformation for the               hard mismatches. To validate this approach and
    topics of Climate Change, COVID-19, and Mil-               demonstrate the usefulness of the Twitter-COMMs
    itary Vehicles. We first present a large-scale             dataset, we report results on human-generated
    multimodal dataset with over 884k tweets rel-              test data, created to mimic real-world misinfor-
    evant to these topics. Next, we propose a de-
                                                               mation. We discuss the results and model abla-
    tection method, based on the state-of-the-art
    CLIP model, that leverages automatically gen-              tions, and provide additional insights into the chal-
    erated hard image-text mismatches. While this              lenges of this task. Our dataset is publicly avail-
    approach works well on our automatically con-              able at: https://github.com/GiscardBiamby/Twitter-
    structed out-of-context tweets, we aim to vali-            COMMs.
    date its usefulness on data representative of the
    real world. Thus, we test it on a set of human-            2    Related Work
    generated fakes created by mimicking in-the-
    wild misinformation. We achieve an 11% de-                 There exist a number of large-scale Twitter datasets
    tection improvement in a high precision regime             concentrated on topics such as COVID-19 (Banda
    over a strong baseline. Finally, we share in-
                                                               et al., 2021) or Climate Change (Littman and
    sights about our best model design and analyze
    the challenges of this emerging threat.                    Wrubel, 2019). However, it remains difficult to
                                                               collect labeled misinformation. Researchers have
1   Introduction                                               collected COVID-19 misconceptions on social me-
                                                               dia via manual annotation (Hossain et al., 2020) or
Out-of-context images are a popular form of mis-
                                                               by linking to fact checking articles (Patwa et al.,
information where an image is miscaptioned to
                                                               2021). Not only are these datasets small (a few
support a false claim (Fazio, 2020). Such image re-
                                                               thousand samples), but they focus on false claims
purposing is extremely cheap yet can be as damag-
                                                               rather than multimodal inconsistency. Here, we
ing as more sophisticated fake media. In this work
                                                               curate social media posts that are topical and multi-
we focus on domains important for society and na-
                                                               modal, and we demonstrate an application to mis-
tional security, where implications of inexpensive
                                                               information detection of human-generated fakes.
yet effective misinformation can be immense.
                                                                  Recent work has developed approaches for multi-
   Specifically, we analyze multimodal Twitter
                                                               modal fact checking, e.g., Jaiswal et al. (2017) and
posts that are of significant public interest, re-
                                                               Müller-Budack et al. (2020), who query an external
lated to topics of COVID-19, Climate Change and
                                                               knowledge base. Similar to Luo et al. (2021) in the
Military Vehicles. Our goal is to learn to cat-
                                                               news domain, we use a large pretrained model that
egorize such image-text posts as pristine or fal-
                                                               does not require an external reference set.
sified (out-of-context) by means of detecting se-
mantic inconsistencies between images and text.
                                                               3    Twitter-COMMs Dataset
To that end, we first collect a large-scale dataset
of multimodal tweets, Twitter-COMMs, with                      Here, we describe the data collection strategies
    ∗
        Denotes equal contribution.                            behind Twitter-COMMs, which consists of mul-
                                                          1530
    Proceedings of the 2022 Conference of the North American Chapter of the Association for Computational Linguistics:
                                    Human Language Technologies, pages 1530 - 1549
                            July 10-15, 2022 ©2022 Association for Computational Linguistics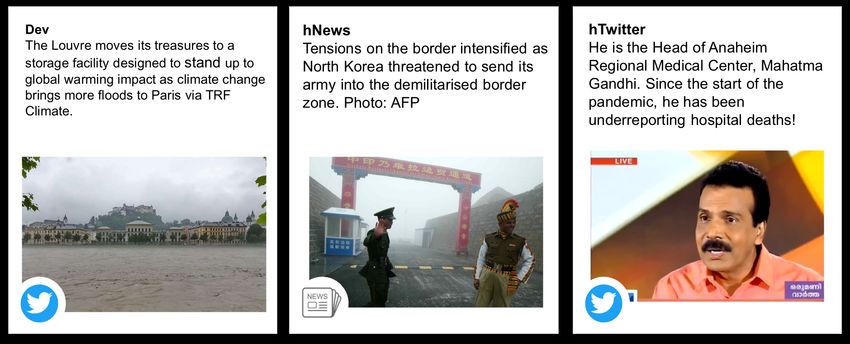
Table 1: Twitter-COMMs breakdown. “Collected“ de- Text-Text” split from Luo et al. (2021)). We mainly
notes all unique samples collected via the Twitter API. generate mismatches within each topic (COVID-19,
“Pristine“ and “Falsified“ denote all samples in our au-
Climate Change, Military Vehicles), except for a
tomatically generated Training set. To ensure the bal-
anced Training set, we “repeat” Pristine samples such small set of random mismatches across topics (de-
that there is an equal number of Pristine and Falsified noted as “Cross Topic”). Our dataset is balanced
samples. with respect to labels, where half of the samples
are pristine and half are falsified. Table 1 presents
Topic / Samples Collected Pristine Falsified summary statistics for the training samples. We
Random Hard detail our development set and other data used for
Climate Change 212,665 298,809 84,432 214,377 evaluation in the next section.
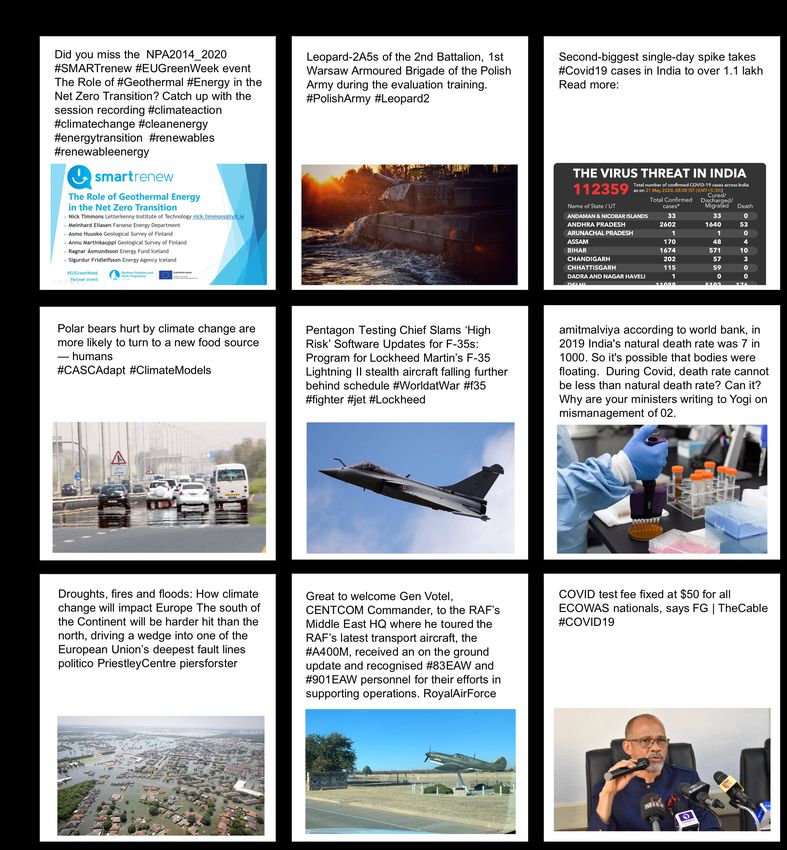
COVID-19 569,982 736,539 162,410 574,129 Qualitative Analysis: We present random ex-
Military Vehicles 101,684 139,213 35,376 103,837
Cross Topic - 59,735 59,735 - amples from our training set in Figure 1. Overall,
we see that the collected Twitter samples tend to
Total 884,331 2,468,592
be “on topic” and the amount of noise is low. Hard
negatives are often visually grounded, while ran-
timodal tweets covering the topics of COVID-19, dom negatives contain image/text pairs that are
Climate Change, and Military Vehicles. only weakly related, since they pertain to the same
Data Collection: We collected data using Twit- topic. The Climate Change hard negative depicts
ter API v21 in three stages for COVID-19 and Cli- an image of flooded homes to represent “droughts,
mate Change, and two stages for Military Vehicles, fires and floods” while the random negative depicts
refining the filters at each stage to acquire more an image of cars relevant to climate but inconsistent
relevant tweets. COVID-19 and Climate Change with “polar bears”. The COVID-19 hard negative
stages progressed from simple high level keywords uses an image of a Nigerian spokesman to depict
towards more specific ones in stage two and tweets news pertaining to “ECOWAS2 ” while the random
authored by news organizations in the final stage. one uses a stock photo of lab testing to represent
For Military Vehicles the first stage used high level Covid. These entity-level, rather than topic-level,
search terms such as “military”, “aircraft”, “tank”, alignments more closely resemble real-world out-
which resulted in noisy data, so the second stage of-context images that often reference and misrep-
used a large number of highly specific terms related resent visually depicted entities. Note the diver-
to vehicle models. Full details can be found in Ap- sity of images and text in our training set, where
pendix A.1. We employed the following global there exist both natural images and info-graphics,
filters for all topics: (1) language=English, (2) has and language varies from organizational announce-
at least one image, and (3) not a retweet. ments and news headlines to personal opinions.
In total, we have collected 884, 331 tweets, each
having at least one image (composed of 24% Cli- 4 Experiments
mate Change, 64.5% COVID-19, and 11.5% Mili-
tary Vehicles tweets), see Table 1. Tweets for Cli- Next, we discuss the data used for evaluation,
mate Change and Military Vehicles were collected present our approach and ablate various design
starting from June 2016 and for COVID-19 starting choices, report results on our evaluation sets, and
from February 2020, all ending in September 2021. provide additional analysis of the task difficulty.
Falsified Samples: In addition to the pristine
samples, we automatically generate falsified sam- 4.1 Evaluation Sets
ples where there is some inconsistency between We report results on three evaluation sets. (a) We
image and text. We create random negatives (de- validate our approach on samples synthetically gen-
noted as “Random”) by selecting an image for a erated using the same procedure as our training
given caption at random. We also create hard nega- set (denoted Dev), where all topics and falsifica-
tives (denoted as “Hard”) by retrieving the image tion methods are equally represented (i.e., the ra-
of the sample with the greatest textual similarity for tio of random vs. hard negatives is 50-50). We
a given caption (following the “Semantics / CLIP also evaluate on human-curated samples from the
1
https://developer.twitter.com/en/docs/twitter-api/getting-
2
started/about-twitter-api Economic Community of West African States
1531
Figure 1: Twitter-COMMs examples of Pristine and Falsified (Random / Hard) samples by topic.

DARPA Semantic Forensics (SemaFor) Program3                      set is available to us, the hTwitter set is hidden.
derived from (b) news images and captions (de-
                                                                       Table 2: Evaluation samples breakdown.
noted hNews) and (c) Twitter (denoted hTwitter).
To generate this data, humans manually introduced                                 Domain         Pristine Falsified   Total
inconsistencies to pristine image-caption pairs.4                        Dev      Social Media   13,276     13,276 26,552
                                                                         hNews News               1,112        256 1,368
While hNews/hTwitter data is not real misinforma-                        hTwitter Social Media      114        122    236
tion, it is in-the-wild w.r.t. our synthetic training
data and much more representative of real-world                  4.2   Approach and Design Choices
human-generated misinformation. All three eval-
                                                                 For our approach we fine-tune CLIP (Radford
uation sets contain a mixture of samples relevant
                                                                 et al., 2021), a large pretrained multimodal model
to the topics of COVID-19, Climate Change, and
                                                                 that maps images and text into a joint embedding
Military Vehicles (Figure 2). Table 2 provides the
                                                                 space via contrastive learning. Our model gener-
number of samples in each set. While the hNews
                                                                 ates CLIP embeddings using the RN50x16 back-
                                                                 bone, multiplies the image and text embeddings,
   3
     Dedicated to defense against misinformation and falsified   and passes the result to a classifier that scores the
media: https://www.darpa.mil/program/semantic-forensics
   4
     We thank PAR Tech, Syracuse University, and the Uni-        pair as pristine or falsified. We use a learning rate
versity of Colorado, Denver for creating the evaluation data.    of 5e-08 for CLIP and 5e-05 for the classifier and
                                                             1532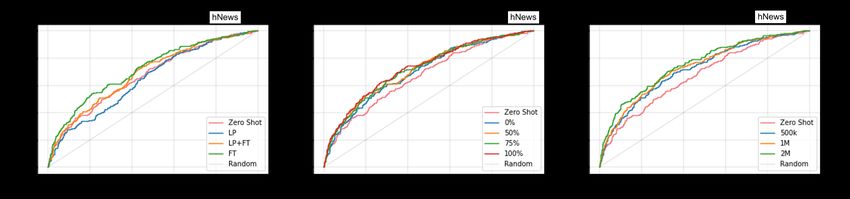
Figure 2: Examples of the falsified samples from the evaluation sets. Dev example is our automatically constructed
hard negative sample. hNews and hTwitter samples are manually curated. Note, for hNews/hTwitter we do not show
the actual samples but create similar examples for illustrative purpose, as the data is not yet publicly available.

train for 16 epochs. For our baseline CLIP Zero                     presents the results. More hard negatives in train-
Shot model, we generate CLIP embeddings of-the-                     ing generally improves the performance on hard
shelf and compute a dot product, which is used to                   negatives in our development set, but there is also
score the pair. For more details, see the Appendix.                 a trade-off in performance on random negatives.
   We report metrics for varying thresholds over the                Given that we care about samples that more closely
predicted scores; in most tables we report balanced                 mimic challenging real-world misinformation but
classification accuracy at equal error rate (Acc @                  also want to avoid degrading performance on easy
EER). We also report falsified class accuracy at two                samples, we opt for a ratio of 75% hard and 25%
thresholds (pD @ 0.1 FAR and pD @ EER).                             random negatives for future experiments.
   Multimodal Fusion: First, we compare differ-
ent multimodal fusion techniques, see Table 3. We                   Table 4: Balanced binary classification accuracy at EER
try three fusion methods: concatenating the CLIP                    by percentage of hard negatives, Dev set.
image and text embeddings (Concat), concatenat-                                    Climate Change      COVID-19        Military Vehicles
                                                                                   Random Hard       Random Hard       Random Hard
ing the embeddings and their dot product (Concat
                                                                            0%     0.9352   0.7714   0.9188   0.7600   0.9405    0.7236
+ Dot), and multiplying the embeddings element-                             50%    0.9344   0.7968   0.9247   0.7807   0.9440    0.7467
wise (Multiply). Inspired by how CLIP was trained                           75%    0.9356   0.7979   0.9241   0.7809   0.9410    0.7470
                                                                            100%   0.9311   0.8004   0.9227   0.7834   0.9425    0.7457
to maximize the dot product of normalized image-
text pairs, Concat + Dot and Multiply incentivize
the classifier to stay faithful to the pre-initialized              4.3       Results and Analysis
joint embedding space. These architecture choices                   Results on hNews, hTwitter Sets: Our final model
yield on average a 7% performance improvement                       was directly fine-tuned on the entire training set
over simple concatenation. For future experiments                   of over 2M training samples, with a ratio of 75%
we choose the Multiply method to minimize train-                    hard and 25% random negatives. We report results
able parameters and maintain a simple approach.                     in Table 5, comparing to CLIP Zero Shot. We
Table 3: Balanced binary classification accuracy at EER             improve by 11% in pD @ 0.1FAR, meaning that
by fusion method, Dev set.                                          our method is able to detect more falsified samples
                                                                    with minimal false alarms. At equal error rate we
             Climate Change     COVID-19     Military Vehicles
             Random Hard      Random Hard    Random Hard
                                                                    improve by 5% in both detection and accuracy. We
  Concat     0.8712   0.6810 0.8797   0.6882 0.9111    0.6775
                                                                    emphasize that the hTwitter data is unseen to us.
  Concat+Dot 0.9305
  Multiply   0.9344
                      0.8038 0.9191
                      0.7968 0.9247
                                      0.7848 0.9485
                                      0.7807 0.9440
                                                       0.7472
                                                       0.7467
                                                                    Next, we analyze the performance of our final
                                                                    model w.r.t. several characteristics on our Dev set.
                                                                       OCR Coverage: Given that text present in
   Percentage of Hard Negatives: Next, we an-                       images can often be used to corroborate captions,
alyze the importance of using hard negatives in                     we break down model performance by the amount
our training data. Specifically, we measure the im-                 of text detected by an English OCR model5 . In
pact of different percentages of hard negative sam-
ples, where the rest are random negatives. Table 4                      5
                                                                            https://github.com/JaidedAI/EasyOCR

                                                                 1533
Table 5: Balanced binary classification accuracy at vary-       represented).6 As observed in Table 6 (middle), for
ing thresholds on Dev, hNews and hTwitter sets. We              samples with text represented model performance
report based on Probability of Detection (pD), False
                                                                improves by 8% and for samples where image
Alarm Rate (FAR), and Equal Error Rate (EER).
                                                                adds performance improves by 4% for detection in
                           pD @ 0.1 FAR pD @ EER Acc @ EER      a high precision regime (pD @ 0.1FAR). Although
    Dev       Zero Shot       0.7396     0.8287    0.8286       the text-image relationship model has somewhat
              Ours            0.8044     0.8546    0.8546
                                                                noisy classifications for the text task, the text rep-
    hNews     Zero Shot       0.2852     0.6133    0.6133
              Ours            0.4219     0.6836    0.6840       resented class generally contains samples with a
    hTwitter Zero Shot        0.7623     0.8279    0.8306       shared entity between image and text, which would
             Ours             0.8771     0.8771    0.8771
                                                                make fine-grained misinformation detection eas-
                                                                ier. The image adds class mostly contains info-
Table 6 (top), we report results broken down by                 graphics, likely due to training data bias, which
the % of the image covered by text (the area of the             aligns with the OCR coverage experiments above.
union of text detections divided by the image size).               Tweet Text Clustering: Finally, we analyze the
Each bucket roughly corresponds to natural im-                  sub-topics obtained as a result of clustering Tweets
ages, natural images with scene text, graphics, and             within each topic7 . This allows us to tease out clus-
screenshots of text. The presence of any text yields            ters, e.g., vaccination for COVID-19, floods for
more than a 6% improvement for pD @ 0.1FAR                      Climate Change or drones for Military Vehicles.
and performance peaks at 10-50% coverage.                       Recall that our model performs the best on Climate
                                                                Change and the worst on the Military Vehicles (Ta-
Table 6: Balanced binary classification accuracy at vary-       ble 4). Possible factors include the smaller amount
ing thresholds on Dev set broken down by: % of image            of training data and visual similarity of different
covered by text (top), various text-image relationships         vehicle types. We also observe that among the hard
(middle) and within- vs. cross-cluster status of the hard       negatives for Military Vehicles, only 39% are cross-
falsifications (bottom). The latter results are obtained        cluster (while Climate Change and COVID-19 have
on the subset of hard falsified samples and their corre-        51% and 58% respectively), indicating the Military
sponding pristine samples.
                                                                Vehicles set contains a larger proportion of harder
                           pD @ 0.1 FAR pD @ EER Acc @ EER      fakes. These factors may explain the larger differ-
    OCR Coverage                                                ence between cross/within cluster performance for
    =0%                      0.7588      0.8329    0.8329
    0-10%                    0.8192      0.8575    0.8575       this topic (Table 6, bottom).
    10-50%                   0.8367      0.8709    0.8710
    >50%                     0.8412      0.8588    0.8588
                                                                5   Conclusion
    Text-Image Relationship
    Image does not add      0.7908       0.8471    0.8470
    Image adds              0.8308       0.8675    0.8674       In this work we tackle a real-world challenge
    Text not represented     0.7696      0.8401    0.8401       of detecting out-of-context image-text tweets on
    Text represented         0.8518      0.8745    0.8745       COVID-19, Climate Change, Military Vehicles top-
    Tweet Text Clustering                                       ics. To approach it, we collect Twitter-COMMs, a
    Climate Change
    Cross-cluster            0.7214      0.8268    0.8268       large-scale topical dataset with multimodal tweets,
    Within-cluster           0.6571      0.8055    0.8055
                                                                and construct corresponding hard mismatches. We
    COVID-19
    Cross-cluster            0.6837      0.8099    0.8103       design our approach based on the CLIP model with
    Within-cluster           0.6013      0.7758    0.7753       several important design choices, e.g. multiplying
    Military Vehicles
    Cross-cluster            0.7826      0.8634    0.8618
                                                                the embeddings for multimodal fusion and increas-
    Within-cluster           0.6000      0.7539    0.7545       ing the percentage of hard negatives in our training
                                                                data. This approach substantially improves over
   Text-Image Relationship: Within social media,
                                                                a powerful baseline, an off-the-shelf CLIP model,
there exist more complex interactions than the di-
                                                                when evaluated on human-curated in-the-wild mis-
rect relationships seen in formats like image alt-text.
                                                                matches. We hope our work and insights will bene-
As such, we trained a CLIP model on the dataset
                                                                fit multimedia forensics practitioners.
presented by (Vempala and Preoţiuc-Pietro, 2019)
to characterize these relationships: classifying if
                                                                   6
the image content adds additional meaning (image                     Our model achieves 86% and 62% on the image and text
                                                                binary classification tasks respectively, which is 5% and 4%
adds / does not add) or if there is semantic overlap            higher than the best models presented in the original paper.
between the text and image (text represented / not                 7
                                                                     See Appendix A.3.4 for details.

                                                             1534
6 Ethical Considerations possibly sensitive content as flagged by Twitter in
Table 14 (Appendix).
Here, we discuss ethical considerations regarding What is the climate impact? Our final model
our work. Image repurposing is a prominent so- used 8 days of training on 10 GPUs. Additional
cietal issue that lacks sufficient training data in experiments such as the investigation of text im-
general, and in particular for content on social me- age relationships used 4 days on a single GPU,
dia platforms such as Twitter. Even more, our work and tweet text clustering used 10 hours on a sin-
aims to be proactive in studying the threat of out-of- gle GPU. The GPU used for all experiments were
context media and proposes an approach for detect- GeForce 2080 RTX Ti’s. In total we used 2,026
ing such misinformation. By presenting a dataset, GPU hours, and total emissions are estimated to
a detection approach, and several key observations be 218.81 kgCO2 eq of which 0 percents were di-
about falsified out-of-context Tweets, we hope that rectly offset. Estimations were conducted using the
our work serves as a net benefit for society. MachineLearning Impact calculator presented in
How was the data collected? We collected data (Lacoste et al., 2019).
using the Twitter Search API v2. Our methodology What are the potential dataset biases? Here,
is described in detail in Appendix A.1. we focus on our method used to generate hard fal-
What are the intellectual property rights? sified samples to understand the potential biases
Twitter owns the intellectual property for the learned during training. Specifically, we note poten-
Tweets in our Twitter-COMMs dataset. We adhere tial age, race, and gender biases present in CLIP, the
to the restrictions they place on Tweets downloaded underlying model used to generate our mismatches.
via their API, namely that we may not share the Radford et al. (2021) find the CLIP exhibits sig-
content downloaded from the API, but we have re- nificant performance differences when classifying
leased the Tweet ID’s — which others can use to individuals of different races and ages into cate-
download the Tweets and images from the API. gories related to crime or animals. Agarwal et al.
How did we address participant privacy (2021) also find gender biases in the CLIP embed-
rights? N/A dings when classifying occupations. These biases
Were annnotators treated fairly? Did we re- primarily affect the synthetically generated training
quire review from a review board? N/A set, not the pristine data. However, we can not rule
Which populations do we expect our dataset out that the pristine Twitter data may also capture
to work for? Our dataset is specific to social media some human biases or harmful stereotypes.
posts from Twitter that are written in English; it
will primarily be useful for audiences from English 7 Acknowledgements
speaking countries, such as the US, UK, Australia,
and India. The biases inherent to the short text style We would like to thank PAR Tech, Syracuse Uni-
(280 characters or less) and of Tweets with images versity, and the University of Colorado, Denver
will be useful for those interested in researching for creating the evaluation data. We thank the SRI
multimodal misinformation on Twitter. team, including John Cadigan and Martin Gracia-
What is the generalizability of our claims? rena, for providing the WikiData-sourced news or-
Our results apply primarily to Tweets on our three ganization Twitter handles. We would also like to
topics of interest (COVID-19, Climate Change, thank Dong Huk (Seth) Park, Sanjay Subramanian,
Military Vehicles) written in English and having at and Reuben Tan for helpful discussions on fine-
least one attached image. tuning CLIP. This work was supported in part by
How did we ensure dataset quality? Our data DoD including DARPA’s LwLL, and/or SemaFor
collection methodology is described in detail in programs, and Berkeley Artificial Intelligence Re-
Appendix A.1. To address data quality for Military search (BAIR) industrial alliance programs.
Vehicles we created an image classifier to filter
out tweets that did not have images of military References
vehicles or aircraft (Appendix A.1.2). Additionally,
the sub-topic clustering we performed (Section 4.3, Sandhini Agarwal, Gretchen Krueger, Jack Clark, Alec
Radford, Jong Wook Kim, and Miles Brundage.
Appendix A.3.4) reveals that most of the text falls 2021. Evaluating clip: Towards characterization of
into clusters that are related to the three main topics. broader capabilities and downstream implications.
We also provide some statistics for tweets with arXiv:2108.02818.
1535Juan M. Banda, Ramya Tekumalla, Guanyu Wang, Eric Müller-Budack, Jonas Theiner, Sebastian Diering,
Jingyuan Yu, Tuo Liu, Yuning Ding, Ekaterina Arte- Maximilian Idahl, and Ralph Ewerth. 2020. Multi-
mova, Elena Tutubalina, and Gerardo Chowell. 2021. modal analytics for real-world news using measures
A large-scale covid-19 twitter chatter dataset for open of cross-modal entity consistency. In ACM ICMR.
scientific research—an international collaboration.
Epidemiologia, 2(3):315–324. Parth Patwa, Shivam Sharma, Srinivas Pykl, Vineeth
Guptha, Gitanjali Kumari, Md Shad Akhtar, Asif Ek-
Lisa Fazio. 2020. Out-of-context photos are a bal, Amitava Das, and Tanmoy Chakraborty. 2021.
powerful low-tech form of misinformation. Fighting an infodemic: Covid-19 fake news dataset.
theconversation.com/out-of-context-photos-are- Communications in Computer and Information Sci-
a-powerful-low-tech-form-of-misinformation- ence, page 21–29.
129959.
Alec Radford, Jong Wook Kim, Chris Hallacy, Aditya
Maarten Grootendorst. 2020. Bertopic: Leveraging bert Ramesh, Gabriel Goh, Sandhini Agarwal, Girish Sas-
and c-tf-idf to create easily interpretable topics. try, Amanda Askell, Pamela Mishkin, Jack Clark,
et al. 2021. Learning transferable visual models from
Tamanna Hossain, Robert L. Logan IV, Arjuna Ugarte, natural language supervision. arXiv:2103.00020.
Yoshitomo Matsubara, Sean Young, and Sameer
Nils Reimers and Iryna Gurevych. 2019. Sentence-bert:
Singh. 2020. COVIDLies: Detecting COVID-19
Sentence embeddings using siamese bert-networks.
misinformation on social media. In Proceedings of
In Proceedings of the 2019 Conference on Empirical
the 1st Workshop on NLP for COVID-19 (Part 2)
Methods in Natural Language Processing.
at EMNLP 2020, Online. Association for Computa-
tional Linguistics. Mingxing Tan and Quoc Le. 2019. Efficientnet: Re-
thinking model scaling for convolutional neural net-
Ayush Jaiswal, Ekraam Sabir, Wael AbdAlmageed, and works. In International Conference on Machine
Premkumar Natarajan. 2017. Multimedia semantic Learning, pages 6105–6114. PMLR.
integrity assessment using joint embedding of images
and text. In Proceedings of the 25th ACM interna- Alakananda Vempala and Daniel Preoţiuc-Pietro. 2019.
tional conference on Multimedia. Categorizing and inferring the relationship between
the text and image of Twitter posts. In Proceedings of
Ananya Kumar, Aditi Raghunathan, Robbie Jones, the 57th Annual Meeting of the Association for Com-
Tengyu Ma, and Percy Liang. 2022. Fine-tuning putational Linguistics, pages 2830–2840, Florence,
can distort pretrained features and underperform out- Italy. Association for Computational Linguistics.
of-distribution. In The International Conference on
Learning Representations (ICLR).
Alexandre Lacoste, Alexandra Luccioni, Victor
Schmidt, and Thomas Dandres. 2019. Quanti-
fying the carbon emissions of machine learning.
arXiv:1910.09700.
Justin Littman and Laura Wrubel. 2019. Climate
Change Tweets Ids.
Grace Luo, Trevor Darrell, and Anna Rohrbach. 2021.
Newsclippings: Automatic generation of out-of-
context multimodal media. In Proceedings of the
2021 Conference on Empirical Methods in Natural
Language Processing.
Claudia Malzer and Marcus Baum. 2020. A hybrid ap-
proach to hierarchical density-based cluster selection.
In 2020 IEEE International Conference on Multisen-
sor Fusion and Integration for Intelligent Systems
(MFI), pages 223–228. IEEE.
Leland McInnes and John Healy. 2017. Accelerated
hierarchical density based clustering. 2017 IEEE
International Conference on Data Mining Workshops
(ICDMW).
Leland McInnes, John Healy, and James Melville. 2020.
Umap: Uniform manifold approximation and projec-
tion for dimension reduction. arXiv:1802.03426.
1536A Appendix
In Section A.1 we provide additional details about data collection, including our strategy and search
keywords. Section A.2 provides dataset statistics, including information on tweet counts, geographical
information, possibly sensitive content, and image availability. We include additional experiments in
Section A.3.
A.1 Data Collection
A.1.1 COVID-19 and Climate Change
Our data collection consisted of three stages. The first employed simple topic, keyword, and hashtag
filters, the second stage used more specific keyword and topic combinations, while the third focused on
collecting topical data from Twitter accounts of various news organizations.
In the first stage we collected roughly 100,000 tweets each for COVID-19 and Climate Change topics.
We used the “COVID-19” topic of the Twitter API’s Entity Annotations feature8 , which allows users
to find tweets related to predetermined topics. For Climate Change we filtered with an OR clause
on keywords “climate change”, “global warming”, and (#globalwarming, #climatechange) hashtags.
Inspection of the stage 1 results revealed a lot of off-topic tweets. For example, a Twitter user might
post a tweet about working from home during the pandemic and tag the tweet with a COVID-related
hashtag. While this type of content is somewhat related to COVID-19, we wanted to focus on data where
misinformation/disinformation might be more relevant, such as more topical/newsworthy tweets (e.g. bad
actors may spread propaganda related to the COVID-19 pandemic by making false or misleading claims).
To that end, in stage 2 we filtered by combining each topic phrase with one of the 19 topical search terms
(e.g. “agriculture”, “crops”, “death”, “vaccination”). The resulting data appeared much more relevant
than the initial collection effort. Table 7 contains a list of the search terms we used to collect data for
COVID-19 and Climate Change tweets. Finally, related to the argument above, in the third collection
stage we focused on tweets authored by news organizations, as opposed to random users. For that, 7k
news organization Twitter handles were sourced from WikiData9 .
Table 7: Search Terms Used in Stage 2 of the Data Collection for COVID-19 and Climate Change
Search Terms
Agriculture, COVID, COVID-19, Climate Change, Crops, Death, Death Toll,
Floods, Harvest, Hurricane, ICBM, Military, Military Parade, Military Vehicles,
Show of Force, Tank, Troops, Typhoon, Vaccination
A.1.2 Military Vehicles
Collecting data about the Military Vehicles topic proved more challenging than the other two topics. We
initially tried simple keyword filters such as “military”, “aircraft”, “tank”, etc, but found that those resulted
in a lot of irrelevant content such as tweets related to video games, or tweets where “tank” took a different
meaning (e.g., “fish tank” or “tank tops”). This initial approach did not return many relevant results. The
WikiData news organization approach used in the other two topics also did not provide enough usable
data. As a result we crafted two different, highly customized stages for Military Vehicles. We gathered
a list of both civilian and military vehicles and aircraft from eight different publicly available datasets
(see Table 8). The datasets were annotated either for image classification or object detection tasks. We
queried the Twitter Search API using the vehicle and aircraft names from this set, but returned a lot of
off-topic data. We then trained an EfficientNet (Tan and Le, 2019) image classifier that categorized images
as either civilian ground vehicle, civilian aircraft, military ground vehicle, military aircraft, or other. (The
“other” category training set consisted of several thousand manually annotated images from the initial data
collection effort that did not contain any military or civilian vehicles or aircraft.) We trained the classifier
8
https://developer.twitter.com/en/docs/labs/annotations
9
https://www.wikidata.org/
1537to 97% accuracy and used it to filter out any tweets predicted to be in the “other” category. For the second
collection stage we combined the military vehicle and aircraft names with custom keywords (Table 9).
Table 8: Datasets Used to Construct Civilian/Military Vehicle and Aircraft Classifier
Dataset Source URL
Military Aircraft Detection Dataset https://www.kaggle.com/a2015003713/militaryaircraftdetectiondataset
War Tanks Dataset https://www.kaggle.com/icanerdogan/war-tank-images-dataset
Military Aircraft Dataset https://github.com/tlkh/milair-dataset
Military Tanks Dataset https://www.kaggle.com/antoreepjana/military-tanks-dataset-images
Military and Civilian Vehicles
Classification Dataset https://data.mendeley.com/datasets/njdjkbxdpn/1
Tau Vehicle Type Recognition https://www.kaggle.com/c/vehicle/data?select=train
FGVC-Aircraft Benchmark https://www.robots.ox.ac.uk/~vgg/data/fgvc-aircraft/
Stanford Cars Dataset https://ai.stanford.edu/~jkrause/cars/car_dataset.html
Table 9: Additional Keywords used in Stage 2 Collection for Military Vehicles
Keywords
aircraft, airplane, army, battle, flying, military, soldiers, troops
A.2 Dataset Statistics
Table 10: Full Dataset Summary
Topic Tweets Geo-tagged Countries Captions
COVID 569,982 4,637 112 569,982
Climate 212,665 3,696 138 212,662
Military 101,684 3,913 105 101,640
All 884,331 13,404 172 884,284
Table 10 shows a summary of the dataset. The “Geo-tagged” column refers to the geolocation data
provided by tweet authors. This property is empty in most cases, but when present, can be in the form of
a Twitter “place” which contains a display name, a geo polygon (which in some cases is as broad as an
entire country), as well as other fields, such as country name. It is also possible for the geo data to be in
the form of latitude and longitude, but that is rarer. The “Countries” columns is extracted from the geo
location data and because of the small amount of geo-tagged tweets we can only report countries for a
small fraction of tweets in the dataset (Table 11).
One oddity to note is that although we included an English-only search filter (“lang:en”) in all API
calls, the API still returned a small number of non-English tweets (Table 12). We are not sure why this is,
but manual inspection of some of these examples shows that a good portion of them are in fact in English.
Figure 3: Word Cloud Summaries for Each Topic
Figure 3 shows high-level “word cloud” summaries for the hashtags in the tweets for each topic.
Table 14 shows the number of tweets that Twitter flagged as containing possibly sensitive material,
i.e., samples that may contain adult content or graphic violence. We encourage users to be aware of such
tweets, which account for about 1% of the data, and may be undesirable for certain downstream tasks.
1538Table 11: Totals by Country (Top 20 Only)
Country Tweets Geo-tagged Captions
India 2,399 6,692 2,399
United Kingdom 2,127 6,020 2,127
United States 707 2,338 707
Canada 519 1,476 519
Australia 339 1,024 339
Pakistan 203 606 203
Germany 146 454 146
Kenya 130 360 130
Ireland 128 394 128
South Africa 118 342 118
Nigeria 116 352 116
Uganda 115 298 115
Republic of the Philippines 107 320 107
France 100 298 100
The Netherlands 95 290 95
Indonesia 81 238 81
Malaysia 77 224 77
Spain 75 194 75
New Zealand 68 212 68
Belgium 67 182 67
Table 12: Totals by Language
Language Tweets Total geo-tagged Countries Unique Captions
English 883,310 9,268 172 883,263
Non-English 618 3 3 618
Table 13: Totals for Country=“US”, by Topic
Topic Tweets geo-tagged Countries
Military Vehicles 705 705 1
COVID-19 0 0 0
Climate Change 2 2 1
Table 14: Possibly Sensitive Tweets
Poss. Sensitive Tweets % of Total
True 9,151 1.03
False 875,180 98.97
Table 15: Media Summary
Total Images Tweets
1,039,296 884,331
Table 16: Distribution of # of Media Items per Tweet
# Media in Tweet Tweets % of Total
1 801,764 90.6%
2 36,969 4.2%
3 18,803 2.1%
4 26,795 3.0%
The total number of images/tweets is shown in Table 15. Twitter allows users to include 1-4 images in
a tweet. As seen in Table 16, 90% of the tweets have a single image. In cases where a tweet contained
1539more than one image, we only used the first image (according to the order of the images returned by the
Twitter API).
A.3 Additional Experiments
All experiments reported in this paper are for a single run, as we find that variance across multiple runs
is low. All ROC curves and metrics are computed using sklearn’s roc_curve function. All models are
implemented in PyTorch. For our experiments, we make the following design choices:
• We use the RN50x16 backbone. We find that this backbone consistently yields a 2-3% improvement
compared to other released backbones, such as ViT/B-32. Our final CLIP model contains ∼300M
parameters initialized from the RN50x16 backbone and ∼600k parameters randomly initialized for
our classifier.
• We tune the upper layers and keep CLIP’s lower layers frozen10 . We find that this scheme is more
memory efficient and yields more stable convergence than tuning all the layers.
• We use a learning rate of 5e-08 for CLIP and 5e-05 for the classifier. From our hyperparameter
sweeps we find this setting to be the most appropriate, as CLIP is pretrained while the classifier is
randomly initialized.
• We multiply CLIP image and text embeddings before passing that as an input to the classifier. This is
different from Luo et al. (2021), who used a simple feature concatenation.
A.3.1 Expert vs. Joint Training
Here we study whether training a joint model on all three topics at once may be inferior to training three
topic-specific experts, see Figure 4. We find that the joint model performs on par with or better than the
expert models, thus we use a joint model in all the other experiments.
Figure 4: ROC Curves by Expert vs. Joint Training (Section A.3.1). The model is trained on 1M samples with 75%
hard negatives.
A.3.2 Fine-Tuning Scheme
Since we only know the high-level topics but not the precise composition of samples in our hidden
set hTwitter, we investigate methods for out-of-domain robustness. Specifically, we try the scheme from
(Kumar et al., 2022), where the authors first optimize the classifier while keeping the pretrained feature
extractor frozen (linear probing), then optimize the entire network (fine-tuning). The intuition behind
this method is that a good initialization from linear probing minimizes the chance of feature distortion,
i.e. when the pretrained model overfits to in-domain data. We report the results in Table 17. In fact, we
find that direct fine-tuning (FT) achieves slightly better performance on both in-domain Twitter data and
out-of-domain news data (hNews). Thus, in other experiments we use direct fine-tuning.
10
We fine-tune the layers “visual.layer4”, “visual.attnpool”, “transformer.resblocks.11”, “ln_final”, “text_projection”,
“logit_scale”.
1540Figure 5: ROC Curves by Fine-Tuning Scheme (Section A.3.2), Percentage of Hard Negatives (Section 4.2), and
Training Set Size (Section A.3.3) on the hNews set.
Table 17: Balanced binary classification accuracy at EER by fine-tuning scheme. LP (linear probe) or FT (fine-tune)
on 500k samples, 50% hard negatives.
Climate Change COVID-19 Military Vehicles hNews
Random Hard Random Hard Random Hard
LP 0.9178 0.7548 0.9013 0.7359 0.9224 0.7071 0.5870
LP+FT 0.9346 0.7877 0.9195 0.7752 0.9440 0.7387 0.6188
FT 0.9344 0.7969 0.9247 0.7807 0.9440 0.7467 0.6339
A.3.3 Training Set Size
We also investigate the influence of training set size on performance. We report the binary classification
accuracy as we use 500k, 1M, and 2M samples, as seen in Table 18. We observe that increasing training
data size generally leads to improved performance, with most of the gains coming from higher accuracy
on hard negatives.
Table 18: Balanced binary classification accuracy at EER by training set size. FT on varying number of samples,
75% hard negatives.
Climate Change COVID-19 Military Vehicles hNews
Random Hard Random Hard Random Hard
500k 0.9356 0.7979 0.9241 0.7809 0.9410 0.7470 0.6586
1M 0.9350 0.8055 0.9270 0.7909 0.9480 0.7595 0.6741
2M 0.9348 0.8104 0.9266 0.7927 0.9475 0.7696 0.6844
A.3.4 Tweet Text Clustering
We investigate the sub-topical clusters of the tweet text, and also evaluate the performance of the final fine-
tuned model in terms of how well it performs on a set of the hard falsified samples and their corresponding
pristine samples.
We use the method of (Grootendorst, 2020) to generate clusters, which entails computing SentenceBERT
(Reimers and Gurevych, 2019) embeddings for each Tweet text, using UMAP (McInnes et al., 2020) to
reduce the number of embedding dimensions from 768 to 20, and then running the HDBSCAN hierarchical
clustering algorithm (McInnes and Healy, 2017) on the UMAP output. We compute the ten most important
words for each cluster using the TF-IDF scores, and use this word list to gain insight into the concepts
present in the texts of each cluster.
For UMAP we use the 10 nearest neighbors. For Climate Change HDBSCAN hyperparameters are:
minimum topic size=400, and a cluster selection distance threshold = 0.56. For COVID-19 HDBSCAN:
minimum topic size=1200, and cluster selection distance threshold = 0.65. For Military Vehicles HDB-
SCAN: minimum topic size = 100, cluster selection distance threshold = 0.60. The cluster selection size
setting determines when clusters are merged, clusters within a smaller distance than this threshold setting
will get merged together (see HDBSCAN(ϵ̂) parameter in section IV of (Malzer and Baum, 2020)).
As discussed in the main paper, we are interested in analyzing model performance on within-cluster
vs. cross-cluster hard samples. First, the training data statistics per topic are presented in Table 19. Next,
Figure 6 shows the ROC curves for the within-cluster and cross-cluster samples.
1541Table 19: Training set statistics by topic, by sample_type
Total % of Topic Total # cross_cluster % cross_cluster
topic sample_type
COVID-19 pristine 736,539 50.00 0 0.00
hard 574,129 38.97 334,541 58.27
random 162,410 11.03 129,623 79.81
Climate Change pristine 298,809 50.00 0 0.00
hard 214,377 35.87 109,984 51.30
random 84,432 14.13 56,035 66.37
Military Vehicles pristine 139,213 50.00 0 0.00
hard 103,837 37.29 40,797 39.29
random 35,376 12.71 26,947 76.17
(a) (b) (c)
Figure 6: ROC curves on sets of pristine + falsified (hard-only) pairs, grouped by whether or not the falsified text
fell within the same cluster ("within-cluster") or in a different cluster ("cross-cluster").
To gain insight into the sub-topics, we concatenate the 3 top scoring words from each cluster to obtain
the cluster “names”, as seen in the Tables 20, 21, 22 with cluster names and word scores. We get between
20 and 30 clusters for each topic. We observe such sub-topics as ocean-sea-flood-flooding, plastic-
recycling-recycle-sustainability for Climate Change, vaccine-vaccination-clinic-appointment, school-
student-education-university for COVID-19, tank-abrams-army-m1, drone-ai-uav-drones for Military
Vehicles. The hierarchy visualizations in Figures 7, 8, 9 provide further insight into the sub-topic structure.
Table 20: Cluster Names and Word Scores - Climate Change
Cluster Name Word Scores
0_climatechange_world_report_energy (climatechange, 0.02), (world, 0.01), (report, 0.01), (energy, 0.01),
(warming, 0.01), (environment, 0.01), (climatecrisis, 0.01), (change,
0.01), (read, 0.01), (weather, 0.01)
-1_climatechange_world_climatecrisis_globalwarming (climatechange, 0.02), (world, 0.01), (climatecrisis, 0.01), (global-
warming, 0.01), (co2, 0.01), (environment, 0.01), (warming, 0.01),
(2021, 0.01), (sustainability, 0.01), (climateaction, 0.01)
1_environment_nature_climatechange_biodiversity (environment, 0.02), (nature, 0.02), (climatechange, 0.02), (biodiver-
sity, 0.02), (agriculture, 0.02), (plant, 0.02), (worldenvironmentday,
0.01), (earth, 0.01), (sustainability, 0.01), (ecosystem, 0.01)
2_ocean_sea_flood_flooding (ocean, 0.04), (sea, 0.03), (flood, 0.02), (flooding, 0.02), (climate-
change, 0.02), (coral, 0.01), (reef, 0.01), (coastal, 0.01), (warming,
0.01), (oceans, 0.01)
3_arctic_glacier_antarctica_antarctic (arctic, 0.10), (glacier, 0.04), (antarctica, 0.04), (antarctic, 0.03),
(warming, 0.03), (permafrost, 0.02), (climatechange, 0.02), (global-
warming, 0.01), (snow, 0.01), (climatecrisis, 0.01)
4_transport_vehicle_transportation_electricvehicles (transport, 0.04), (vehicle, 0.04), (transportation, 0.03), (electricvehi-
cles, 0.01), (electricvehicle, 0.01), (electrification, 0.01), (mobility,
0.01), (diesel, 0.01), (pollution, 0.01), (emissions, 0.01)
5_plastic_recycling_recycle_sustainability (plastic, 0.10), (recycling, 0.04), (recycle, 0.03), (sustainability,
0.03), (sustainable, 0.02), (ecofriendly, 0.02), (plasticpollution, 0.02),
(plasticfree, 0.02), (plasticfreejuly, 0.01), (plastics, 0.01)
Continued on next page
1542Table 20: Cluster Names and Word Scores - Climate Change
Cluster Name Word Scores
6_china_chinese_carbon_coal (china, 0.23), (chinese, 0.04), (carbon, 0.02), (coal, 0.02), (world,
0.02), (beijing, 0.02), (ccp, 0.01), (emission, 0.01), (taiwan, 0.01),
(emissions, 0.01)
7_god_pope_church_catholic (god, 0.08), (pope, 0.05), (church, 0.04), (catholic, 0.03), (religion,
0.03), (religious, 0.02), (christian, 0.02), (vatican, 0.02), (earth, 0.02),
(bible, 0.01)
8_hurricane_harvey_storm_cyclone (hurricane, 0.22), (harvey, 0.11), (storm, 0.09), (cyclone, 0.05), (hur-
ricanes, 0.04), (tropical, 0.03), (irma, 0.02), (climatechange, 0.02),
(storms, 0.01), (hurricaneharvey, 0.01)
9_island_caribbean_fiji_maldives (island, 0.09), (caribbean, 0.06), (fiji, 0.04), (maldives, 0.02), (ja-
maica, 0.02), (islands, 0.02), (country, 0.02), (region, 0.02), (kiribati,
0.01), (fijinews, 0.01)
10_blockchain_ecowatt_cryptocurrency_greencrypto (blockchain, 0.10), (ecowatt, 0.10), (cryptocurrency, 0.09), (green-
crypto, 0.08), (bitcoin, 0.07), (btc, 0.06), (crypto, 0.06), (decentral-
ization, 0.04), (climatechange, 0.02), (nfts, 0.02)
11_space_bezos_nasa_earth (space, 0.12), (bezos, 0.06), (nasa, 0.06), (earth, 0.04), (jeff, 0.03),
(billionaire, 0.03), (musk, 0.02), (climatechange, 0.02), (elon, 0.01),
(spacex, 0.01)
12_migration_displacement_refugee_displaced (migration, 0.12), (displacement, 0.08), (refugee, 0.07), (displaced,
0.05), (refugees, 0.03), (migrant, 0.02), (climatechange, 0.02), (un-
hcr, 0.02), (disasters, 0.01), (border, 0.01)
13_military_threat_pentagon_dod (military, 0.13), (threat, 0.05), (pentagon, 0.04), (dod, 0.03), (war,
0.02), (climatesecurity, 0.02), (climatechange, 0.02), (army, 0.01),
(navy, 0.01), (militarism, 0.01)
14_indigenous_indigenouspeoples_indigenous- (indigenous, 0.19), (indigenouspeoples, 0.04), (indigenouspeoples-
peoplesday_tribal day, 0.03), (tribal, 0.03), (native, 0.02), (tribe, 0.02), (biodiversity,
0.02), (indigenousday, 0.01), (culture, 0.01), (adaptation, 0.01)
15_aviation_flight_plane_airline (aviation, 0.09), (flight, 0.08), (plane, 0.06), (airline, 0.05), (flying,
0.04), (aircraft, 0.03), (airplane, 0.02), (industry, 0.02), (emissions,
0.02), (climatechange, 0.01)
16_olympics_sport_tokyo_olympic (olympics, 0.14), (sport, 0.09), (tokyo, 0.08), (olympic, 0.04),
(tokyo2020, 0.03), (climatecomeback, 0.02), (sports, 0.02), (cli-
matechange, 0.02), (rio2016, 0.01), (climatecrisis, 0.01)
17_ai_artificialintelligence_machinelearning_intel- (ai, 0.26), (artificialintelligence, 0.09), (machinelearning, 0.08), (in-
ligence telligence, 0.07), (ml, 0.05), (datascience, 0.05), (climatechange,
0.03), (nlp, 0.02), (sustainability, 0.02), (python, 0.01)
18_nuclear_nuclearenergy_uranium_reactor (nuclear, 0.33), (nuclearenergy, 0.04), (uranium, 0.03), (reactor,
0.03), (nuclearpower, 0.02), (electricity, 0.02), (climatechange, 0.02),
(cleanenergy, 0.01), (hiroshima, 0.01), (renewables, 0.01)
19_moon_orbit_wobble_earth (moon, 0.31), (orbit, 0.22), (wobble, 0.13), (earth, 0.07), (flooding,
0.07), (nasa, 0.06), (congressman, 0.03), (lunar, 0.02), (flood, 0.02),
(wobbling, 0.02)
20_air_pollution_cleanairday_airpollution (air, 0.18), (pollution, 0.10), (cleanairday, 0.07), (airpollution, 0.07),
(cleanair, 0.03), (climatechange, 0.02), (breathe, 0.02), (delhi, 0.02),
(smog, 0.02), (breathing, 0.01)
Table 21: Cluster Names and Word Scores - COVID-19
Cluster Name Word Scores
0_coronavirus_covid19_india_pandemic (coronavirus, 0.02), (covid19, 0.01), (india, 0.01), (pandemic, 0.01),
(corona, 0.01), (health, 0.01), (outbreak, 0.01), (news, 0.01), (hospi-
tal, 0.01), (uk, 0.01)
-1_county_covid19_coronavirus_health (county, 0.01), (covid19, 0.01), (coronavirus, 0.01), (health, 0.01),
(state, 0.01), (2021, 0.01), (pandemic, 0.01), (covid_19, 0.01), (vac-
cination, 0.01), (deaths, 0.01)
1_vaccine_vaccination_clinic_appointment (vaccine, 0.03), (vaccination, 0.03), (clinic, 0.02), (appointment,
0.02), (vaccinated, 0.01), (pfizer, 0.01), (walk, 0.01), (health, 0.01),
(visit, 0.01), (shot, 0.01)
2_nigeria_africa_lagos_nigerian (nigeria, 0.04), (africa, 0.03), (lagos, 0.02), (nigerian, 0.02), (sahara,
0.01), (uganda, 0.01), (buhari, 0.01), (african, 0.01), (ghana, 0.01),
(namibia, 0.01)
Continued on next page
1543Table 21: Cluster Names and Word Scores - COVID-19
Cluster Name Word Scores
3_india_vaccination_vaccine_crore (india, 0.04), (vaccination, 0.04), (vaccine, 0.02), (crore, 0.02),
(largestvaccinedrive, 0.02), (vaccinated, 0.01), (hospital, 0.01), (cov-
erage, 0.01), (modi, 0.01), (indiafightscorona, 0.01)
4_canada_ontario_quebec_scotia (canada, 0.06), (ontario, 0.05), (quebec, 0.03), (scotia, 0.03),
(province, 0.02), (alberta, 0.02), (ottawa, 0.02), (toronto, 0.02), (new-
foundland, 0.01), (manitoba, 0.01)
5_japan_tokyo_sport_olympics (japan, 0.05), (tokyo, 0.03), (sport, 0.03), (olympics, 0.02), (nfl,
0.02), (athlete, 0.01), (olympic, 0.01), (pandemic, 0.01), (coron-
avirus, 0.01), (basketball, 0.01)
6_school_student_education_university (school, 0.12), (student, 0.06), (education, 0.03), (university, 0.02),
(teacher, 0.02), (college, 0.02), (campus, 0.02), (schools, 0.01), (pan-
demic, 0.01), (students, 0.01)
7_china_chinese_wuhan_mainland (china, 0.13), (chinese, 0.07), (wuhan, 0.03), (mainland, 0.03), (tai-
wan, 0.03), (beijing, 0.02), (vaccine, 0.01), (virus, 0.01), (sinovac,
0.01), (covid19, 0.01)
8_trump_biden_gop_republican (trump, 0.09), (biden, 0.08), (gop, 0.02), (republican, 0.02), (taliban,
0.01), (democrat, 0.01), (senate, 0.01), (election, 0.01), (america,
0.01), (pelosi, 0.01)
9_australia_nsw_zealand_sydney (australia, 0.07), (nsw, 0.05), (zealand, 0.04), (sydney, 0.04), (auck-
land, 0.03), (nz, 0.02), (melbourne, 0.02), (queensland, 0.02), (aus-
pol, 0.01), (perthnews, 0.01)
10_philippine_duterte_manila_president (philippine, 0.06), (duterte, 0.04), (manila, 0.04), (president, 0.03),
(filipino, 0.03), (rodrigo, 0.02), (mayor, 0.02), (philippines, 0.02),
(covid19ph, 0.01), (presidential, 0.01)
11_mask_masks_covering_covid_19 (mask, 0.18), (masks, 0.04), (covering, 0.02), (covid_19, 0.01), (pro-
tect, 0.01), (vaccinated, 0.01), (pandemic, 0.01), (covid19, 0.01),
(masking, 0.01), (facemasks, 0.01)
12_oman_uae_covid2019_dubai (oman, 0.08), (uae, 0.08), (covid2019, 0.04), (dubai, 0.04), (qatar,
0.03), (saudi, 0.03), (covid19, 0.02), (arabia, 0.02), (emirate, 0.01),
(kuwait, 0.01)
13_russia_russian_azerbaijan_moscow (russia, 0.23), (russian, 0.07), (azerbaijan, 0.06), (moscow, 0.05),
(putin, 0.05), (vaccine, 0.03), (kremlin, 0.02), (sputnikv, 0.02),
(vladimir, 0.02), (kazakhstan, 0.01)
14_home_nursing_resident_outbreak (home, 0.17), (nursing, 0.15), (resident, 0.06), (outbreak, 0.03),
(homes, 0.03), (death, 0.03), (ontario, 0.01), (coronavirus, 0.01),
(elderly, 0.01), (residents, 0.01)
15_inmate_prison_jail_prisoner (inmate, 0.14), (prison, 0.13), (jail, 0.10), (prisoner, 0.06), (cor-
rectional, 0.03), (county, 0.03), (detainee, 0.02), (inmates, 0.02),
(prisons, 0.02), (incarcerated, 0.01)
16_malaysia_covid19malaysia_selangor_sabah (malaysia, 0.19), (covid19malaysia, 0.07), (selangor, 0.07), (sabah,
0.05), (malaysian, 0.04), (sarawak, 0.03), (infection, 0.02), (lumpur,
0.02), (johor, 0.02), (malaysians, 0.01)
17_scam_fraud_scammer_scams (scam, 0.09), (fraud, 0.05), (scammer, 0.03), (scams, 0.02), (counter-
feit, 0.02), (vaccine, 0.02), (fraudulent, 0.02), (cybersecurity, 0.01),
(fraudsters, 0.01), (certificate, 0.01)
18_racial_latino_hispanic_racism (racial, 0.04), (latino, 0.03), (hispanic, 0.03), (racism, 0.03), (minor-
ity, 0.02), (race, 0.02), (ethnic, 0.01), (vaccine, 0.01), (racist, 0.01),
(vaccination, 0.01)
19_turkey_turkish_covid19_health (turkey, 0.30), (turkish, 0.08), (covid19, 0.03), (health, 0.02), (num-
ber, 0.02), (vaccine, 0.02), (istanbul, 0.02), (erdogan, 0.02), (000,
0.01), (country, 0.01)
20_brazil_bolsonaro_brazilian_chile (brazil, 0.24), (bolsonaro, 0.07), (brazilian, 0.06), (chile, 0.05),
(america, 0.04), (country, 0.02), (covid19, 0.01), (coronavirus, 0.01),
(caribbean, 0.01), (rio, 0.01)
21_israel_israeli_palestinian_jewish (israel, 0.24), (israeli, 0.09), (palestinian, 0.05), (jewish, 0.04), (gaza,
0.03), (judaism, 0.02), (palestine, 0.02), (jew, 0.01), (jerusalem,
0.01), (holocaust, 0.01)
22_pregnancy_breastfeeding_fertility_women (pregnancy, 0.10), (breastfeeding, 0.08), (fertility, 0.04), (women,
0.04), (vaccine, 0.03), (vaccination, 0.03), (lactating, 0.03), (vacci-
nated, 0.02), (covidvaccine, 0.01), (unborn, 0.01)
23_france_french_macron_paris (france, 0.28), (french, 0.12), (macron, 0.08), (paris, 0.03), (presi-
dent, 0.02), (covid19, 0.02), (covid_19, 0.01), (country, 0.01), (coro-
navirusfrance, 0.01), (travel, 0.01)
Continued on next page
1544Table 21: Cluster Names and Word Scores - COVID-19
Cluster Name Word Scores
24_hawaii_hinews_bigislandnews_hawaiinews (hawaii, 0.22), (hinews, 0.12), (bigislandnews, 0.11), (hawaiinews,
0.11), (island, 0.05), (hawaiicountynews, 0.04), (oahu, 0.04), (hon-
olulu, 0.03), (maui, 0.02), (kaua, 0.02)
25_cruise_ship_navy_seafarer (cruise, 0.16), (ship, 0.12), (navy, 0.04), (seafarer, 0.03), (sailor,
0.03), (caribbean, 0.03), (vessel, 0.02), (ferry, 0.02), (maritime,
0.01), (carnival, 0.01)
26_iran_iranian_coronavirus_tehran (iran, 0.30), (iranian, 0.09), (coronavirus, 0.04), (tehran, 0.03),
(khamenei, 0.03), (country, 0.02), (covid19, 0.02), (vaccine, 0.02),
(covid_19, 0.01), (azerbaijan, 0.01)
27_italy_italian_rome_covid_19 (italy, 0.24), (italian, 0.07), (rome, 0.02), (covid_19, 0.02), (coron-
avirus, 0.01), (sur, 0.01), (covid19, 0.01), (country, 0.01), (france,
0.01), (lombardy, 0.01)
28_singapore_imported_infection_singaporean (singapore, 0.37), (imported, 0.07), (infection, 0.06), (singaporean,
0.03), (changi, 0.03), (dorm, 0.02), (airport, 0.02), (dormitory, 0.01),
(transmitted, 0.01), (ttsh, 0.01)
29_delta_variant_deltavariant_vaccinated (delta, 0.26), (variant, 0.21), (deltavariant, 0.03), (vaccinated, 0.02),
(vaccine, 0.01), (surge, 0.01), (unvaccinated, 0.01), (covid19, 0.01),
(variants, 0.01), (deltaplus, 0.01)
30_jamaica_glnrtoday_coronameter_jamaican (jamaica, 0.17), (glnrtoday, 0.05), (coronameter, 0.05), (jamaican,
0.04), (hospitalised, 0.04), (barbados, 0.02), (recoveries, 0.02), (died,
0.02), (glnroped, 0.02), (investigation, 0.02)
31_app_tracing_covidalert_tracer (app, 0.19), (tracing, 0.12), (covidalert, 0.06), (tracer, 0.03), (apps,
0.03), (privacy, 0.02), (tracking, 0.02), (covid19, 0.02), (google,
0.01), (trace, 0.01)
Table 22: Cluster Names and Word Scores - Military Vehicles
Cluster Name Word Scores
0_flying_aircraft_helicopter_aviation (flying, 0.02), (aircraft, 0.02), (helicopter, 0.02), (aviation, 0.01),
(spitfire, 0.01), (flight, 0.01), (raf, 0.01), (jet, 0.01), (plane, 0.01),
(fly, 0.01)
1_tank_abrams_army_m1 (tank, 0.07), (abrams, 0.04), (army, 0.03), (m1, 0.02), (m1a2, 0.02),
(tanks, 0.01), (m1a1, 0.01), (armored, 0.01), (turret, 0.01), (armor,
0.01)
2_rafale_india_france_iaf (rafale, 0.08), (india, 0.04), (france, 0.03), (iaf, 0.03), (mirage2000,
0.02), (jet, 0.02), (dassault, 0.02), (aircraft, 0.02), (combat, 0.01),
(greece, 0.01)
-1_whatshappeninginmyanmar_military_wa_jet (whatshappeninginmyanmar, 0.02), (military, 0.02), (wa, 0.02), (jet,
0.01), (aircraft, 0.01), (helicopter, 0.01), (plane, 0.01), (landed, 0.01),
(flight, 0.01), (flying, 0.01)
3_crashed_jet_plane_pilot (crashed, 0.05), (jet, 0.03), (plane, 0.03), (pilot, 0.03), (abuja, 0.02),
(killed, 0.02), (nigerian, 0.02), (airport, 0.02), (aircraft, 0.02), (nige-
ria, 0.02)
4_syria_iran_syrian_israel (syria, 0.06), (iran, 0.04), (syrian, 0.04), (israel, 0.02), (turkey, 0.02),
(russia, 0.02), (yemen, 0.02), (libya, 0.01), (gaza, 0.01), (iraq, 0.01)
5_typhoon_eurofighter_raf_aviation (typhoon, 0.21), (eurofighter, 0.20), (raf, 0.03), (aviation, 0.02), (war-
planeporn, 0.02), (jet, 0.01), (luftwaffe, 0.01), (aviationphotography,
0.01), (tornado, 0.01), (squadron, 0.01)
6_drone_ai_uav_drones (drone, 0.18), (ai, 0.05), (uav, 0.04), (drones, 0.03), (unmanned,
0.02), (tech, 0.02), (hacker, 0.02), (uas, 0.02), (intelligence, 0.01),
(artificial, 0.01)
7_whatshappeninginmyanmar_myanmar_yangon_junta (whatshappeninginmyanmar, 0.09), (myanmar, 0.07), (yangon, 0.05),
(junta, 0.04), (terrorist, 0.02), (savemyanmar, 0.02), (whatshappen-
inglnmyanmar, 0.02), (protester, 0.02), (coup, 0.02), (violence, 0.02)
8_tornado_raf_flying_aviation (tornado, 0.20), (raf, 0.06), (flying, 0.04), (aviation, 0.02), (aeroplane,
0.02), (squadron, 0.01), (aircraft, 0.01), (jet, 0.01), (airtoair, 0.01),
(flypast, 0.01)
9_china_taiwan_chinese_southchinasea (china, 0.12), (taiwan, 0.12), (chinese, 0.10), (southchinasea, 0.02),
(aircraft, 0.02), (airspace, 0.02), (taiwanstrait, 0.02), (beijing, 0.02),
(japan, 0.02), (luzonstrait, 0.01)
Continued on next page
1545You can also read