Future projections of High Atlas snowpack and runoff under climate change - HESS
←
→
Page content transcription
If your browser does not render page correctly, please read the page content below

Hydrol. Earth Syst. Sci., 26, 571–588, 2022
https://doi.org/10.5194/hess-26-571-2022
© Author(s) 2022. This work is distributed under
the Creative Commons Attribution 4.0 License.

Future projections of High Atlas snowpack
and runoff under climate change
Alexandre Tuel1,a , Nabil El Moçayd2 , Moulay Driss Hasnaoui3 , and Elfatih A. B. Eltahir1
1 Ralph M. Parsons Laboratory, Massachusetts Institute of Technology, 15 Vassar St., Cambridge, 02139, USA
2 International  Water Research Institute, University Mohammed VI Polytechnique,
Lot 660 Hay Moulay Rachid, 43150 Ben Guerir, Morocco
3 Ministry of Equipment, Transport, Logistics and Water, Department of Water, Rabat, Morocco
a current affiliation: Institute of Geography, Oeschger Centre for Climate Change Research,

University of Bern, Bern, Switzerland

Correspondence: Alexandre Tuel (alexandre.tuel@giub.unibe.ch)

Received: 26 November 2020 – Discussion started: 18 December 2020
Revised: 23 November 2021 – Accepted: 7 January 2022 – Published: 2 February 2022

Abstract. The High Atlas, culminating at more than 4000 m,      tion are expected to lead to severe (20 %–70 %) declines in
is the water tower of Morocco. While plains receive less        river discharge. Our results have important implications for
than 400 mm of precipitation in an average year, the moun-      water resources planning and sustainability of agriculture in
tains can get twice as much, often in the form of snow be-      this already water-stressed region.
tween November and March. Snowmelt thus accounts for a
large fraction of the river discharge in the region, particu-
larly during spring. In parallel, future climate change pro-
jections point towards a significant decline in precipitation
and enhanced warming of temperature for the area. Here,         1   Introduction
we build on previous research results on snow and climate
modelling in the High Atlas to make detailed projections        The High Atlas is the major source of freshwater for the
of snowpack and river flow response to climate change in        semi-arid plains of central Morocco. Much of the discharge
this region. We develop end-of-century snowpack projec-         of the Oum-Er-Rbia and Tensift, the two main rivers of cen-
tions using a distributed energy balance snow model based on    tral Morocco, comes from the mountainous terrain where
SNOW-17 and high-resolution climate simulations over Mo-        they begin their course. In this region, precipitation essen-
rocco with the MIT Regional Climate Model (MRCM) un-            tially falls at elevations above 1000 m (Boudhar et al., 2009);
der a mitigation (RCP4.5) and a business-as-usual (RCP8.5)      below that, it is scarce, and evaporation is extremely high,
scenario. Snowpack water content is projected to decline by     leading to minimal runoff. Though located in a rather warm
up to 60 % under RCP4.5 and 80 % under RCP8.5 as a con-         region, the High Atlas rises up to more than 4000 m and of-
sequence of strong warming and drying in the region. We         ten experiences below-freezing conditions between Novem-
also implement a panel regression framework to relate runoff    ber and March (Boudhar et al., 2009). Consequently, snow
ratios to regional meteorological conditions in seven small     is a major component of the regional water cycle (Marchane
sub-catchments in the High Atlas. Relative humidity and the     et al., 2015; Tuel et al., 2020). It accounts for a substantial
fraction of solid-to-total precipitation are found to explain   fraction of annual runoff, up to 50 % in some mountain catch-
about 30 % of the inter-annual variability in runoff ratios.    ments (Boudhar et al., 2009), and for most of the runoff dur-
Due to projected future atmospheric drying and the associ-      ing spring, as the wet season comes to an end. Snow cover in
ated decline in snow-to-precipitation ratio, a 5 %–30 % de-     the High Atlas is characterised by large inter-annual variabil-
crease in runoff ratios and 10 %–60 % decrease in precipita-    ity (Marchane et al., 2015; Tuel et al., 2020), mostly follow-
                                                                ing that in wet-season precipitation, itself largely shaped by

Published by Copernicus Publications on behalf of the European Geosciences Union.
572                            A. Tuel et al.: Future projections of High Atlas snowpack and runoff under climate change

the North Atlantic Oscillation (Knippertz et al., 2003; Boud-      warmer and drier climate will have substantial impacts on the
har et al., 2009).                                                 High Atlas snowpack. We develop detailed snowpack pro-
   Previous studies indicate that the High Atlas snowpack          jections for the High Atlas under climate change and assess
may be particularly vulnerable to climate change. Climate          the implications of a declining snowpack on regional runoff.
projections over Morocco – and generally the Mediterranean         We focus on the Oum-Er-Rbia watershed, a major catch-
– agree on robust warming and drying trends under green-           ment of the High Atlas. To that end, we apply the method-
house gas forcing (Cramer et al., 2018; Lionello and Scaras-       ology of Tuel et al. (2020) (hereafter T20a), who modelled
cia, 2018; Drobinski et al., 2020; Tuel and Eltahir, 2020).        High Atlas snowpack by applying a simple distributed snow
By the end of this century, average winter temperatures            model forced with assimilated remotely sensed and dynam-
in the High Atlas could be 2–4 ◦ C higher and precipita-           ically downscaled data. Using satellite-observed snow cover
tion 25 %–60 % lower, depending on the emissions scenario          as a baseline for the current climate, we fit and run the snow
(Ayt Ougougdal et al., 2020; Driouech et al., 2020; Tuel et al.,   model with output data from high-resolution regional climate
2021). These combined warming and drying trends will un-           simulations over Morocco obtained by Tuel et al. (2021).
avoidably lead to a snowpack decline. Yet, few studies have        We then quantify the sensitivity of runoff in seven mountain
analysed climate change impacts on the local snowpack and          catchments within the Oum-Er-Rbia watershed to large-scale
regional water availability. López-Moreno et al. (2017) ap-        meteorological and snowpack conditions and use the results
plied a complex physically based snow model to observed            to assess the impact of warming, drying and snowpack dis-
meteorological data at one station in the Moroccan High At-        appearance on runoff.
las, fitted with observed snow depth at the same location.
They found that High Atlas snowpack was less sensitive to
warming and drying than that in other Mediterranean-climate        2   Study area
regions (10 %–15 % snow water equivalent decline per de-
gree of warming) because of colder snowpack temperatures           With a length of 550 km, the Oum-Er-Rbia is Morocco’s sec-
associated with high latent heat losses. Still, their results      ond longest river (Fig. 1c). There is about 4 km3 of avail-
pointed to a decrease in average snow duration of 25 %–30 %        able renewable water resources in its basin each year, most
and in mean snow water equivalent (SWE) of 30 %–55 %               of which comes from surface runoff (3.5 km3 ), the rest being
by 2050.                                                           groundwater (Agence du Bassin Hydraulique de l’Oum-Er-
   Future trends in runoff in the High Atlas under climate         Rbia, 2012). A proportion of 90 % of this water is used to ir-
change have also been investigated, notably by Jaw et al.          rigate 350 000 ha of fields, accounting for 30 % of Morocco’s
(2015) who analysed simulations with the variable infiltra-        irrigated land, with the rest supporting the needs of two ma-
tion capacity model forced by regional climate model out-          jor cities, Casablanca and Marrakech, and industrial phos-
put. They found a general tendency to reductions in stream-        phate mining. In addition, mountain runoff is used to gener-
flow, with a strong sensitivity to the forcing model’s precip-     ate hydroelectricity. The Oum-Er-Rbia river begins its course
itation trends. Tramblay et al. (2018) took a simple water-        in the northeastern portion of the High Atlas, near the city of
balance approach, equating long-term net precipitation with        Khenifra; as it flows westwards towards the Atlantic Ocean,
water availability, to estimate future changes in dam stor-        it receives major contributions from northward-flowing trib-
age across North Africa. In the High Atlas, they projected         utaries originating in the High Atlas (Fig. 1c). Beyond that,
a 40 %–50 % decline in water availability under business-as-       the river continues its course in semi-arid plains which bring
usual scenarios by the end of the 21st century. Only one study     little additional runoff.
tried to quantify the impact of climate change on High At-             The climate of the area is rather continental, characterised
las runoff by taking snow dynamics into account: Marchane          by a large amplitude in the annual cycle of temperature
et al. (2017) developed runoff projections for the Rheyara         (Knippertz et al., 2003). Minimum temperatures occur in
catchment, south of Marrakech and part of the Tensift water-       January, when they range from mild (≈ 12 ◦ C) below 1000 m
shed, by running conceptual monthly water-balance models           to cold (−5 ◦ C) above 3000 m. Temperatures reach their peak
incorporating a simple parametric snow module. They pro-           in July, at about 35 ◦ C below 1000 m and 10–15 ◦ C above
jected a 19 %–63 % decline in surface runoff by the middle of      3000 m (Ouatiki et al., 2017). Annual precipitation in the
the century, dependent on model and scenario. Coupled with         whole basin averages about 400 mm, with a low of 250 mm in
population growth, such trends, if realised, will inevitably       the lowland plains and a high of 800 mm in the mountains to
translate into growing unmet water demand, as shown by             the south (Ouatiki et al., 2017). Most of that precipitation oc-
Ayt Ougougdal et al. (2020) for the Ourika watershed in the        curs between October and May, when the region is under the
High Atlas.                                                        influence of North Atlantic westerlies (Knippertz et al., 2003;
   Thus, while it is clear that the region is headed towards a     Tuel and Eltahir, 2018). Mountainous areas also experience
pronounced decline in snowpack and runoff, much remains            substantial precipitation during summer, due to small-scale
to be done to quantify that decline at the catchment level         convection (Born et al., 2008). As a consequence, vegetation
and reduce uncertainties. In this study, we hypothesise that a     outside the lower elevation valleys is sparse, essentially lim-

Hydrol. Earth Syst. Sci., 26, 571–588, 2022                                          https://doi.org/10.5194/hess-26-571-2022

A. Tuel et al.: Future projections of High Atlas snowpack and runoff under climate change                                                573

Figure 1. (a) Location of our study area within Morocco (shading: elevation; see colour bar in c). (b) Annual cycles of precipitation for the
seven catchments, based on TRMM data (1998–2015). (c) Map of the Oum-Er-Rbia watershed, with elevation shown by shaded contours.
The main waterways are indicated by solid blue lines. Blue diamonds and red circles indicate the location of precipitation and river discharge
stations, respectively. The snow modelling domain is shown by the dashed red line. The seven catchments defined by the discharge stations
are shown by solid black lines and are indicated by numbers: (1) Tarhat, (2) Chacha, (3) Ouchene, (4) Tillouguite, (5) Moulay Hassan,
(6) Segmine and (7) Tamesmate. The location of the Oukaimeden snow station, outside our study area, is shown by a black cross.

ited to bare soil, grass and occasional shrubs (Baba et al.,             3     Data and methods
2019). Snowfall is common between November and March
above 1500 m elevation, and it is frequent to observe snow               3.1     Data
cover persisting for several months above 2500 m (Marchane
et al., 2015). Inter-annual variability of snow cover is sub-            3.1.1    Hydroclimatological data
stantial, however, following that of precipitation (Boudhar
et al., 2010). Melt begins in February, and the snowpack is              We use for this study a mixture of model-, station-
typically gone by the end of May (Tuel et al., 2020).                    and satellite-based hydrometeorological data (see Table 1).
   We focus specifically on the 13 610 km2 domain anal-                  Model-based data are described in Sect. 3.1.2. Daily pre-
ysed by T20a (Fig. 1c), which encompasses most of the                    cipitation data are available at seven stations in the study
area above 1000 m altitude within the Oum-Er-Rbia water-                 area, including three at more than 1200 m elevation, over the
shed and thus most regions that receive significant snowfall             1980–2015 period (Fig. 1c) (see also Table A1). For each
(Marchane et al., 2015). Elevation in this domain ranges from            precipitation series, we conduct basic quality checks follow-
621 to 3890 m, with an average of 1882 m.                                ing Durre et al. (2010). We then discard all the months for
                                                                         which more than 10 % of the data are missing or flagged. This
                                                                         leaves more than 95 % of the data for analysis. These data are

https://doi.org/10.5194/hess-26-571-2022                                                  Hydrol. Earth Syst. Sci., 26, 571–588, 2022
574                              A. Tuel et al.: Future projections of High Atlas snowpack and runoff under climate change

Figure 2. (a) Annual cycles of monthly runoff at the seven runoff gauges, after base flow removal and normalisation by catchment area (km2 ).
(b) Box plot of annual runoff coefficients for the seven catchments (1982–2011), using ERA/MRCM precipitation bias-corrected with TRMM
data.

Table 1. Overview of datasets used in this study.

   Data                                       Description                                                 Availability
   Station precipitation                      Daily precipitation measured at seven locations in the      1980–2015
                                              Oum-Er-Rbia watershed
   Station discharge                          Daily discharge measured at seven locations in the          1978–2015
                                              Oum-Er-Rbia watershed
   TRMM TMPA 3B42 version 7                   Satellite-based 3-hourly precipitation at 0.25◦             1998–present
                                              resolution
   CHIRPS v2.0                                Satellite- and station-based 6-hourly precipitation at      1981–present
                                              0.05◦ resolution
   MODIS Land Surface Temperature L3          Satellite-based land surface temperature at 1 km            2000–present
   version 6 (MOD11A1)                        resolution
   MODIS Terra snow cover daily L3            Satellite-based fractional snow cover at 500 m              2000–present
   (MOD10A1)                                  resolution
   ERA/MRCM                                   Regional downscaling of ERA-Interim with MRCM at            1981–2011
                                              12 km resolution (from Tuel et al., 2020b)
   ERA/GCM                                    Regional downscaling of three CMIP5 GCMs                    1976–2005 (historical) and
                                              (IPSL-CM5A-LR, GFDL-ESM2M and                               2071–2100 (RCP4.5 and
                                              MPI-ESM-MR) with MRCM at 12 km resolution                   RCP8.5)
                                              (from Tuel et al., 2020b)
   SRTM 90 m resolution version 4.1           Satellite-based elevation at 90 m resolution                n/a
   (STRM90)

 n/a: not applicable.

used to check the validity of the satellite precipitation prod-          (2018). Days with negative discharge are flagged, as well as
ucts described below. In addition, daily discharge measure-              all consecutive periods of more than 10 d during which dis-
ments are available at seven locations as well, between 1978             charge values are equal and larger than zero. We also flag as
and 2015. Each has at most 0.5 % of missing data. We imple-              suspect daily discharge values Q such that log(Q + 0.01) is
ment a simple quality control following Gudmundsson et al.               more than 6 standard deviations away from its mean value,

Hydrol. Earth Syst. Sci., 26, 571–588, 2022                                                     https://doi.org/10.5194/hess-26-571-2022
A. Tuel et al.: Future projections of High Atlas snowpack and runoff under climate change                                       575

Table 2. Characteristics of the seven analysed sub-basins.          scale topography data. In our region of focus, TRMM and
                                                                    CHIRPS show some differences (Fig. 3a and b): CHIRPS
              Name                 Area      Mean                   is notably wetter, particularly near the Tizi N’isly station. A
                                  (km2 )   elevation                comparison of monthly values with the four available sta-
                                              (m)                   tions above 1000 m suggests a rather dry bias in TRMM and
              Tarhat                997      1627                   inconsistent biases in CHIRPS (Fig. 3c and d). Both datasets
              Chacha               1519      1460                   have a dry bias over the northeastern corner of our domain
              Ouchene              2391      1953                   (around the Kenifra station). Across the four stations shown
              Tillouguite          2488      2363                   in Fig. 3, absolute biases range from 13–26 mm for TRMM
              Moulay Hassan        1700      2124                   and from 18–25 mm for CHIRPS. Our purpose here is not to
              Segmine               506      1897                   perform an in-depth comparison of the performance of the
              Tamesmate            1303      2198                   two datasets but to test the robustness of the runoff projec-
                                                                    tion results to variability in reference precipitation. To bias-
                                                                    correct regional climate model output for snow modelling
                                                                    (Sect. 3.1), however, we follow T20a and consider only the
with mean and standard deviation computed over a 10 d pe-           TRMM dataset.
riod around the corresponding calendar day over the whole              Reference surface air temperature is derived from MODIS
time series.                                                        Land Surface Temperature (LST) product MOD11A1 L3
   The locations of the discharge stations define seven sub-        version 6 at 1 km resolution (Wan et al., 2015). We refer
catchments for which runoff will be analysed, from north to         to T20a for details on data filling and correction. Observed
south: Tarhat, Chacha, Ouchene, Tillouguite, Moulay Has-            snow cover area for the region is extracted from the MODIS
san, Segmine and Tamesmate (Fig. 1c). Area and average ele-         Terra snow cover daily L3 product (MOD10A1) at 500 m res-
vation for each catchment are given in Table 2. Their average       olution (Hall and Riggs, 2016). Snow cover is detected us-
elevation varies from 1460 to 2360 m. We remove the contri-         ing values of the normalised difference snow index, based
bution from base flow by subtracting the minimum monthly            on reflectances in the visible/near-infrared and middle in-
discharge value for each catchment and each hydrological            frared. We apply the correction methodology described in
year (September–August). This correction is minor for all           Marchane et al. (2015), which allows us to substantially re-
catchments except Tarhat, the northernmost one, which in-           duce the number of missing data points (which are mainly
cludes the headwaters of the Oum-Er-Rbia river and receives         due to the presence of clouds) and average the data at the
a substantial contribution of base flow to its annual discharge.    weekly timescale as in T20a. We refer to these two stud-
In particular, the flow at Tarhat remains high during sum-          ies for a discussion of the accuracy of the MODIS dataset
mer (≈ 35 % of its wet-season peak), likely due to ground-          in this region. All MODIS data are available from Febru-
water discharge from deep mountain aquifers. Annual cycles          ary 2000 to present. Elevation data are taken from the Shut-
of corrected monthly discharge are shown in Fig. 2a.                tle Radar Topography Mission 90 m resolution dataset ver-
   Satellite-based data are used for basin-wide precipita-          sion 4.1 (STRM90) (Jarvis et al., 2008) and interpolated to
tion, temperature and snow cover. The 3-hourly precipitation        the approximate 1 km resolution of the MODIS land surface
from the TRMM TMPA (TRMM Multi-Satellite Precipita-                 temperature data.
tion Analysis) 3B42 version 7 dataset is used as the reference
precipitation dataset for the region. It consists in remotely       3.1.2   Regional climate simulations
sensed data corrected with rain gauge data on a monthly ba-
sis (Huffman et al., 2007). The data cover the period 1998          We use the regional climate downscaling data and pro-
to present, at a resolution of 0.25◦ . While satellite-based pre-   jections developed by Tuel et al. (2021) for the western
cipitation data suffer from numerous biases (Milewski et al.,       Mediterranean, at a 12 km resolution, using the MIT Re-
2015; Derin et al., 2016; Hashemi et al., 2017), they are often     gional Climate Model (MRCM). MRCM is based on the
the only option available in complex terrain where stations         Abdus Salam International Centre for Theoretical Physics
are scarce. Milewski et al. (2015) and Ouatiki et al. (2017)        Regional Climate Model Version 3 (RegCM3) (Pal et al.,
assessed the accuracy of the TRMM 3B42 V7 dataset in the            2007) but with significant enhancements of model physics
Oum-Er-Rbia and found that, although unreliable at the daily        and notably a coupling with the Integrated BIosphere Sim-
timescale, it offered satisfactory estimates of precipitation if    ulator land surface scheme (IBIS). Dynamical downscal-
averaged in space or time. Annual cycles of TRMM precipi-           ing is performed for ERA-Interim (1982–2011) (Dee et al.,
tation for the seven catchments are shown in Fig. 1b.               2011) as well as three carefully selected global climate
   For comparison, we also consider the CHIRPS dataset,             models (GCMs) from the Coupled Model Inter-comparison
available from 1981 onwards at a 0.05◦ resolution (Funk             Project Phase 5 (CMIP5) (Taylor et al., 2012): MPI-ESM-
et al., 2015). CHIRPS is produced by combining high-                MR, GFDL-ESM2M and IPSL-CM5A-LR, for the histori-
resolution satellite-based precipitation with station and fine-     cal (1976–2005) and RCP4.5 and 8.5 (2071–2100) scenarios.

https://doi.org/10.5194/hess-26-571-2022                                            Hydrol. Earth Syst. Sci., 26, 571–588, 2022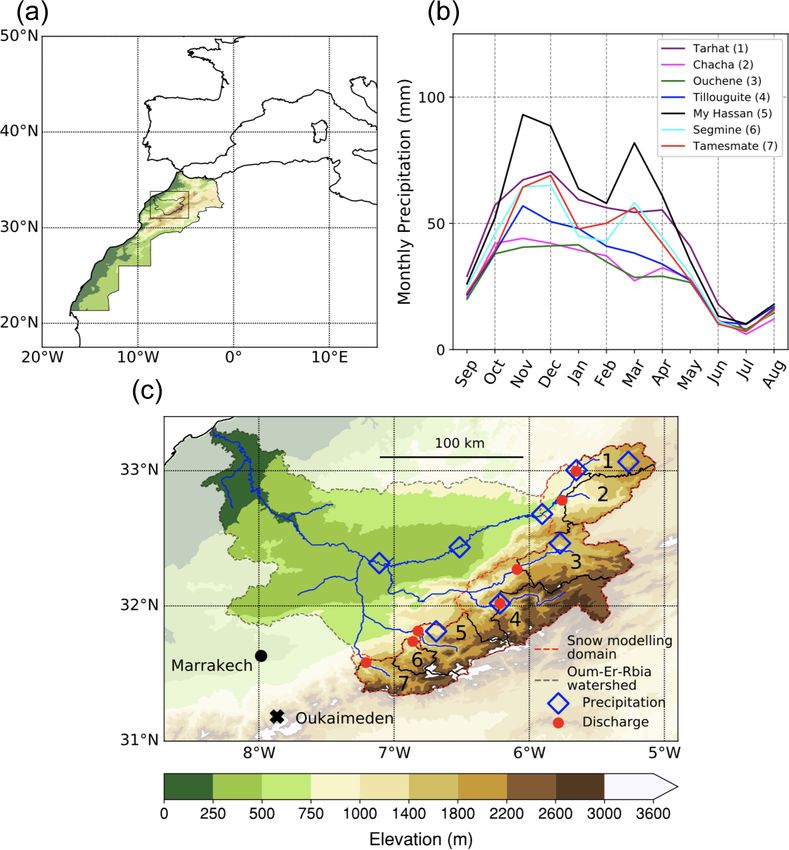
576                             A. Tuel et al.: Future projections of High Atlas snowpack and runoff under climate change

Figure 3. (a) October–May average precipitation (mm) over the Oum-Er-Rbia watershed, from TRMM (1998–2015). The four available
precipitation stations above 1000 m elevation are indicated by symbols. (c) Monthly precipitation at the four stations shown in (a) against
corresponding TRMM values. (b, d) Same as (a, c) but for the CHIRPS dataset (1981–2015).

Details of the simulations, including model setup and perfor-           the MODIS LST-derived air temperature and TRMM pre-
mance, can be found in Tuel et al. (2021).                              cipitation at their native resolutions as respective targets,
                                                                        via the cumulative distribution function transform method
3.2     Methods                                                         (Michelangeli et al., 2009). Alone among the three GCMs,
                                                                        the IPSL-CM5A-LR model exhibits a negative bias on wet
The methodological framework adopted in this study is sum-              days that we correct at each grid cell by randomly gener-
marised in Fig. 4. We start from GCM simulations from the               ating wet days of magnitude drawn from the corresponding
CMIP5 archive, dynamically downscaled with MRCM. We                     distribution of wet-day precipitation in the TRMM dataset.
apply bias correction to the MRCM output, using observed                For bias correction, reference periods for “perfect” observa-
and ERA-Interim data downscaled with MRCM as the tar-                   tions are 1998–2011 for TRMM and 2000–2011 for MODIS.
get, which we then feed into a 1 km resolution snow model               The corresponding periods in the simulations are the same
over our study region to reconstruct snowpack under the var-            for ERA/MRCM and the 1992–2005 and 1994–2005 peri-
ious emissions scenarios. Finally, a statistical model is de-           ods, respectively, for each of the GCM-driven simulations.
veloped for catchment runoff coefficients (RCs), in order to            All bias corrections are performed for the cold (November–
make projections of runoff under future climate conditions.             April) and warm (May–October) seasons separately. As to
                                                                        other variables, for which reliable observations are not avail-
3.2.1    Bias correction and statistical downscaling
                                                                        able, the output from the ERA-Interim run (hereafter referred
                                                                        to as ERA/MRCM) is taken as “ground truth”. Therefore,
The 6-hourly wind speed, specific humidity, air temperature,
                                                                        wind speed, downward long- and shortwave radiation and
precipitation, and downward longwave and shortwave data
                                                                        specific humidity in the GCM runs are bias-corrected against
are extracted from the MRCM output over our domain, at
                                                                        the ERA/MRCM values over the 1982–2005 reference pe-
the 12 km MRCM resolution. We then bias-correct MRCM
                                                                        riod.
output when reliable observations are available and down-
                                                                           The downscaling to the MODIS 1 km resolution is then ob-
scale it to the MODIS 1 km resolution at which we run the
                                                                        tained as follows. Precipitation, downward long- and short-
snow model (Sect. 3.2.2). Air temperature and precipitation
                                                                        wave and wind are simply downscaled with no elevation cor-
in all MRCM runs (ERA-Interim- and GCM-driven simu-
                                                                        rection, keeping the 12 km grid value for all the 1 km grid
lations) are bias-corrected at the 6-hourly timescale using

Hydrol. Earth Syst. Sci., 26, 571–588, 2022                                                https://doi.org/10.5194/hess-26-571-2022
A. Tuel et al.: Future projections of High Atlas snowpack and runoff under climate change                                      577

Figure 4. Summary of methodology and input datasets used to assess climate change impacts on snowfall, snowpack and runoff in the
Oum-Er-Rbia watershed.

cells. Specific humidity, however, is downscaled with a lapse
rate µ estimated empirically from the simulations at each          SC = 0.85 × tanh(k · SWE),                                  (2)
time step:
                                                                   with k = 100. We select 0.85 as the maximum allowable
log(q) = log (q12 ) + µ · (z − z12 ) ,                     (1)     snow-covered fraction because snow fraction values larger
                                                                   than 85 % are extremely rare in the 500 m MODIS data,
where q12 is the specific humidity in a given 12 km resolu-        even at high elevations. This likely reflects the strong small-
tion grid cell of elevation z12 and q the downscaled value at      scale variability of snow cover in the High Atlas (Baba
elevation z. No additional downscaling for temperature data        et al., 2019). The snow model requires three parameters to
is required since the downscaling is embedded into the bias-       be optimised: Mf (melt factor), NMFmax (maximum neg-
correction step. The target MODIS LST-derived air temper-          ative melt factor) and TIPM (coefficient used in updating
ature data in the bias correction are indeed already at the re-    snowpack temperature) (Anderson, 2006). In keeping with
quired 1 km resolution.                                            T20a, parameter calibration is performed by maximising the
                                                                   Nash–Sutcliffe coefficient (Nash and Sutcliffe, 1970) be-
3.2.2   Snow model
                                                                   tween the annual cycles of observed (MODIS) and simulated
We apply the SNOW-17 model (Anderson, 2006) with a                 snow cover at 250 randomly selected grid points within the
radiation-derived temperature index for melt (Follum et al.,       snow domain. We force the elevation distribution of these
2015) as described in T20a. SNOW-17 simulates snow accu-           250 points to match that of the whole domain. The an-
mulation and loss based on meteorological variables and ac-        nual cycles are computed for the 1995–2005 period in the
counts for the various energy balance equation terms. Snow-        GCM-driven simulations, the 2000–2011 period in the ERA-
pack is characterised by its snow water equivalent (SWE)           Interim simulation and the 2000–2011 period in the MODIS
and heat deficit, defined as the amount of heat (in equiva-        series. Parameters are calibrated independently for each of
lent millimetres of SWE) required to bring its temperature         the simulations (ERA-Interim and three GCMs) in their re-
up to freezing point. We also integrate the bulk-aerodynamic       spective reference periods. For the future simulations, param-
formulation of sublimation detailed in T20a. Readers are re-       eter values are kept constant, equal to their calibrated values.
ferred to Follum et al. (2015) and Anderson (2006) for more           In the analysis of model results, a special focus is given
details about SNOW-17.                                             to current and future sublimation fluxes. Due to the particu-
   We run the model at a 6-hourly time step and at the na-         larly arid climate of the High Atlas, sublimation losses are
tive MODIS LST 1 km resolution over the domain depicted            indeed quite significant in our study area: about 9 % of all
in Fig. 1c. Model output includes SWE, as well as melt and         snowfall on average and up to 30 % above 3500 m (Schulz
sublimation fluxes at each time step. Following T20a and           and de Jong, 2004; López-Moreno et al., 2017; T20a).
Boudhar et al. (2011), SWE is then translated into snow cover
fraction for each grid cell using the following relationship:

https://doi.org/10.5194/hess-26-571-2022                                           Hydrol. Earth Syst. Sci., 26, 571–588, 2022
578                                A. Tuel et al.: Future projections of High Atlas snowpack and runoff under climate change

3.2.3   Statistical modelling of runoff coefficients                 the remaining, non-selected ones brings any improvement.
                                                                     To estimate the sensitivity of RC to changes in climate con-
We model catchment runoff coefficients (RCs), defined as             ditions, we modify covariate values in the 1982–2011 ERA-
total October–May discharge divided by total October–May             Interim downscaled simulation by adding projected long-
precipitation, across time and space as functions of large-          term changes in the GCM-driven simulations:
scale hydrological variables by adopting a panel regression               m                  X  i
                                                                                                                  i
framework. Panel regression allows us to enhance the effec-          log RCc
                                                                              j,t = log RC  j  +     β i Xj,t + X m ,         (4)
tive size of a dataset and to obtain more robust estimates of                                     i∈I
the response to selected covariates compared to more tra-            where m ∈ {1, 2, 3} is model index, I is the set of optimal co-
ditional regression approaches (Steinschneider et al., 2013;                    i denotes the ERA-Interim downscaled covariate
                                                                     variates, Xj,t
Davenport et al., 2020). It also allows us to account for static                     i
(space-dependent) and time-varying (time-dependent) fac-             values and Xm represents long-term covariate changes drawn
tors, although here, with only seven catchments, we do not           at random according to
have enough data to make robust statements about static fac-
                                                                                                q
                                                                       i
tors responsible for the disparity in average RC (Fig. 2b).          X m ∼ N µim,rcp − µim,hist , σm,rcp
                                                                                                    i       i
                                                                                                         + σm,hist   ,       (5)
Therefore, we focus on time-varying covariates and consider
a fixed-effects formulation:                                         where µim,s (σm,s
                                                                                   i ) is the average (standard deviation) of co-

                          X                                         variate i in model m and scenario s. Results for the three
                                     i

log RCj,t = log RCj +           βi Xj,t + j,t ,             (3)     models are then pooled together to yield a future distribution
                               i                                     for RCj,t .
where j ∈ {1, . . . , 7} is the catchment index, t is the time in-
dex, i is the covariate index, RCj represents time-invariant,        4     Results
watershed-specific fixed effects (drainage area, land cover,
mean climate), Xj,t   i denotes the covariates, β denotes re-
                                                    i                4.1    Snowpack modelling and projections
gression coefficients and j,t is random noise. For covari-
ates, we consider catchment-averaged October–May precip-             Annual cycles of reconstructed snow cover as a function of
itation (P ), relative humidity (RH), temperature (T ), snow         elevation are shown in Fig. 5. Overall, all models succeed in
water equivalent (SWE) and snow fraction of precipita-               accurately reproducing snow cover dynamics in the region,
tion (SF). Runoff has indeed been shown to be sensitive              although the ERA-Interim simulation tends to have a positive
to these variables (e.g., Berghuijs et al., 2017). Indeed, en-       bias at high elevations, particularly above 3000 m (Fig. 5b),
hanced precipitation or relative humidity leads to wetter soils      and all simulations have a negative bias at low elevations
and can be expected to be associated with higher RC val-             (Figs. 5d, e and 5a, b). The GCM-driven experiments gen-
ues. Similarly, higher temperatures increase evapotranspira-         erally show too little snow cover and a later snowpack build-
tion and tend to decrease runoff. Finally, increased snow            up (Fig. 5f). December–March average snow cover over the
cover favours losses by sublimation and shifts the distribu-         whole modelled area reaches 1460 km2 in MODIS observa-
tion of runoff regimes towards slower runoff as opposed to           tions but only 1275 km2 in the ERA-Interim-driven run and
rapid overland flow following rain storms. However, larger           1185 km2 in the ensemble mean historical average – a bias
snow cover may also increase the risk of rain-over-ice events,       largely concentrated at low elevations (Fig. 6a and b). Still,
which tend to have very high runoff coefficients (Davenport          except for elevations below 2000 m, mean snow cover mostly
et al., 2020). Environmental model covariates are calculated         remains close (±20 %) to MODIS values. The inter-model
using the ERA/MRCM run and associated snow model out-                spread in GCM-driven simulations also generally overlaps
put. Runoff coefficients (RCs) for each catchment are de-            with observed snow cover values. Consistent with these re-
fined as observed total October–June discharge divided by            sults, the spatial distribution of snow-to-precipitation ratio is
total October–June precipitation over the catchment. Precip-         generally well reproduced in the GCM-driven experiments
itation is obtained from the ERA/MRCM run bias-corrected             (Figs. 7a, d and A1), apart from negatives biases at low el-
with TRMM. To assess the robustness of the results to the            evations associated with the underestimation of snow cover
choice of TRMM to bias-correct precipitation, we also cal-           (Fig. 6). Inter-annual variability in basin-wide snow cover is
culate RCs based on precipitation series bias-corrected with         lower in the simulations compared to MODIS (standard de-
the CHIRPS dataset (available from 1981–present).                    viation of 220–440 km2 compared to 480 km2 in MODIS),
   Model selection is performed by stepwise regression:              but the discrepancy is mainly due to the negative bias at low
starting from a model with no covariates, covariates are             elevations, where snow plays a much more limited role in the
added one at a time in the order of highest improvement to           overall water balance (T20a).
model skill, as determined by its Akaike information crite-             Still in the current climate, we find that annual relative
rion (AIC). At each step, we also test whether removing any          sublimation losses are strongly linked to annual-mean pre-
of the currently selected variables and replacing it by one of       cipitation, a relationship that the GCM experiments are able

Hydrol. Earth Syst. Sci., 26, 571–588, 2022                                              https://doi.org/10.5194/hess-26-571-2022
A. Tuel et al.: Future projections of High Atlas snowpack and runoff under climate change                                     579

Figure 5. Annual cycles of snow cover (in %) in the MODIS obser-   Figure 6. Mean December–March (DJFM) fractional snow
vations (2000–2011; black), ERA- Interim simulation (2000–2011;    cover (%) over the basin in (a) MODIS (2000–2010) data and
dashed red) and three GCM-driven historical simulations (1994–     (b–d) three-GCM average under the (b) historical (1976–2005),
2005; solid blue: median; blue shading: three-model range), at     (c) RCP4.5 (2071–2100) and (d) RCP8.5 (2071–2100) experiments.
various elevations ranges within our study area: (a) > 3500 m,
(b) 3000–3500 m, (c) 2500–3000 m, (d) 2000–2500 m, (e) 1500–
2000 m and (f) the whole area.
                                                                   under RCP8.5, bringing the peak SWE value from about
                                                                   125 × 106 m3 down to 20 × 106 m3 (Figs. 10f and 11). Inter-
                                                                   model spread is largest in the RCP4.5 simulations, in which
to capture (Fig. 8a). Losses from latent heat fluxes are much      peak SWE ranges from 25 %–60 % of its historical value.
smaller during wet years as compared to dry years, a re-
lationship robust across all experiments. Wet years indeed         4.2   Runoff modelling and projections
bring higher RH over the region, due to enhanced moisture
advection from the Atlantic which more than compensates            The panel regression and model selection framework are
for the larger heat advection and increased air temperatures       applied to runoff coefficients and selected covariates over
that also occur in parallel (Knippertz et al., 2003). All exper-   the 1982–2011 period. Stepwise regression yields relative
iments also agree reasonably well on the evolution of subli-       humidity and snow fraction as optimal covariates. The ad-
mation losses with elevation (Fig. 8b). The MPI-ESM-MR             justed r 2 is equal to 0.30, meaning that these two covariates
and IPSL-CM5A-LR simulations exhibit a slight negative             explain nearly a third of inter-annual variability in RC. Fit-
bias but which remains within the uncertainty range in the         ted RCs are shown against observed ones in Fig. 12. Con-
assimilated run (T20a).                                            sistent with the model r 2 , fitted values have a much smaller
   Future projections show a stark decline in snow cover           variance. Still, for all the catchments, except Segmine, we
across all the region (Figs. 6 and 9). The greatest relative de-   observe a significant positive relationship between fitted and
cline is at low elevations, as expected since they are already     observed values. The coefficients for RH and snow fraction
seldom above the 0 ◦ C line (Boudhar et al., 2016). Above          are both significant, with βRH > 0 and βSF < 0 (Table 3). In
2500 m, projections still exhibit a 30 %–40 % decrease in          other words, all else being equal, a larger RH yields more
snow cover area under RCP4.5 and 50 %–60 % decrease un-            runoff and more of the precipitation falling as snow yields
der RCP8.5. Maximum snow cover extent is reached around            less runoff. These results are robust to the choice of the pre-
the beginning of February in all scenarios. However, snow-         cipitation dataset. When using the CHIRPS dataset, aver-
pack build-up and melt occur later and earlier in the sea-         age RCs are generally lower, due to CHIRPS’s wet bias com-
son, respectively. The projected decline is even steeper in        pared to TRMM (Fig. 3); the optimal RC model includes RH
terms of snowpack water content (Fig. 10): SWE is re-              and SF as well but also precipitation as a third variable (Ta-
duced on average by 60 % under RCP4.5 and 80 %–85 %                ble 3). The values of βRH and βSF obtained with CHIRPS

https://doi.org/10.5194/hess-26-571-2022                                          Hydrol. Earth Syst. Sci., 26, 571–588, 2022
580                               A. Tuel et al.: Future projections of High Atlas snowpack and runoff under climate change

                                                                         Figure 9. Annual cycles of snow cover (in %) in the three GCM-
Figure 7. (a, b) Snow fraction of annual precipitation in the (a) his-   driven experiments under the historical (blue, 1976–2005), RCP4.5
torical and (b) RCP8.5 scenario (average between all three GCM-          (purple, 2071–2100) and RCP8.5 (red, 2071–2100) scenarios, at
driven simulations). (c) Difference between (b) and (a). (d) Snow        various elevations ranges within our study area: (a) > 3500 m,
fraction of annual precipitation as a function of elevation, in each     (b) 3000–3500 m, (c) 2500–3000 m, (d) 2000–2500 m, (e) 1500–
scenario (historical, RCP4.5 and RCP8.5; three-model average) and        2000 m and (f) whole area. Solid lines represent the three-model
in the assimilated control simulation of T20a.                           medians, and the shading corresponds to the three-model spreads.

Figure 8. (a) Fraction of annual precipitation lost by sublimation
against total annual precipitation in the MRCM downscaled exper-
iments forced with ERA-Interim (1982–2011, magenta), the three
GCMs (1976–2005): MPI-ESM-MR (blue), GFDL-ESM2M (cyan)
and IPSL-CM5A-LR (black), and the assimilated snow run forced
with MODIS and TRMM data only (red, data from T20a). (b) Frac-
tion of annual precipitation lost by sublimation as a function of al-
titude range in our study area, for the assimilated run from T20a        Figure 10. Same as Fig. 9 but for average snow water equiva-
and in the various downscaled experiments, for historical (1976–         lent (mm, left-hand axis) and corresponding total snow water con-
2005, “+”) and RCP8.5 (2071–2100, “1”) scenarios.                        tent (106 m3 ).

Hydrol. Earth Syst. Sci., 26, 571–588, 2022                                                https://doi.org/10.5194/hess-26-571-2022
A. Tuel et al.: Future projections of High Atlas snowpack and runoff under climate change 581
Table 3. Runoff coefficient model results. The bottom three lines
show coefficient values (left-hand column) and their statistical sig-
nificance (p value, right-hand column).
MRCM-BC CHIRPS
r2 0.30 0.36
SF −1.84 4 × 10⁻³ −1.47 2 × 10⁻²
RH 5.71 2 × 10⁻⁵ 8.71 1 × 10⁻⁹
Pr – – 2.04 × 10⁻³ 1 × 10⁻⁶
in RC (Table 4). Combining now precipitation and runoff co-
efficient estimates, we find a 20 %–40 % decrease in runoff
in the RCP4.5 experiments, compared to a 50 %–65 % de-
Figure 11. Distribution of cumulative basin-wide peak SWE with cline under RCP8.5 (Fig. 13b, c and Table 4). Decreases in
elevation in the GCM-driven experiments, under the historical
precipitation drive most of the runoff trends, especially in the
(black), RCP4.5 (purple) and RCP8.5 (red) scenarios. SWE is
normalised in each model by that model’s historical total basin-
RCP8.5 scenario. Projected RC declines are about the same
wide SWE. when using CHIRPS data for the analysis although tend to be
slightly higher, by 3 %–6 % on average (not shown).
5 Discussion
5.1 Snowpack projections
The steep projected decline in snowpack in the High Atlas
results both from a decrease in wet-season precipitation and
from warming trends which severely reduce the fraction of
solid precipitation. This is particularly true at mid-elevations
(2000–2500 m), very close to the 0 ◦ C line in the current
climate, where the relative decline in snow fraction is the
highest (Fig. 7). At first order, changes in precipitation and
rising temperatures each seem to account for about half of
the projected SWE trends for the area as a whole. Precipi-
Figure 12. Fitted runoff coefficient values against observed values
tation goes down by about 25 % under RCP4.5 and 40 %–
(defined with TRMM precipitation), for the seven catchments in 45 % under RCP8.5 (Tuel et al., 2021), while the fraction
our study area. Best-fit linear regression lines are shown by dashed of solid precipitation decreases by 25 % under RCP4.5 and
lines. 50 % under RCP8.5 (from ≈ 19 % in the historical simula-
tions to ≈ 14 % and ≈ 9 % annually in the RCP experiments)
(Fig. 7). Rising temperatures prevent snowpack build-up, not
data are similar, although βSF is slightly less significant. In only by increasing the likelihood of liquid precipitation, but
addition, for both precipitation datasets, the effect of RH on also by favouring snowmelt. Snowmelt is already frequent
runoff coefficient, as measured by the respective regression during winter in the High Atlas, even at high elevations (Tuel
coefficient βRH , is 3–5 times that of snow. Since the input et al., 2020), and is thus likely to be even more common in a
variables were not standardised prior to model fitting, this warmer world. Still, at high elevations, the relative decline in
does not mean however that runoff coefficients are more sen- snow fraction is roughly half as small, and consequently the
sitive to RH variations in the absolute. precipitation signal may be dominant in the SWE trends.
Future runoff projections are characterised by consis- Inter-model uncertainty in normalised SWE projections
tent, steep declines in runoff coefficients of 5 %–17 % un- differs across scenarios (Fig. 11). It is small in the RCP8.5
der RCP4.5 and 15 %–30 % under RCP8.5 (Fig. 13a). The simulations: peak SWE declines by 85 ± 3 %. In this sce-
impact of decreasing RH largely dominates over that of de- nario, warming is large enough in all the models that re-
clining snow fraction. Tarhat and Chacha, the two watersheds gardless of its magnitude, snowpack is projected to disap-
which already receive almost no snow in the present climate, pear almost entirely. All three models agree on a ≈ 50 %
exhibit the greatest relative RC decline, whereas in other wa- decrease in snow-to-precipitation fraction. This is consistent
tersheds, decreases in snow fraction help limit the decline with observations that in mountain regions, above-freezing
https://doi.org/10.5194/hess-26-571-2022 Hydrol. Earth Syst. Sci., 26, 571–588, 2022582 A. Tuel et al.: Future projections of High Atlas snowpack and runoff under climate change
Figure 13. (a) Average runoff coefficients for the seven catchments in the observations (black) and projected average values in the RCP4.5
(blue) and RCP8.5 (red) scenarios. Boxes represent 90 % confidence intervals. (b) Projected relative changes in runoff across the seven
catchments against relative change in snow fraction (x axis) and change in catchment-wide relative humidity (y axis), for the RCP4.5 (blue)
and RCP8.5 (red) scenarios.
temperatures are common, even at high altitudes, where av- to warmer temperatures, which tend to decrease the snow-
erage winter temperatures are not far from freezing (López- to-precipitation ratio and lead to lower relative sublimation
Moreno et al., 2017). Therefore, under the RCP8.5 scenario, losses as well. RH is therefore important in our model be-
the projected 4 ◦ C warming (Tuel et al., 2021) would regu- cause it incorporates information on both the energy con-
larly bring all areas but the very highest peaks well above straint (evaporative demand) and on the water availability.
freezing and prevent seasonal snowpack accumulation. By The snow fraction has an opposite effect: the larger it is,
contrast, uncertainty is high in the RCP4.5 simulations, in the lower the runoff efficiency. We can understand the influ-
which warming and drying are about half as small as under ence of snow fraction by noting that a higher snow fraction
RCP8.5 (Table 4). Consequently, the reduction in the snow- means more opportunity for sublimation, particularly large at
to-precipitation fraction projected by the models ranges from high elevations, and evaporation of melted snow, consistent
5 % to 35 %. In this scenario, the uncertainty in warming thus with our analysis of sublimation losses (Fig. 11). Precipita-
appears to be the main factor behind the spread in snowpack tion in the area tends to occur in short and intense storms and
projections. quickly saturate the dry soil, leading to rapid overland flow
There is also uncertainty in absolute SWE values. As dis- with limited opportunity for evaporation (El Khalki et al.,
cussed in T20a, the historical SWE peak of 125 × 106 m3 2018). By comparison, snowmelt is slow and leads to a more
is subject to caution; experiments with enhanced precipita- gradual surface flow, with the potential for higher evaporative
tion or reduced temperatures suggest it may in fact be as losses in this climate where evaporation tends to be water-
high as 200 × 106 m3 . Still, while inter-model spread is large limited. More winter snow may also lead to a higher like-
in the historical experiments (≈ 60 × 106 m3 ) and still large lihood of rain-on-snow episodes in spring, known to cause
(≈ 40 × 106 m3 ) in the RCP4.5 experiment, it is reduced to rapid flooding due to high runoff efficiencies (Davenport
almost zero under RCP8.5. Again, despite the spread in tem- et al., 2020). Whether this occurs in the High Atlas remains
perature and precipitation projections among the three mod- to be shown, but it would nevertheless be consistent with the
els, they all agree on the virtual disappearance of the snow- effect of the snow fraction on runoff efficiencies.
pack by the end of the century under business-as-usual sce- More snow may also mean more opportunity for infiltra-
narios. tion and aquifer recharge (Hssaisoune et al., 2020). It should
be noted that karstic areas are also quite frequent within
5.2 Runoff modelling and projections the Oum-Er-Rbia watershed (Akdim, 2015), with important
implications for infiltration, aquifer and spring regimes in
Among the several environmental variables tested, runoff co- our study area. Compared to surface runoff, groundwater
efficients in the High Atlas appear primarily affected by RH remains a small fraction of water use in the Oum-Er-Rbia
and the fraction of snow in seasonal precipitation. Consis- basin (< 15 %) and even less of available renewable wa-
tent with previous studies (Wang et al., 2016; Duan et al., ter since aquifers are largely overdrawn (Hssaisoune et al.,
2017), the higher the RH is, the larger the runoff coeffi- 2020). Groundwater data are quite scarce in this region; we
cient. Higher RH in the High Atlas is indeed associated with make the choice of purely focusing on surface runoff, keep-
more precipitation, higher soil moisture levels and a lower ing in mind that a more complete picture of basin-wide water
evaporative demand. Thus higher RH will lead to reduced availability would also require aquifer fluxes to be taken into
relative sublimation losses (Fig. 8a), but it is also linked account. While base flow is negligible in six out of the seven
Hydrol. Earth Syst. Sci., 26, 571–588, 2022 https://doi.org/10.5194/hess-26-571-2022A. Tuel et al.: Future projections of High Atlas snowpack and runoff under climate change 583
sub-catchments considered here, aquifer discharge may still
Table 4. Long-term (2071–2100 minus 1976–2005) projections for the seven catchments: October–May temperature (◦ C), precipitation (%), relative humidity (%), absolute and relative
RCP8.5
4.7
−55
−6.1
−3.2
−80
−30
−68
occur naturally further down the mountains or artificially via
direct groundwater pumping in the agricultural plains.
Chacha
Results indicate a decline in runoff under future climate
scenarios, due to a decrease in both runoff efficiency and
RCP4.5
2.3
−31
−3.2
−2
−50
−15
−41
wet-season precipitation. Precipitation trends play a much
larger role than RC changes in runoff projections. In RCP8.5,
precipitation decreases by 48 %–57 %, compared to a 15 %–
30 % decline in RCs. Our projected runoff trends are consis-
RCP8.5
4.8
−50
−6.6
−7.5
−78
−27
−63
tent with those of El Moçayd et al. (2020), who focused on
catchments part of the Sebou watershed, where snow plays a
Tarhat
much smaller role than in our region (Marchane et al., 2015).
RCP4.5
2.3
−31
−3.2
−5
−52
−13
−39
This is not surprising given the weak impact of the declining
snow fraction on runoff coefficients, compared to that of the
relative humidity decline. Runoff efficiency is projected to
decline mainly due to atmospheric drying (decreasing RH),
RCP8.5
4.6
−57
−6.3
−11.3
−52
−19
−65
which more than compensates for the diminishing snow frac-
Ouchene
tion. Under RCP8.5, average relative humidity will decline
by 3 %–6 % (Tuel et al., 2021), which will lead to an average
RCP4.5
2.3
−31
−3.4
−6
−28
−9
−37
30 % RC decline across the seven sub-catchments, while the
decline in snow fraction increases RCs by only 10 %. Ad-
ditionally, lower RH implies that sublimation rates will be
higher when snow is present. However, because the snow-
RCP8.5
4.6
−48
−7.1
−14.9
−51
−17
−57
to-precipitation ratio will also sharply decline due to rising
temperatures, the overall loss of annual precipitation by sub-
Segmine
limation will tend to decrease by about a third (Fig. 8b).
RCP4.5
2.3
−22
−3.6
−5.7
−19
−10
−29
The spread in runoff projections is large (Fig. 13b),
due to uncertainties in both RC (Fig. 13a) and precipita-
tion projections. Despite warming and drying trends being
smaller in RCP4.5, the uncertainty in RC changes is just
snow fraction (%), runoff coefficient (%) and runoff (%), under RCP4.5 and RCP8.5.
RCP8.5
4.5
−57
−6.4
−15.7
−44
−14
−63
as high as under RCP8.5 (Fig. 13a), notably because snow-
pack projections are much more uncertain (Fig. 11). Com-
Tillouguite
bined with weaker precipitation changes, this translates into
larger uncertainty in future runoff under RCP4.5 compared
RCP4.5
2.2
−30
−3.2
−6.7
−19
−6
−34
to RCP8.5.
5.3 Uncertainties in results and limitations of the study
RCP8.5
4.4
−57
−5.5
−12.3
−51
−17
−64
Every modelling framework relies on its own assumptions,
Tamesmate
which translate into uncertainties. First, it is important to note
that our pixel-by-pixel approach to bias correction does not
RCP4.5
2.2
−14
−2.5
−3.9
−16
−8
−21
take spatial correlation and inter-variable dependencies into
account, for which a more complex method like R2D2 (Vrac,
2018) would be required. However, in the present case, it
makes little practical difference. To fit the snow model, we
RCP8.5
4.6
−53
−6.2
−11.3
−46
−23
−64
rely on average annual cycles of snow cover over which
M. Hassan
short-term correlations across space and between variables,
beyond the seasonal cycle, have little influence. In addition,
RCP4.5
2.3
−11
−3.1
−3.3
−14
−14
−23
the target datasets used in the bias correction come from dif-
ferent sources (TRMM, MODIS, etc.), and thus we should
be very careful about relying on their correlations when cor-
recting the data. Ideally, one could correct all variables from
1Runoff (%)
1Snow (%)
Catchment
a single observational dataset that includes all the variables
1RH (%)
1RC (%)
1SF (%)
1T (◦ C)
1Pr (%)
we use, but such a dataset obviously does not exist.
https://doi.org/10.5194/hess-26-571-2022 Hydrol. Earth Syst. Sci., 26, 571–588, 2022584 A. Tuel et al.: Future projections of High Atlas snowpack and runoff under climate change Second, for future climate projections, we rely on a sin- ing predictor variables is also quite restrictive; it does not gle regional climate model and thus do not explore the full take into account the weekly variability (in RH, temperature, range of uncertainties related to model configuration and pa- precipitation, etc.), which may affect runoff efficiency. For rameterisations. Still, the regional simulations we use here instance, the details of the daily distribution of precipitation have been specifically tailored to the area, particularly the are important to estimate runoff: the more concentrated in choice of driving GCMs, and validated against a range of ob- time precipitation is, the less opportunity for infiltration and servations (Tuel et al., 2021). The fact that the uncertainty in evaporation and therefore the higher the runoff efficiency. snowpack projections under RCP8.5 is small could be fur- Finally, we focus on climate-driven inter-annual variability ther explored by using other GCM/RCM combinations, es- in RCs; thus, we do not explain differences in average RCs pecially ones that lead to less warming than projected in our across catchments, nor can we say anything about long-term three-member ensemble. As to the uncertainty in precipita- variability in RCs forced by non-climatic parameters, like tion trends, it is difficult to reconcile. As shown by Tuel and land use change. This last aspect may not be critical in the Eltahir (2020), the magnitude of future wet-season precipi- case of the High Atlas since most of the area under study is tation in northwestern Africa is mainly determined by that uncultivated, naturally lacking tree cover and sparsely pop- of changes in Mediterranean atmospheric circulation. Spread ulated. It has thus not experienced very significant land use in dynamical trends is difficult to reduce for this region. A changes in the last few decades. However, climate-change- GCM-selection approach based on storylines could be rele- driven trends in vegetation cover may still affect runoff ef- vant to determine plausible scenarios (Shepherd, 2019). In ficiency in the region. It is also unclear to what extent en- addition, drier soils together with enhanced absorption of so- hanced groundwater pumping in the Oum-Er-Rbia watershed lar energy where snowpack disappears will also lead to en- since the 1980s may have modified the natural water balance hanced warming locally, driving yet further snowpack melt. and, indirectly, RCs in mountain catchments. We do not explicitly take this into account in our model. In particular, the snow albedo effect is largely absent from the MRCM simulations due to their 12 km resolution, which is 6 Conclusions still too coarse to represent the complex topography. For ar- eas at the highest elevations (near 4000 m) which will still Based on the robust understanding of its snow water bal- likely be below freezing in future winters, melt may remain ance in the current climate, we quantified in this study the largely unchanged in the middle of winter; however, a drier response of the High Atlas snowpack to climate change us- atmosphere will still be associated with reduced precipitation ing high-resolution downscaled climate projections. We find and increased sublimation losses, which will play a critical that the High Atlas snowpack will significantly decline, even role in reducing the snowpack. in the RCP4.5 scenario, which involves substantial mitiga- The advantage of using a statistical regression model to tion of emissions. By the end of the century, snow may be- investigate the sensitivity of runoff to climate variables and come a rarity below 2000 m. Maximum snow cover extent its changes is its simplicity and interpretability. It allows, is projected to go from 17 % of the study area down to 9% for instance, the influence of the snow fraction in the inter- under RCP4.5 and even 4 % under RCP8.5 (Fig. 9f). In par- annual variability of RCs to be highlighted. While hydro- allel, snowpack water equivalent could decline by 80%, even logical models are certainly more comprehensive, they also at the highest elevations (> 3500 m). Snowpack decline is rely on many parameters, which leaves them vulnerable to evidently connected to regional warming trends but is also overfitting and thus to even more uncertainties. In addition, affected by a projected 40 %–60 % decrease in wet-season they suffer from the same drawback as our simple model, precipitation in northwestern Africa. which is that there is no guarantee that the relationships ob- The analysis of runoff coefficients for seven mountain tained in the current climate are directly transferable to the catchments showed that a third of their inter-annual vari- future climate. Still, the large inter-annual variability in cli- ability could be explained by large-scale meteorological fac- mate variables in the present climate helps make the model tors like snow fraction of precipitation and relative humid- more robust to large changes in average covariate values. Fur- ity. Interestingly, in this region, a larger snow fraction leads thermore, the explanatory variables used in the regression are to lower runoff coefficients. While the reverse is generally physical variables; we understand how these mechanistically thought to be true at higher latitudes (Berghuijs et al., 2014), relate to runoff. The difference with a hydrological model is this finding is consistent with other analyses in warm, semi- in the different form of mathematical relations; however the arid regions that receive substantial amounts of snow dur- physical relationship between the variables is somewhat re- ing winter (Davenport et al., 2020). Warmer conditions tend spected. to enhance runoff efficiencies by reducing snowpack, thus Furthermore, RH and snow fraction only explain 30 % of limiting sublimation losses and the slow melting of snow, inter-annual variability in RCs. The rest of the variability propitious to evaporation, and by increasing the likelihood may be still explained by climatic variables, which we do of rain-on-snow events that tend to cause high runoff effi- not include in our model. Our seasonal approach to defin- ciencies. While decreasing snowfall will partly compensate Hydrol. Earth Syst. Sci., 26, 571–588, 2022 https://doi.org/10.5194/hess-26-571-2022
You can also read