On the energy budget of a low-Arctic snowpack - The Cryosphere
←
→
Page content transcription
If your browser does not render page correctly, please read the page content below
The Cryosphere, 16, 127–142, 2022
https://doi.org/10.5194/tc-16-127-2022
© Author(s) 2022. This work is distributed under
the Creative Commons Attribution 4.0 License.

On the energy budget of a low-Arctic snowpack
Georg Lackner1,2,3,4 , Florent Domine2,3,5 , Daniel F. Nadeau1,4 , Annie-Claude Parent1 , François Anctil1,4 ,
Matthieu Lafaysse6 , and Marie Dumont6
1 Department  of Civil and Water Engineering, Université Laval, Québec, Canada
2 Takuvik Joint International Laboratory, Université Laval (Canada) and CNRS-INSU (France), Québec, Canada
3 Centre d’Études Nordiques, Université Laval, Québec, Canada
4 CentrEau – Water Research Center, Université Laval, Québec, Canada
5 Department of Chemistry, Université Laval, Québec, Canada
6 Univ. Grenoble Alpes, Université de Toulouse, Météo-France, CNRS, CNRM,

Centre d’Études de la Neige, 38000 Grenoble, France

Correspondence: Georg Lackner (georg.lackner@mailbox.org)

Received: 20 August 2021 – Discussion started: 25 August 2021
Revised: 3 December 2021 – Accepted: 3 December 2021 – Published: 13 January 2022

Abstract. Arctic landscapes are covered in snow for at least      1   Introduction
6 months of the year. The energy balance of the snow cover
plays a key role in these environments, influencing the sur-      The Arctic winter, characterized by low solar radiation and
face albedo, the thermal regime of the permafrost, and other      air temperatures below 0 ◦ C, presents extreme conditions to
factors. Our goal is to quantify all major heat fluxes above,     which local populations, flora, and fauna are adapting. Cli-
within, and below a low-Arctic snowpack at a shrub tundra         mate change imposes additional challenges. Indeed, recent
site on the east coast of Hudson Bay in eastern Canada. The       studies have shown that the warming in the Arctic is most
study is based on observations from a flux tower that uses the    pronounced during the cold season (Graversen et al., 2008;
eddy covariance approach and from profiles of temperature         Boisvert and Stroeve, 2015), and winter warm spells are be-
and thermal conductivity in the snow and soil. Additionally,      coming more frequent (Graham et al., 2017). This warming,
we compared the observations with simulations produced us-        both episodic and perennial, alters the properties of seasonal
ing the Crocus snow model. We found that radiative losses         snow. Since snow is a highly reflective medium with low
due to negative longwave radiation are mostly counterbal-         thermal conductivity, it impacts the entire energy balance at
anced by the sensible heat flux, whereas the latent heat flux     the Earth’s surface and leads to repercussions for many fields
is minimal. At the snow surface, the heat flux into the snow      such as hydrology, permafrost modeling, weather forecast-
is similar in magnitude to the sensible heat flux. Because the    ing, and climate modeling (Meredith et al., 2019).
snow cover stores very little heat, the majority of the upward       The energy budget can be calculated at the snow surface
heat flux in the snow is used to cool the soil. Overall, the      using a control surface approach or by considering the snow-
model was able to reproduce the observed energy balance,          pack as a whole and therefore relying on a control volume.
but due to the effects of atmospheric stratification, it showed   Using the control surface approach, incoming heat fluxes at
some deficiencies when simulating turbulent heat fluxes at an     the snow surface are counterbalanced by the outgoing fluxes,
hourly timescale.                                                 such that

                                                                  Q∗ + QH + QE + Qs + QA = 0,                                (1)

                                                                  where Q∗ is the net radiation, QH is the sensible heat flux,
                                                                  QE is the latent heat flux, QA is the flux of advected energy
                                                                  (e.g., by rain falling on the snowpack), and Qs is the snow
                                                                  heat flux, all in watts per square meter (W m−2 ). The fluxes

Published by Copernicus Publications on behalf of the European Geosciences Union.
128                                                        G. Lackner et al.: On the energy budget of a low-Arctic snowpack

are considered to be positive if directed towards the surface      (2004), sublimation losses in the Arctic can deplete as much
and negative if directed away from the surface. When taking        as 50 % of the total winter precipitation. A great deal of un-
the snowpack as a whole, considering a control volume ap-          certainty surrounds this percentage, given the difficulty of
plied to a horizontally homogeneous snow cover, the energy         measuring both sublimation and solid precipitation, not to
balance takes the form                                             mention the large spatiotemporal variation of sublimation in
dU                                                                 response to varying weather and geographic conditions, such
   = Q∗ + QH + QE + QA + QG ,                               (2)    as proximity to water bodies. During blowing snow events,
dt                                                                 Pomeroy and Essery (1999) reported sublimation rates as
where dU/dt is the rate of change of internal energy of the        high as 0.075 mm water equivalent per hour in the Canadian
snow and QG is the ground heat flux at the snow–soil in-           Prairies. The high rates might explain the high fractions of
terface. Each alternative (Eqs. 1 and 2) has its strengths and     sublimation of the total winter precipitation reported by Lis-
weaknesses when it comes to monitoring the energy balance          ton and Sturm (2004).
in the field. For example, Eq. (1) requires less instrumenta-         Data on the thermal regime of the snowpack are even more
tion but delivers no information on how the energy is dis-         scarce. One of the only studies covering this topic was con-
tributed between the snowpack and the ground, while Eq. (2)        ducted in the Canadian Prairies by Helgason and Pomeroy
does provide these details, which are key to permafrost stud-      (2012). This study found that the measured rate of change
ies. However, this equation requires more instrumentation,         of internal energy of the snowpack was systematically lower
which makes it more prone to error.                                than the residual of the other energy budget terms (right-hand
   Measuring all constituents of Eqs. (1) and (2) in Arctic        side of Eq. 2). Thus, Helgason and Pomeroy (2012) were not
and subarctic regions involves many challenges related to          able to close the energy budget and attributed the remaining
field conditions. For instance, the remote locations of the        energy to “an unmeasured exchange of sensible heat [. . . ]
sites greatly complicate maintenance operations, the low so-       from the atmosphere to the snowpack”.
lar radiation limits the amount of energy available for sta-          Sophisticated snow models such as Crocus (Vionnet et al.,
tions powered by solar panels, and harsh meteorological con-       2012) are occasionally used for climate studies in the Arc-
ditions (rime, blizzards, etc.) can alter the performance of the   tic (e.g., Gascon et al., 2014; Sauter and Obleitner, 2015;
instruments. For all these reasons, data for in situ snowpack      Royer et al., 2021) and the Antarctic (Libois et al., 2015).
energy balance in high-latitude environments are very sparse.      The accuracy of these models at high latitudes has not been
Moreover, these data tend to suffer from an unclosed energy        evaluated, though large-scale bulk properties such as snow
budget, meaning that the available energy from net radiation       depth seem to be simulated fairly well (Brun et al., 2013).
is not equal to the sum of all recorded heat fluxes, and there-    However, studies focusing on the ability of these models to
fore a residual term remains. This phenomenon occurs for           simulate the internal physical properties of snow from Bar-
almost all energy budget studies and is not restricted to Arc-     rere et al. (2017) (using Crocus) and Gouttevin et al. (2018)
tic environments or winter conditions (Foken, 2008).               (using the model SNOWPACK; Bartelt and Lehning, 2002)
   Of the few existing studies on the winter energy budget in      at Arctic polygon tundra sites found that the observed verti-
cold regions, a study by Langer et al. (2011) at a polygonal       cal profiles of snow density and thermal conductivity were
tundra site in northern Siberia found that longwave radiation      not well reproduced by the models. Studies that focus on
was the dominant term in the surface energy budget. Langer         the performance of these sophisticated snow models when
et al. (2011) found that 60 % of the radiative losses were         simulating the surface energy budget at point scale are rare.
counterbalanced by the ground heat flux, and the remainder         The only studies we found were conducted in alpine regions
was counterbalanced by the sensible heat flux. Contributions       (Martin and Lejeune, 1998). More generally, very few stud-
of the latent heat flux were small. They identified cloudiness     ies evaluating the turbulent fluxes simulated by snow mod-
as the main controlling factor of the surface energy budget.       els are available, despite this process being identified as one
Westermann et al. (2009) reported similar results at a high-       of the major sources of uncertainty in snow cover modeling
Arctic permafrost site and found latent heat fluxes to be in-      (Menard et al., 2021; Lafaysse et al., 2017).
significant for the average energy balance. They also charac-         Here, we measure all components of the snowpack energy
terized atmospheric stratification and found it to range from      budget at a low-Arctic site and compare the observations
mostly stable to near neutral. Lund et al. (2017) measured         with simulations from the snow model Crocus. We (i) ex-
the energy balance over different surfaces, such as wet and        plore the radiation budget, (ii) compare 3 years of turbulent
dry tundra and a glacier, and found only small differences in      heat flux data to examine inter-annual trends and dependen-
components of the surface energy budget between the sur-           cies on meteorological conditions, (iii) compare those obser-
face types. That study also found that radiation was predom-       vations with model outputs from Crocus, (iv) establish the
inately balanced by sensible and ground heat fluxes.               full energy budget at the snow surface using observations as
   The above-mentioned studies all show the small contribu-        well as model outputs to assess the relative importance of its
tion of latent heat fluxes to the overall energy budget in the     components, and (v) assemble the energy budget of the entire
presence of snow. However, according to Liston and Sturm           snow cover.

The Cryosphere, 16, 127–142, 2022                                                      https://doi.org/10.5194/tc-16-127-2022

G. Lackner et al.: On the energy budget of a low-Arctic snowpack                                                               129

2     Methods                                                        47, and 67 cm above ground. These probes recorded tem-
                                                                     perature and effective thermal conductivity according to the
2.1    Study site                                                    measurement principle and data treatment detailed in Morin
                                                                     et al. (2010) and Domine et al. (2015, 2016). In short, the
Our study site was located in the Tasiapik valley near               needle is heated at a constant power (0.4 W m−1 in our case),
the village of Umiujaq, Quebec, Canada (56◦ 330 3100 N,              while a thermistor in the shaft serves as a reference tempera-
76◦ 280 5600 W), on the eastern shore of Hudson Bay. The             ture. The temperature difference between these two parts can
climate is subarctic with a mean annual temperature of               then be plotted against a logarithm of the time. The effec-
−4.0 ◦ C and a mean annual precipitation of between 800 and          tive snow thermal conductivity keff is inversely proportional
1000 mm (Lackner et al., 2021). The vegetation at the site           to the slope that is obtained. In our study, the needles were
consists of a mixture of lichen (Cladonia sp. mostly C. stel-        heated every 2 d in a 100 s heating cycle, provided that the
laris and C. rangiferina) and shrub tundra with dwarf birch          snow was below −2.5 ◦ C to avoid melting and irreversible
(Betula glandulosa) and other shrub species (Vaccinium sp.,          alterations of the snow structure. Snow temperatures were
Alnus viridis subsp. crispa and Salix planifolia) that range         measured every 5 min (see Supplement Fig. S1). The pole
from 0.2 to 1 m tall in the upper part of the valley, and it turns   also had two thermocouples below the surface of the ground,
into a forest tundra populated by black spruce (Picea mari-          at depths of 4 and 14 cm, to compute the ground heat flux.
ana) towards the lower part of the valley. In the study area,        The pole was installed on a patch of Cladonia (5 to 10 cm
the vegetation consists of 20 %–30 % pure lichen-covered             thick yellowish lichen), and data were collected during the
surface, with the rest being small shrubs (mostly dwarf birch)       winters of 2018–2019 and 2019–2020.
with a lichen or moss understory. Permafrost is discontinuous           In addition to the automatic measurements, snow field
to sparse and is rapidly degrading (Fortier et al., 2011). At the    surveys were conducted in April 2018 and March 2019. In
precise location of the experimental setup, no permafrost was        both cases, three snow pits were dug at different locations
present. In the area surrounding the study site, the soil con-       in the vicinity of the experimental setup to capture the spa-
sists mainly of sand topped by a thin organic litter. The soil       tial variability of the snow cover. Snow pit data from previ-
organic content varies between 1.4 and 4.3 kg m−3 (Gagnon            ous campaigns (Domine et al., 2015) were also included in
et al., 2019). A more detailed description of the site can be        the analysis. In each snow pit, the stratigraphy was analyzed,
found in Lackner et al. (2021).                                      and profiles of density, temperature, and thermal conductiv-
                                                                     ity were collected. Thermal conductivity was measured with
2.2    Instrumental setup                                            a portable instrument featuring a TP02 heated needle, while
                                                                     density was measured with a 100 cm3 box cutter (Conger and
A photo of the experimental setup is shown in Fig. 1. The            McClung, 2009) and a field scale. Monitoring and mainte-
setup included a 10 m flux tower equipped with a sonic               nance of the instruments was done during field trips in winter
anemometer and a CO2 / H2 O gas analyzer located 4.2 m               and every summer. No field trips to the site were possible in
above ground (IRGASON, Campbell Scientific, USA) on                  2020 due to the COVID-19 pandemic.
a 5◦ slope with a SE aspect. Due to the open-path nature                Our study focuses on the winters 2017–2018, 2018–2019,
of the eddy covariance (EC) sensor, it was subject to inter-         and 2019–2020 for evaluating the performance of the Crocus
ference in the presence of precipitation and during blowing          model using observations, and on the last two winters for
snow events. The tower also featured sensors for tempera-            examining the observed surface energy balance.
ture, humidity (model HMP45, Vaisala, Finland), and wind
speed and direction (model 05103, R.M. Young, USA). Total            2.3     Data processing
precipitation was measured with a T200B gauge (GEONOR,
USA) equipped with a single Alter shield. Approximately              2.3.1    Turbulent heat flux
10 m west of the flux tower, a second station was equipped
with a four-component radiometer (CNR4, Kipp and Zonen,              A detailed explanation of the procedure for obtaining the tur-
the Netherlands) and an SR50 snow depth sensor (Campbell             bulent heat fluxes from raw eddy covariance data is provided
Scientific, USA).                                                    by Lackner et al. (2021). In short, turbulence data were pro-
   The snow heat flux was computed using observations col-           cessed using EddyPro® (version 7.0.3; LI-COR Biosciences,
lected on a 1 m pole equipped with 18 T-type thermocouples           USA), a software package that computes fluxes from raw
deployed from ground level up to a height of 0.82 m (see             10 Hz data, while accounting for several corrections, includ-
inset in Fig. 1). The thermocouples were unequally spaced,           ing the application of a double rotation on the raw data to
with separations ranging from 2.5 to 10 cm. To avoid dis-            align the coordinate system with the current snow surface.
turbing the snowpack in cases where the spacing was small,           EddyPro also includes a thorough QA/QC procedure. A pro-
some thermocouples were deployed with a 90◦ deviation                gram called PyFluxPro (Isaac et al., 2017) was also used
from the main axis. Four TP08 heated needle probes (Huk-             to remove spikes and erroneous data that persisted despite
seflux, the Netherlands) were deployed at heights of 7, 27,          the EddyPro® processing. Data gaps were filled using ERA5

https://doi.org/10.5194/tc-16-127-2022                                                         The Cryosphere, 16, 127–142, 2022
130                                                            G. Lackner et al.: On the energy budget of a low-Arctic snowpack

Figure 1. Upper panel: study site with (a) the main 10 m flux tower with the eddy covariance setup, (b) a precipitation gauge, (c) a 2.3 m
high mast hosting the four-component radiometer, and (d) a vertical pole holding an array of thermocouples and heated needles. The inset
map shows the location of the site in the Tasiapik valley, some 4 km east of Hudson Bay. Lower panel: schematic of the study site illustrating
the main instruments monitoring energy balance terms. The whole experimental setup is contained within 20 m.

(Hersbach et al., 2020) reanalysis data and an artificial neural         1T are measured automatically, a continuous time series is
network procedure (Hsu et al., 2002) with radiation, air tem-            obtained. We multiplied keff by 1.2 to correct for the under-
perature and humidity, and the soil temperature as the driving           estimation of keff by the needle probe method as reported by
data. Including longer power outages, gaps were present for              Riche and Schneebeli (2013). This method was also used to
44 % of the study period for sensible heat fluxes and 61 %               estimate the ground heat flux QG , but since soil thermal con-
for latent heat fluxes. Mauder et al. (2013) reported errors of          ductivity was not available, it was taken as 1 W m−1 K−1 (Lu
10 %–15 % for the processed flux data.                                   et al., 2018) for the frozen soil given its sandy texture. Note
                                                                         that we compared the resulting ground heat flux to measure-
2.3.2   Snow heat flux and internal energy                               ments of the snow heat flux 7 cm above the soil to validate
                                                                         this value of thermal conductivity (see Supplement Fig. S3).
The heat flux Qs (in W m−2 ) within the snowpack can be                     Neglecting any melt or freeze-related processes and as-
calculated using the measured effective snow thermal con-                suming a dry snowpack, the rate of change of the snowpack
ductivity keff (in W m−1 K−1 ) from the heated needles and               internal energy U is given by
temperatures from the two adjacent thermocouples using
Fourier’s law:                                                                   Zh
                                                                          dU       d Tsnow (z)ρsnow (z)cp,ice
             ∂T                                                              =                                  dz,                       (4)
Qs = −keff      ,                                               (3)       dt                   dt
             ∂z                                                                  0

where the vertical temperature gradient ∂T /∂z is evaluated              where h is the snow height (in m), Tsnow (z) is the snow tem-
using a central finite difference (≈ 1T /1z). As both keff and           perature at height z (in K), ρsnow (z) is the snow density at

The Cryosphere, 16, 127–142, 2022                                                               https://doi.org/10.5194/tc-16-127-2022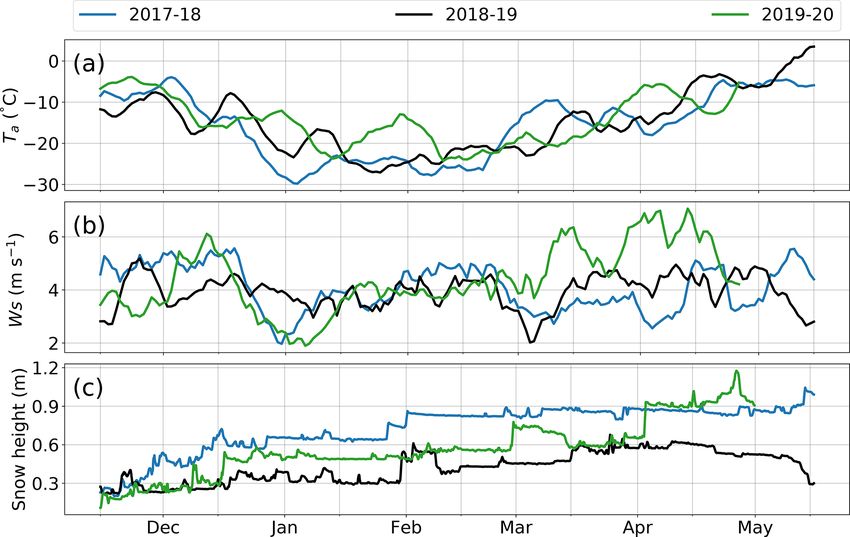
G. Lackner et al.: On the energy budget of a low-Arctic snowpack                                                                 131

height z (in kg m−3 ), and cp,ice is the thermal capacity of ice      place in the snowpack, such as heat exchanges, snow meta-
(in J kg−1 K−1 ). In Eq. (4), internal energy changes associ-         morphisms, and snow compaction. Crocus also simulates the
ated with fluctuations in the air temperature contained in the        radiation budget at the snow surface and the heat exchanges
snowpack pore space are neglected. As frequent sampling of            with the atmosphere above the snowpack. The heat flux into
the snow cover was not feasible, we used the density pro-             the snow cover is the remainder of the turbulent heat fluxes
file obtained from a snow pit dug once a year and assumed             subtracted from the net radiation.
that it remained constant (see Supplement Fig. S2), knowing
that this is a very rough approximation. To calculate the rate        2.4.2   Forcing variables and model setup
of change of the internal energy, we discretized the snow-
pack into 5 cm thick layers, corresponding to the mean sepa-          The ISBA-Crocus model was run in offline mode, meaning it
ration of the thermocouples. Each layer was approximated as           was not coupled to an atmospheric model. Instead, the model
isothermal, with a temperature equal to that measured at its          was driven by local observations of the following meteo-
center. Under these assumptions, Eq. (4) then simplifies to           rological variables: air temperature, specific humidity, wind
      N
                                                                      speed, incoming shortwave and longwave radiation, atmo-
dU X     1Tsnow,i ρsnow,i cp,ice                                      spheric pressure, and (solid and liquid) precipitation rates.
   =                             1z,                           (5)
dt   i=1
                  1t                                                  These observations have been collected at the study site since
                                                                      2012, except for atmospheric pressure, for which data are
where N denotes the number snow layers, 1Tsnow,i is the
                                                                      available from June 2017 onwards. Data from ERA5 were
temperature difference between two subsequent measure-
                                                                      used to fill this gap by correcting for any bias based on the
ments of the ith layer, ρsnow,i is the density of the ith layer,
                                                                      period when both ERA5 and the observations were available.
and 1t is the time step, which in our case was 5 min.
                                                                      Note that the sensitivity of the model to atmospheric pressure
   The error of the thermal conductivity can be as high as
                                                                      is known to be very low. Shortwave and longwave down-
29 % according to Domine et al. (2016), while the tempera-
                                                                      welling radiation between mid-December 2019 and mid-
ture measurements of the type-T thermocouples have an ac-
                                                                      February 2020 had to be replaced by ERA5 data due to a
curacy of 0.5 ◦ C in the temperature range under study.
                                                                      malfunction of the radiometer. Errors of the forcing data vary
2.4     ISBA-Crocus simulations                                       between 1 %–3 % for temperature and humidity data and up
                                                                      to 10 % for radiation data. Precipitation data were corrected
2.4.1    Model description                                            for undercatch of solid hydrometeors using the transfer func-
                                                                      tion of Kochendorfer et al. (2017), which depends on wind
Crocus (Vionnet et al., 2012) and ISBA (Noilhan and Plan-             speed and air temperature. The error of the precipitation data
ton, 1989; Noilhan and Mahfouf, 1996) are part of SURFEX              is hard to quantify and likely depends on the wind speed.
version 8.1 (SURFace EXternalisée, Masson et al., 2013),              Kochendorfer et al. (2018) reported a root mean squared er-
a modeling platform used by Météo-France (http://www.                 ror of 0.25 mm for hourly values for the precipitation gauge
umr-cnrm.fr/surfex/, last access: 15 August 2021) to simulate         used here.
water and energy exchanges between the Earth’s surface and               A soil column of 12 m was defined and divided into 20
the atmosphere in both coupled (numerical weather predic-             layers of increasing depth. Following the soil water content
tion, climate modeling) and offline (avalanche hazard fore-           analysis from Lackner et al. (2021), we also adjusted two
casting, hydrology, surface reanalyses) applications.                 soil hydraulic parameters – the saturated soil water content
   The soil and vegetation model ISBA is coupled to Cro-              and the field capacity – to better match soil moisture obser-
cus and simulates all water and energy exchanges between              vations. The soil composition was set to 95 % sand and 5 %
the different soil layers and with the snowpack above the             silt (Gagnon et al., 2019), and the vegetation was set to 100 %
ground. For this purpose, the one-dimensional Fourier law             shrubs with heights of 40 cm, as this is the dominant vegeta-
and a mixed form of the Richards equation are solved ex-              tion type in the area. To ensure the equilibrium of soil mois-
plicitly (Boone et al., 2000; Decharme et al., 2011). The             ture and temperatures, we initialized the model with a spin-
characteristics of the vegetation are selected from a list con-       up of 5 years (2012–2017). Since observations of precipita-
taining 19 different vegetation types (ECOCLIMAP; https://            tion were not available before 2015, ERA5 data had to be
opensource.umr-cnrm.fr/projects/ecoclimap-sg/wiki, last ac-           used for the 2012–2015 period. The default version of ISBA-
cess: 15 August 2021) using the site coordinates, or alterna-         Crocus was used for this study, so no interaction between the
tively they can be specified by the user. In this study, the latter   low vegetation and snow was implemented as suggested by
option was used.                                                      some studies (Barrere et al., 2017; Gouttevin et al., 2018).
   Crocus simulates the snowpack using up to 50 snow layers           We also used the option in Crocus that allows for the surface
each defined by thickness, temperature, density, liquid water         to be 100 % covered with snow once the snow height exceeds
content, age, and two micro-structural properties (optical di-        1 cm. This was done to ensure that only contributions from
ameter and sphericity, Carmagnola et al., 2014). These prop-          snow–atmosphere interactions were considered. Lastly, we
erties evolve according to the physical processes that take           chose not to apply the option that emulates drifting snow.

https://doi.org/10.5194/tc-16-127-2022                                                        The Cryosphere, 16, 127–142, 2022
132 G. Lackner et al.: On the energy budget of a low-Arctic snowpack
Similar to previous studies where Crocus was deployed in air temperature is around −10 ◦ C and drops progressively
an Arctic setting (Barrere et al., 2017; Royer et al., 2021), until January, where it typically varies between −20 and
the density profile simulated by the model did not match the −30 ◦ C. Starting at the end of February, the air tempera-
observed one. Whereas the observed vertical snow density tures rise and the first days of positive daily temperatures
profile was rather constant, Crocus showed a strong decreas- usually occur around mid-May. For the three winters stud-
ing trend towards the snow surface (see Supplement Fig. S1). ied, hourly air temperature excursions above 0 ◦ C occurred
as early as March and consistently from mid-April. Periods
2.4.3 Calculation of the turbulent heat fluxes of warmer temperature (≥10 ◦ C) were occasionally observed
in mid-winter. The 2019–2020 winter period was marked by
In Crocus, the sensible heat flux QH is calculated using the more frequent warm spells, making it the warmest of the
aerodynamic approach. As such, it depends on the temper- three winters, with a mean temperature of −14.3 ◦ C (2017–
ature difference between the surface Ts and the air Ta , the 2018: −15.7 ◦ C; 2018–2019: −14.9 ◦ C). Hourly tempera-
wind speed U , and the turbulent exchange coefficient CH , as tures rarely dropped below −35 ◦ C, and the minimal tem-
shown below: perature recorded was −37.1 ◦ C.
Ts − Ta Wind speed shows a similar pattern from one winter to an-
QH = ρa cp CH U , (6) other. In the fall, wind speeds are generally higher due to the
5s − 5a
temperature gradient between the unfrozen and thus warmer
where ρa is the air density (in kg m−3 ), cp is the specific heat Hudson Bay to the west and the colder surrounding land
of air (in J kg−1 K−1 ), and 5s and 5a are the Exner functions surfaces. Once Hudson Bay freezes around mid-December,
for the surface and the atmosphere, respectively. wind speeds drop and display a local minimum in early Jan-
The latent heat flux follows a similar approach: uary. Wind speeds then increase later in the season to values
that are usually lower than in the fall. Only spring 2020 was
QE = (χ Lf + Lv )ρa CH U [qsat (Ts ) − qa ], (7) very windy, with three high-wind events in March and April.
Snow usually accumulates quickly in the fall as precipita-
where Lf and Lv are the latent heat of fusion and vaporization tion events are more frequent due to the large low-pressure
(in J kg−1 ), respectively, qsat (Ts ) is the saturation specific hu- systems which are prevalent at that time of year. Just as for
midity above a flat ice surface at temperature Ts (in kg kg−1 ), the wind speed, precipitation rates are presumably also in-
qa is the atmospheric specific humidity (in kg kg−1 ), and χ fluenced by Hudson Bay and drop at the end of December.
is the ratio between the solid and liquid phases of the turbu- They remain rather low until March, resulting in no substan-
lent mass exchange between the snow surface and the atmo- tial changes in the snow height. In the spring, precipitation
sphere. increases again slightly, leading to a steady increase in snow
The turbulent exchange coefficient CH is discussed in height so that the maximum values (. 1.2 m) are mostly ob-
detail in Vionnet et al. (2012) and Noilhan and Mahfouf served in April.
(1996). In short, this value depends on atmospheric stabil-
ity, represented by the bulk Richardson number, following 3.2 Surface energy budget at the snow–atmosphere
the parametrization of Louis (1979). interface
Lafaysse et al. (2017) details several available
parametrizations in Crocus. These were introduced to 3.2.1 Observations
handle turbulent fluxes under stable atmospheric conditions.
According to Lafaysse et al. (2017), the parametrization Radiation budget
of Louis (1979) tends to minimize the fluxes under very
stable conditions. To address this issue, a threshold on Radiation is the most important component of the energy
the Richardson number was implemented to maintain a budget and is highly influenced by the presence of snow. The
certain level of turbulence in such circumstances. The short and the longwave components are shown in Fig. 3, to-
option of a threshold was initially proposed by Martin and gether with the net radiation.
Lejeune (1998) and was used for the simulations performed The shortwave radiation depicted in the upper panel in
here, a choice identical to the currently operational model Fig. 3 shows one of the most important properties of snow:
configuration in French mountains. its high albedo. This results in net shortwave radiation val-
ues close to zero throughout mid-winter, which then started
3 Results to increase at the end of January. However, the net shortwave
radiation remained low at the end of winter, with maximum
3.1 Meteorological conditions daily means of around 50 W m−2 . The associated albedo var-
ied between 0.82 and 0.92.
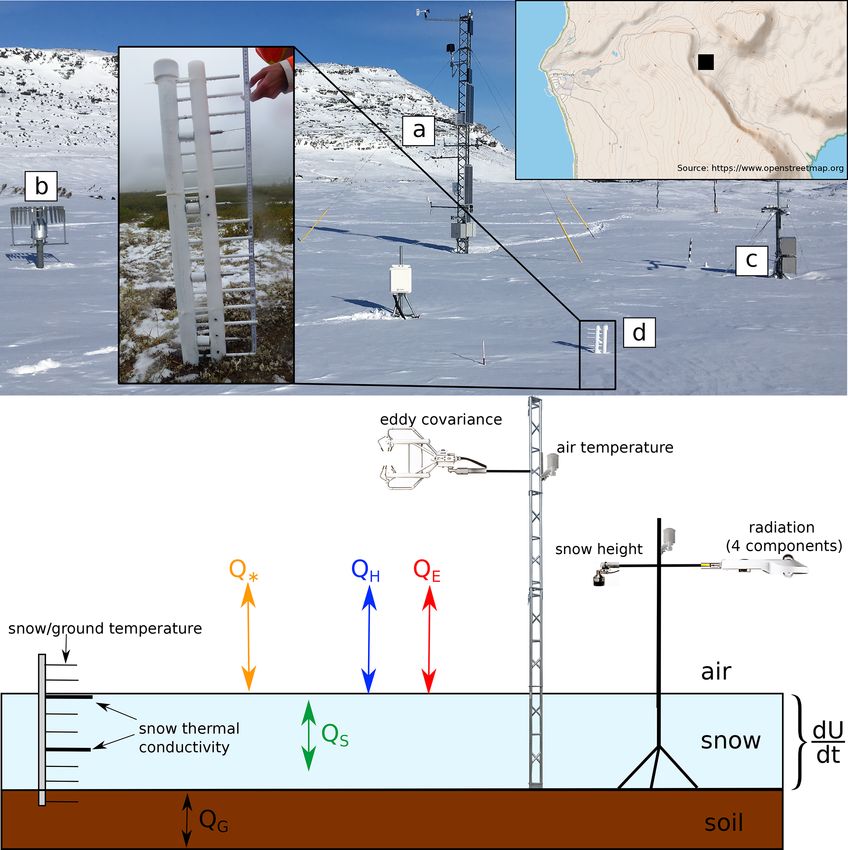
Air temperature, wind speed, and snow height during the The longwave radiation exhibits variations similar to the
three winters are shown in Fig. 2. In the fall, the daily mean air temperature variations over the winter, with minimums
The Cryosphere, 16, 127–142, 2022 https://doi.org/10.5194/tc-16-127-2022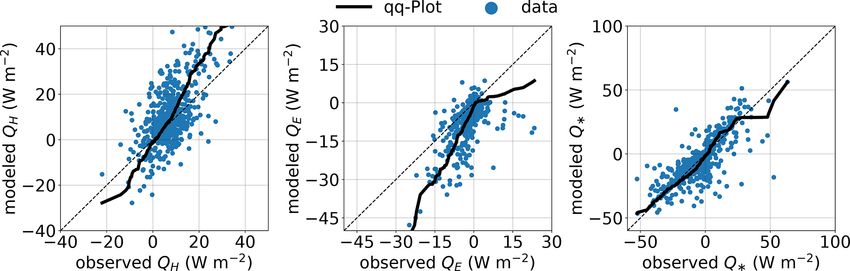
G. Lackner et al.: On the energy budget of a low-Arctic snowpack                                                                    133

Figure 2. Rolling mean of daily air temperature (Ta ), wind speed (Ws), and snow height for three consecutive winters. Labeled tick marks
on the x axis indicate the start of each month.

                                                                            Overall, the longwave radiation dominated the radiation
                                                                         budget in mid-winter and was gradually counterbalanced by
                                                                         an increase in shortwave radiation towards spring. As a re-
                                                                         sult, the total net radiation was mostly negative in the win-
                                                                         ter and thus removed energy from the snowpack. From early
                                                                         April, the net radiation became positive and thus provided
                                                                         energy to the snowpack.

                                                                         Turbulent heat fluxes

                                                                         Figure 4 shows the sensible QH and latent QE heat fluxes for
                                                                         the three winters examined in our study. Both exhibited some
                                                                         short-lived fluctuations, depending on the prevailing meteo-
                                                                         rological conditions and similar seasonal patterns. QH was
                                                                         positive throughout winter, indicating downward fluxes, ex-
Figure 3. Measured radiation budget during the winters of 2018–          cept for some brief periods where it was negative at the end
2019 (a, c, e) and 2019–2020 (b, d, f). The upper panels (a, b)          of the season. Typically, QH varied between 5 and 15 W m−2
show the upwelling and downwelling shortwave radiation; the mid-         from mid-November to mid-March and then slowly decayed
dle panels (c, d) show the corresponding longwave components; and        until the end of winter, denoting weak downward fluxes.
the lower panels (e, f) show the short, long, and total net radiation.   In addition to the general trend of decreasing sensible heat
Labeled tick marks on the x axis indicate the start of each month.       fluxes towards the end of winter, larger variations are partic-
                                                                         ularly visible during this period. These fluctuations can be
                                                                         mainly explained by variations in incoming shortwave radia-
for both upwelling and downwelling radiation in January
                                                                         tion and wind speed.
and February. However, the difference between upwelling
                                                                            The evolution of QE differs from that of QH as it shows an
and downwelling fluxes remained similar, meaning that the
                                                                         increase in fall from weak upward fluxes to fluxes near zero,
resulting net longwave radiation is more constant than its
                                                                         remains close to zero in mid-winter with regular occurrences
shortwave counterpart. Furthermore, the net longwave radia-
                                                                         of condensation events (for hourly values), and starts to de-
tion was negative, as the upwelling flux exceeded the down-
                                                                         crease in March towards weak upward fluxes. Thus, from
welling flux.
                                                                         January to early April, QE has a negligible contribution to
                                                                         the surface energy budget. Given that QE can be translated to
                                                                         sublimation (QE = Ls E, where Ls is the latent heat of subli-

https://doi.org/10.5194/tc-16-127-2022                                                           The Cryosphere, 16, 127–142, 2022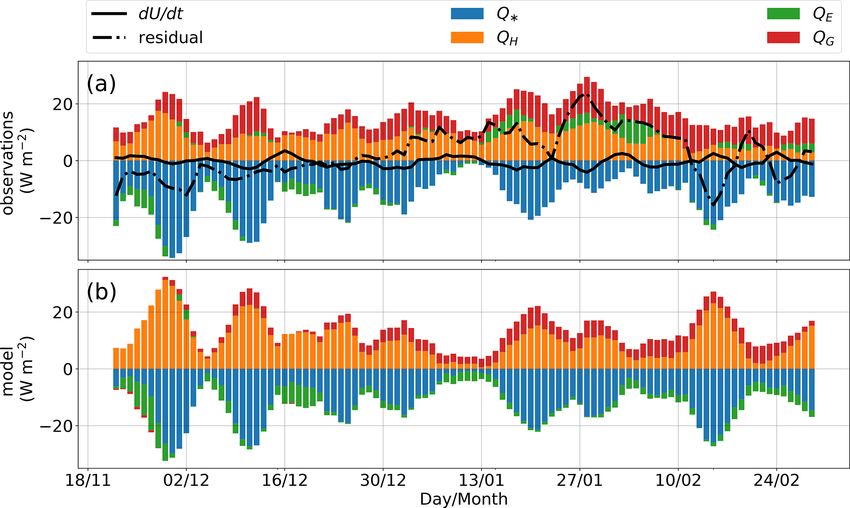
134                                                            G. Lackner et al.: On the energy budget of a low-Arctic snowpack

Figure 4. Rolling mean of measured daily sensible heat flux (QH ) and latent heat flux (QE ) for the study period. Dotted lines indicate periods
of instrument failure which have been gap-filled.

                                                                          the surface, QE depends on the vapor pressure deficit. In or-
                                                                          der to gain insight into the processes that control turbulent
                                                                          heat fluxes, the dependence of QH and QE on these variables
                                                                          is depicted in Fig. 6.
                                                                             Both QH and QE show a rather linear dependence on wind
                                                                          speed. However, while the scatter around the regression line
                                                                          is more limited for QH , for QE , the scatter increases with
                                                                          wind speed. Above ≈ 6 m s−1 , the dispersion is clearly more
                                                                          pronounced, which is the signature of blowing snow events,
                                                                          as confirmed by visual inspection of time-lapse images. As
                                                                          expected, QH decreases with higher temperature differences
Figure 5. Histogram of daily water vapor flux (values > 0 indicate        between the surface and the air. However, the lowest values
sublimation and values < 0 indicate condensation) for all three win-      are not observed for the highest temperature differences.
ters.                                                                        Another important controlling variable for QE is the va-
                                                                          por pressure deficit, which states the difference between the
                                                                          amount of water vapor the air currently holds and the amount
mation and E is the water vapor mass flux), very little snow              it can contain when it is saturated. The relationship between
is lost due to sublimation during this period. In the fall and            QE and VPD (vapor pressure deficit) is more complex than
spring, the sublimation rates were higher (> 0.15 mm d−1 )                for the previously examined quantities. High VPDs do not
but still rather low, resulting in an average of only 5 % of the          necessarily result in high QE , but the VPD clearly acts as a
precipitation being sublimated in the three winters.                      lower boundary for QE , as condensation does not occur for
   Figure 5 presents the sublimation and condensation rates               higher VPD values. As expected, we notice that condensation
for all three winters examined in this study. Positive val-               episodes (QE > 0) occur when the air is close to saturation
ues correspond to sublimation, while negative values indi-                (VPD . 0.2 kPa).
cate condensation. The rates are mostly very low and close
to zero. Only about 14 % of the days had sublimation rates                3.2.2    Modeling
higher than 0.2 mm d−1 . Condensation occurred regularly,
but values were generally below 0.2 mm d−1 , with only a few              Turbulent heat fluxes and radiation
exceptions.
   As indicated by Eqs. (6) and (7), when typical modeling                Daily means of the turbulent heat fluxes QH , QE , and the net
approaches are used, both QH and QE values are expected                   radiation Q∗ time series simulated by ISBA-Crocus are com-
to be affected by wind speed, but while QH is additionally                pared to observations in Fig. 7. Both QH and QE show con-
dependent on the temperature difference between the air and               siderable scatter that is reflected in a relatively small Pearson

The Cryosphere, 16, 127–142, 2022                                                                https://doi.org/10.5194/tc-16-127-2022
G. Lackner et al.: On the energy budget of a low-Arctic snowpack 135
Figure 6. Scatter plot of hourly values of sensible (QH , upper row) and latent (QE , lower row) heat fluxes against some key meteorological
variables: (a, c) wind speed, (b) temperature difference between the air and the snow surface, and (d) vapor pressure deficit. The color code
indicates the density of points, where yellow represents high density and blue low density. The red line shows a linear regression.
correlation of 0.67 for QH and 0.72 for QE . The mean bias At the surface, net radiation is mainly counterbalanced by
is rather small, with 2.9 W m−2 for QH and 4.2 W m−2 for QH , as QE is negligible in mid-winter. The diurnal cycle of
QE . The q–q plot for QH reveals some discrepancies for high QS very closely follows Q∗ (except 17 March). The transi-
and low values, which are over- and underestimated, respec- tion from positive to negative values corresponds to increases
tively. For observations in the interdecile range, only a slight in snow temperature, which were highly variable in the pe-
overestimation is detectable. The model underestimates QE riod shown (see Supplement Fig. S4). The snow heat flux
on all the observed values and more markedly at both ends mostly follows the residual within about 15 W m−2 except at
of the distribution. Q∗ is accurately simulated along most the end of the period shown in Fig. 8. During that period, the
of the range of observed values. Only minor deviations are differences become larger, up to about 40 W m−2 . At certain
observed for very low and very high observed values. The moments, a few hours of phase shifting between the residual
correlation between simulated and observed Q∗ of 0.73 is and the snow heat flux can be observed, which might be due
slightly better than QH and QE , just as the mean bias, which to an inaccurate simulation of the snow thermal conductiv-
is 1.6 W m−2 . ity. The deviation between the measured snow heat flux and
The Pearson correlation between the modeled and ob- the residual snow heat flux could not be associated with any
served turbulent heat fluxes is sensitive to the averaging time change in the meteorological conditions, and its source thus
used. While it drops for QH and QE when the averaging time remains unclear. The mean difference between the residual
is decreased from daily to hourly means (0.53 for QH and and measured snow heat flux is 7.7 W m−2 .
0.64 for QE ), it stays constant at 0.73 for Q∗ (see Supple- Although Fig. 8 represents a short time period, it allows for
ment Fig. S3). the visualization of the behavior of the model on an hourly
scale. There is a good agreement between modeled and ob-
served Q∗ , except for the last 2 d, where a deviation of 10
Surface energy budget
to 50 W m−2 separates both curves. QH is well simulated at
times, but there are periods during which the discrepancy be-
A comparison between model outputs and observations for tween the simulated and direct observations is larger (up to
all constituents of the surface energy budget using a control 30 W m−2 ) and even includes an error in the sign of the flux
surface framework (Eq. 1) for a 9 d period is presented in (18 March). QE is also very well simulated but with very lit-
Fig. 8. This period was chosen carefully to ensure quality tle variations during this period, while the mean observed de-
data. All instruments functioned properly, and the snow cover viation for QS is 3 W m−2 . During the period shown in Fig. 8
height was relatively stable at around 55 cm, with one ther- and throughout the study period, the modeled albedo was al-
mal conductivity sensor and two temperature sensors very ways in the same range as observations (differences < 0.05).
close to the snow surface (at heights of 47, 49.5, and 52 cm, The mean modeled albedo was 0.01 greater than observa-
respectively). The residual snow heat flux in Fig. 8 is ob- tions.
tained by subtracting the heat fluxes from the radiation.
https://doi.org/10.5194/tc-16-127-2022 The Cryosphere, 16, 127–142, 2022136 G. Lackner et al.: On the energy budget of a low-Arctic snowpack
Figure 7. Comparison between daily means of modeled and observed QH , QE , and Q∗ for all three study winters. Overlain is a quantile–
quantile plot.
dU/dt = Q∗ +QH +QE + QG +Res, where the advec-
tive heat input QA is neglected.
On the observation side (Fig. 9a), as noted in Fig. 3, net ra-
diation is negative during the first few months of the winter.
We note that these radiative losses are largely compensated
for by sensible energy input from the atmosphere and heat
flux from the ground. The latent heat flux plays a very modest
role in snowpack energy exchange, alternating between peri-
ods of heat input through condensation and periods of heat
loss through sublimation. Periods of low net radiation are as-
sociated with times when the residual is significant. Finally,
the rate of change of the snow internal energy is low, indicat-
ing periods of warming and cooling of the snowpack, with
no clear trend over the period examined. The ground heat
flux QG represents a substantial part of the energy budget of
the snowpack. In early winter, it is the second largest energy
flux after QH , but towards spring, QG gradually increases
and becomes the most important flux, counterbalancing Q∗ .
The rate of change of internal energy remains very small
all throughout the study period and is not equal to the energy
remaining after subtracting the turbulent and ground heat
fluxes from the net radiation. Thus, the unexplained resid-
Figure 8. Comparison between observed and modeled hourly ual constitutes a significant proportion of the energy balance,
means of all constituents of the energy budget at the snow surface with a mean of 6.8 W m−2 for the entire period and with max-
from 14 to 23 March 2020. The residual snow heat flux is obtained ima of up to 20 W m−2 . From mid-November until the end
by subtracting the turbulent heat fluxes from the net radiation. Also of December, during which the agreement is better, the mean
shown are the air and surface temperatures during this period. residual is 3.8 W m−2 .
The simulated energy budget in Fig. 9b) compares very
well to the observed budget in Fig. 9a). The model accurately
simulates the main temporal patterns and, in general, follows
Energy budget of the snowpack the observed flux partitioning. As we saw earlier (Fig. 7), Q∗
is well simulated, but this is less true for QH and QE . The
The energy budget at the snow surface can only be analyzed model overestimates QH especially during the first and last
when thermal conductivity and snow temperature measure- months under study. However, QE is almost always nega-
ments are available very close (. 10 cm) to the surface. As tive (sublimation) according to the model, while 47 % of the
these periods are rather limited, we present the analysis of days still show a positive QE (condensation). Another strik-
the energy budget over the whole snowpack in Fig. 9 for ing difference is the role of QG in the energy balance. The
both the observations and simulations, over a period of 100 d. contribution of QG is much smaller in the model (31 % of
The observed residual in Fig. 9 is calculated using only ra- Q∗ on average) than in the observations (47 % of Q∗ ).
diation, turbulent heat fluxes, the ground heat flux, and the
internal energy of the snowpack according to the equation
The Cryosphere, 16, 127–142, 2022 https://doi.org/10.5194/tc-16-127-2022G. Lackner et al.: On the energy budget of a low-Arctic snowpack 137
Figure 9. (a) Observed and (b) simulated daily snowpack energy budget terms comprising sensible (QH ) and latent heat fluxes (QE ), net
radiation (Q∗ ), ground heat flux (QG ), and the change in the internal energy of the snowpack dU/dt, during the first half of winter 2018/19.
The modeled ground heat flux also includes the heat storage change dU/dt in the snowpack. The modeled snow enthalpy change is not
shown because it includes changes due to precipitation and is therefore not comparable to observations.
4 Discussion Table 1. Distribution of atmospheric stability based on the bulk
Richardson number Rib , where Rib < 0 indicates unstable condi-
tions, 0 ≤ Rib ≤ 0.25 implies weakly stable conditions, and Rib >
4.1 Turbulent heat fluxes and radiation
0.25 indicates stable conditions.
The sensible heat flux exhibited a consistent seasonal pat- Unstable Weakly stable Stable
tern during all 3 years (Fig. 4) despite varying meteorologi-
22.1 % 66.5 % 11.4 %
cal conditions. This suggests that there is a consistent limit-
ing factor that prevents large sensible heat fluxes. The energy
input would allow for greater QH as the site is located south
of the polar circle (56◦ 330 N) where there is no polar night. (Rib > 0.25), with unstable stratification (Rib < 0) making
At sites at much higher latitudes in Siberia (72◦ 220 N) (West- up only 22.1 %. For 66 % of the time, the boundary layer is
ermann et al., 2009) and Svalbard (78◦ 550 N) (Langer et al., weakly stably stratified, meaning that buoyancy acts to limit
2011), the average sensible heat fluxes were found to have a the magnitude of the turbulent fluxes.
similar range (between 5 and 15 W m−2 ) to the one identified Atmospheric stratification likely influences the capacity of
in this study. the model to simulate the turbulent heat fluxes. The model
In order to better understand the magnitude of the sensi- accurately reproduced the observed turbulent heat fluxes on
ble heat flux, we examine atmospheric stratification, which large timescales (daily and longer periods) while showing
is usually divided into three turbulence regimes (Steeneveld, larger errors for sub-daily periods. The most probable rea-
2014; Mahrt, 2014). First, in a very stable boundary layer, son for the degradation associated with shorter timescales
turbulence is relatively weak and intermittent, and the flow is the increasing influence of atmospheric stability on the
is dominated by drainage winds and other mesoscale mo- heat fluxes. Modeling turbulent heat fluxes under stable at-
tions. Second, in a weakly stable boundary layer, the atmo- mospheric conditions is thus clearly more complex. There
sphere remains stably stratified (the potential temperature in- are three parametrizations available (Lafaysse et al., 2017) in
creases with height), but turbulence becomes the dominant Crocus that handle atmospheric stability. One of these sets
type of transport. Thirdly, in an unstable boundary layer, a limit to the bulk Richardson number and thereby main-
the potential temperature decreases with height and turbu- tains a minimum level of turbulent mixing even for sta-
lence is fully developed. We calculated the bulk Richardson ble conditions. In this study, we noticed only small differ-
number Rib between the snow surface and the measurement ences between these three options (< 1 W m−2 at the daily
level of the eddy covariance (Table 1) to identify the domi- scale), whereas major differences were reported from Col de
nant atmospheric regimes at our site. The stratification was Porte, France, as well as at almost all the sites in the ESM-
found to be mostly weakly stable (0 ≤ Rib ≤ 0.25) or stable SnowMIP dataset (Ménard et al., 2019). This is probably be-
https://doi.org/10.5194/tc-16-127-2022 The Cryosphere, 16, 127–142, 2022138 G. Lackner et al.: On the energy budget of a low-Arctic snowpack
cause our site is windy, which helps to keep Rib low and Although it suffers from a lack of evaluation, a
away from the very stable conditions that are more difficult parametrization of the sublimation of blowing snow from
to handle. Nevertheless, our results objectively confirm the Gordon et al. (2006) was implemented in Crocus by Vion-
statement of Menard et al. (2021) that turbulent fluxes are by net et al. (2012). However, we did not apply this option, and
far the most uncertain component of the energy balance sim- thus the simulations from Crocus only include the sublima-
ulation in snow cover modeling. We therefore highly recom- tion from the surface. We chose to omit the blowing snow
mend future complementary evaluations of turbulent fluxes simulation because most occurrences of blowing snow co-
of snow cover models, as was done in this paper for var- incided with instrument malfunctions and no measurements
ious climate and environments. Meanwhile, further studies were recorded.
are underway at the site targeted in this study to evaluate Similar to other sites with comparable climate conditions,
optimal turbulent heat flux parametrizations, particularly for longwave radiation was the main component of the radia-
sub-daily timescales. tion budget, with shortwave radiation becoming more sub-
In addition to the atmospheric stratification, VPD is an- stantial in spring. The mean albedo of 0.85 was also in the
other important factor impacting QE . At our site, we ob- expected range of what is typically found for snow that is
served very low QE values, coinciding with periods of in- largely free of surface impurities (Warren, 1982; Gardner and
tense cold (.− 15 ◦ C) when the atmosphere can accommo- Sharp, 2010).
date a very limited amount of water vapor. We hypothesize
that moist air advected from Hudson Bay might further re- 4.2 Energy budget
duce the VPD and thus QE , as westerly winds were fre-
quently observed and Hudson Bay remains unfrozen until Over a short period of 9 d (Fig. 8), the snow heat flux was
mid- to late December. These two factors, combined with the found to be of the same order of magnitude as the turbulent
prevalence of stable atmospheric conditions, likely explain fluxes and thus plays a vital role in the surface energy budget.
the fact that sublimation losses represent only 5 % of win- Meaningful measurements of the snow heat flux are difficult
ter snowfall, while other studies (Pomeroy and Essery, 1999; to obtain, as various limitations of the measurements have
Liston and Sturm, 2004) have reported much higher percent- to be overcome, including the limited spatial representativ-
ages (10 %–50 %) in other locations in the Canadian Arctic. ity of the snow thermal measurements and the frequent high
On the other hand, the winter precipitation is quite high at winds which erode and accumulate snow, resulting and rapid
our site, which naturally decreases the fraction of sublima- spatial changes in snow height. Furthermore, wind pump-
tion losses to precipitation. Furthermore, sublimation during ing, the forced airflow through the upper layers of the snow-
blowing snow events, which frequently occur at the site (ob- pack (Colbeck, 1997), and solar radiation can disturb snow
served several times per week on time-lapse images), could heat flux measurements. Thus, we advocate that the con-
be substantially underestimated for two reasons. First, snow trol surface approach should be restricted to short-term stud-
particles can obstruct the optical path of the infrared gas an- ies but under favorable conditions (stable snow height and
alyzer and cause a malfunction. Thus, QE observations dur- less stable atmospheric conditions). The measured snow heat
ing these events are marked by greater uncertainty. Second, flux has the same magnitude as the residual snow heat flux,
snow particles during blowing snow events can be lifted sev- thereby confirming that no major energy flux is missing.
eral meters in the air and thereby above the eddy covariance For a long-term energy budget study, the control volume is
system, which is installed at 4.2 m above the ground. Snow better suited as it does not require thermal conductivity close
particles that sublimate above the instrument cannot be mea- to the surface. However, the closure issue is worse. Firstly,
sured, which then leads to an underestimation of the total this method requires temperatures to be measured close to the
sublimation rate. Yet, Mann et al. (2000) measured snow par- surface and thus comes with the same challenges mentioned
ticle density profiles during blowing snow events in Antarc- above. Secondly, the method relies on the snow density pro-
tica and showed that the decrease in snow particle density file, which could not be regularly measured in this study
can be approximated by a power law. This suggests that the (only once per year towards the end of winter), as the site
fraction of blowing snow sublimation above the flux system is very remote. Additionally, the density profile is spatially
is most likely rather small. The authors also showed that the variable. We however estimate that the error for density is
air can become almost fully saturated within several meters not very large (. 50 kg m−3 ) based on density measurements
above the surface, which then acts to reduce the sublimation from earlier in the winter in previous years. Assuming this
rate during blowing snow events. Altogether, there are still error in our calculations, the corresponding error in the heat
many unknowns with snow sublimation measurements, and change is presumably less than 0.5 W m−2 per 5 cm layer.
these unknowns may be the source of many possible errors. Thus, inaccurate density estimates very likely contribute to
Therefore, there is considerable inherent uncertainty associ- the energy imbalance, but they cannot be the main cause.
ated with measurements of the total amount of snow that is Modeled density profiles from Crocus were tested, but the
sublimated in a winter. error for density, particularly in the upper part of the snow
cover, exceeded those taking a constant profile. Helgason
The Cryosphere, 16, 127–142, 2022 https://doi.org/10.5194/tc-16-127-2022G. Lackner et al.: On the energy budget of a low-Arctic snowpack 139
and Pomeroy (2012) attributed part of their residual to the evolution and inter-annual changes of its constituents, which
fact that the boundary layer might have decoupled from the mainly consisted of radiation and turbulent heat fluxes. We
surface, thereby “rendering the measured eddy-covariance then compared observations with the simulated time series
fluxes unrepresentative of the true surface heat fluxes”. Al- from the ISBA-Crocus land surface model. Secondly, during
though this might be true for some of the measurements pre- two selected periods, we compared observed and modeled
sented in our study, based on the fact that snow heat fluxes fluxes using a control surface at the snow–atmosphere inter-
and residuals are of the same magnitude when looking only face and a control volume that encompassed the snowpack.
at the surface energy budget, we believe that the residual is In line with previous studies, we found that the sensible
mostly due to measurement uncertainties. heat flux was far superior to the latent heat flux and provided
The ground heat flux is also likely to contribute to the un- heat to the snowpack during most of the winters. The subli-
balanced energy budget because unfortunately our measure- mation rates were rather low (< 0.4 mm d−1 ) and made up
ment setup did not allow us to calculate the storage of heat only around 5 % of the winter precipitation, which is low
in the top layer of the soil (≈ 4 cm). However, the heat flux compared to some studies that have reported up to 30 % and
at the bottom of the snowpack (≈ 7 cm) was measured us- more. We hypothesize that this is mainly due to cold air and
ing the same principles as the heat fluxes at the surface, and that the associated low vapor pressure deficit and sublimation
the agreement between this flux and the ground heat flux in- during blowing snow events are possibly undermeasured.
creases our confidence that the measured ground heat flux At the surface, net radiation was counterbalanced about
does not have substantial errors. As the heat change of the equally by the sensible heat flux and the heat flux in the
snowpack is very small, the majority of the radiation that is snow. For the control volume, the ground heat flux was found
not counterbalanced by the turbulent heat fluxes above the to be the most important heat flux after the sensible heat
snow surface is used to cool the soil. flux, meaning that there is little energy stored in the snow-
Simulations of QH and QE greatly affect the simulated pack. The imbalance of the energy budget was more apparent
heat fluxes into the snow and ground because heat fluxes into when considering the whole snowpack, so we concluded that
the snow are calculated as a residual in the model. This can a large portion of the imbalance was due to errors associated
be seen in Fig. 9, at the beginning of the period illustrated with the heat fluxes in the snowpack.
until approximately the end of December, when QH is over- Overall ISBA-Crocus was able to simulate the main com-
estimated and, consequently, QG is underestimated. In the ponents of the energy budget reasonably well, especially
second half of the period, the situation changes, and QH in considering their small magnitudes. The turbulent fluxes
the simulation has a similar magnitude as in the observations, had much larger errors than the radiative fluxes. The model
and the estimates of QG become closer to that of the ob- showed a particular weakness when simulating fluxes under
servations. For this reason, a proper simulation of QH and stable atmospheric conditions, which resulted in a decrease
therefore also of the atmospheric stability is crucial for the in performance from a daily to hourly scale.
simulation of ground temperature and permafrost melt.
4.2.1 Comparison to previous modeling attempts Code availability. The source files of SURFEX code are provided
at the Git repository (http://git.umr-cnrm.fr/git/Surfex_Git2.git,
Studies comparing the full simulated and observed energy last access: 20 June 2021, Masson et al., 2013) with sev-
balance of an Arctic snowpack are sparse. Westermann et al. eral code management tools (history management, bug fixes,
(2016) used CryoGrid 3 (https://github.com/CryoGrid, last documentation, interface for technical support, etc.). Reg-
istration is required; a description of the procedure is de-
access: 15 August 2021) to simulate the energy budget of a
scribed at https://opensource.cnrm-game-meteo.fr/projects/
polygon tundra site in Siberia. They reported that the model
snowtools/wiki/Procedure_for_new_users (last access: 25
satisfactorily reproduced the winter energy balance but also July 2021). EddyPro® is available on the LI-COR website
found that it underestimated all heat fluxes. Helgason and (https://www.licor.com/env/support/EddyPro/software.html,
Pomeroy (2012) used the SNTHERM model in the central Fratini and Mauder, 2014) together with the corresponding manual.
Canadian Prairies. They found that the latent heat flux and PyFluxPro is provided in the Git repository of OzFlux (https:
dU/dt were well simulated, while the sensible heat flux was //github.com/OzFlux/PyFluxPro; last access: 25 July 2021). The
overestimated. However, they concluded that the sensible different levels are described by Isaac et al. (2017).
heat flux was undermeasured and that the modeled flux was
more applicable.
Data availability. Data are available upon request from the authors.
5 Conclusions
Supplement. The supplement related to this article is available on-
line at: https://doi.org/10.5194/tc-16-127-2022-supplement.
In this study, we investigated the energy budget of a low-
Arctic snowpack over three winters. Firstly, we analyzed the
https://doi.org/10.5194/tc-16-127-2022 The Cryosphere, 16, 127–142, 2022You can also read