Modern silicon dynamics of a small high-latitude subarctic lake
←
→
Page content transcription
If your browser does not render page correctly, please read the page content below
Biogeosciences, 18, 2325–2345, 2021
https://doi.org/10.5194/bg-18-2325-2021
© Author(s) 2021. This work is distributed under
the Creative Commons Attribution 4.0 License.

Modern silicon dynamics of a small high-latitude subarctic lake
Petra Zahajská1,5 , Carolina Olid2 , Johanna Stadmark1 , Sherilyn C. Fritz3 , Sophie Opfergelt4 , and Daniel J. Conley1
1 Department   of Geology, Lund University, Lund, Sweden
2 Department   of Ecology and Environmental Science, Umeå University, Umeå, Sweden
3 Department of Earth and Atmospheric Sciences and School of Biological Sciences,

University of Nebraska-Lincoln, Lincoln, Nebraska, USA
4 Earth and Life Institute, Université catholique de Louvain, Louvain-la-Neuve, Belgium
5 Institute of Geology and Palaeontology, Faculty of Science, Charles University, Prague, Czech Republic

Correspondence: Petra Zahajská (petra.zahajska@geol.lu.se)

Received: 26 November 2020 – Discussion started: 11 December 2020
Revised: 19 February 2021 – Accepted: 25 February 2021 – Published: 13 April 2021

Abstract. High biogenic silica (BSi) concentrations occur          1   Introduction
sporadically in lake sediments throughout the world; how-
ever, the processes leading to high BSi concentrations vary.       Diatoms – unicellular golden-brown algae – are found world-
We explored the factors responsible for the high BSi concen-       wide in all aquatic environments, wetlands, and soils (Bat-
tration in sediments of a small, high-latitude subarctic lake      tarbee et al., 2002; Clarke, 2003). Diatoms take up dissolved
(Lake 850). The Si budget of this lake had not been fully          silicic acid, H4 SiO4 , expressed here as dissolved silica (DSi),
characterized before to establish the drivers of BSi accumu-       and build their shells in the form of amorphous silica, also
lation in this environment. To do this, we combined mea-           known as biogenic silica (BSi). Diatom production is thus
surements of variations in stream discharge, dissolved silica      a crucial component in the global Si cycle (Tréguer and
(DSi) concentrations, and stable Si isotopes in both lake and      De La Rocha, 2013). Massive accumulations of fossil di-
stream water with measurements of BSi content in lake sed-         atom frustules in sediments have been observed in multiple
iments. Water, radon, and Si mass balances revealed the im-        lakes situated in silicon-rich environments, especially on vol-
portance of groundwater discharge as a main source of DSi to       canic bedrock, such as Lake Challa, Tanzania–Kenya (Barker
the lake, with groundwater-derived DSi inputs 3 times higher       et al., 2013), or in hydrothermally active areas, such as Yel-
than those from ephemeral stream inlets. After including all       lowstone Lake, US (Theriot et al., 2006), or Lake Mývatn,
external DSi sources (i.e., inlets and groundwater discharge)      Iceland (Opfergelt et al., 2011). However, lakes without vol-
and estimating the total BSi accumulation in the sediment,         canism can also accumulate high concentrations of BSi in
we show that diatom production consumes up to 79 % of to-          the sediment (Frings et al., 2014). One example is high-
tal DSi input. Additionally, low sediment accumulation rates       elevation and high-latitude lakes, where BSi concentrations
were observed based on the dated gravity core. Our find-           as high as 60 weight percent (wt %) of SiO2 have been found
ings thus demonstrate that groundwater discharge and low           (Frings et al., 2014; Rosén et al., 2010). In addition, high
mass accumulation rate can account for the high BSi accu-          BSi concentrations in sediment have been observed in Lough
mulation during the last 150 cal yr BP. Globally, lakes have       Neagh, Northern Ireland (Plunkett et al., 2004); Lake Baikal
been estimated to retain one-fifth of the annual DSi terres-       (Swann and Mackay, 2006); Lake Edward (Russell and John-
trial weathering flux that would otherwise be delivered to         son, 2005); and Lake Malawi (Johnson et al., 2011). The pro-
the ocean. Well-constrained lake mass balances, such as pre-       cesses responsible for the diatom-rich sediment formation in
sented here, bring clarity to those estimates of the terrestrial   these non-volcanic settings, however, are poorly understood.
Si cycle sinks.

Published by Copernicus Publications on behalf of the European Geosciences Union.
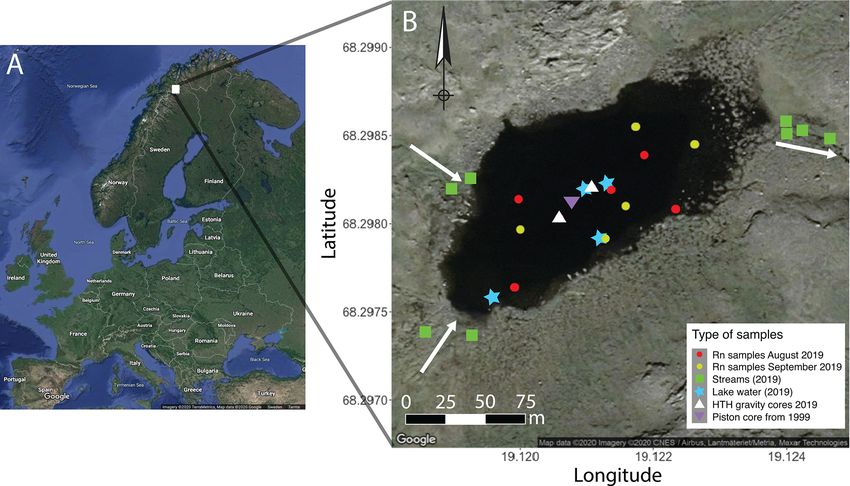
2326                                    P. Zahajská et al.: Modern silicon dynamics of a small high-latitude subarctic lake

   High BSi accumulation in sediment has been hypothesized        2     Study area
to require sufficient DSi in the water column for diatoms
to grow and low detrital input to minimize dilution of au-        Lake 850 (68◦ 150 N, 19◦ 070 E) is located 14 km southeast
tochthonous BSi (Conger, 1942). DSi ultimately originates         from the Abisko Research Station (388 m a.s.l.), northern
from weathering of bedrock, and it is transported by rivers       Sweden. From 1913 to 2019, the mean annual surface at-
through the environment where it can be removed by biolog-        mospheric temperature was −0.4 ◦ C, whereas during the
ical or chemical processes, such as secondary clay mineral        study years (2018–2019) the mean annual temperature was
formation or amorphous silica precipitation (Jenny, 1941).        0.03 ◦ C. Further, the mean surface atmospheric temperature
DSi concentrations in the environment are influenced by fac-      during the aquatic growing season in 2018–2019 (June to Au-
tors such as vegetation type (Jenny, 1941; Leng et al., 2009;     gust) was 10.1 ◦ C (1 SD = 2.8 ◦ C), and the long-term (1913–
Struyf et al., 2010) and bedrock type (Jenny, 1941; Opfer-        2019) mean summer temperature was 9.8 ◦ C (1 SD = 3.6 ◦ C)
gelt and Delmelle, 2012) and indirectly by climate forcing        (ANS, 2020). During the ice-free period direct surface pre-
(Fortin and Gajewski, 2009; Jenny, 1941) or watershed geo-        cipitation contribution from the watershed was estimated
morphology (Jenny, 1941). In particular, attention has been       from the mean precipitation of 48 mm month−1 (ANS, 2020).
paid to the relative importance of groundwater discharge as       Lake 850 lies above the tree limit (600 m a.s.l) at 850 m a.s.l.
a main source of DSi for a few lakes, such as Lake O’Hara,        The lake surface area is 0.02 km2 , with a maximum depth
British Columbia (Hood et al., 2006); Lake Mývatn, Iceland        of 8 m and a catchment area of 0.35 km2 (Rubensdotter and
(Opfergelt et al., 2011); Crystal Lake, Wisconsin (Kenoyer        Rosqvist, 2003). The lake’s deep basin represents 48 % of
and Anderson, 1989; Hurley et al., 1985); at the mouth of         the lake surface area. The underlying bedrock is composed
the Changjiang river system, China (Zhang et al., 2020);          of granites and syenites and is overlain by a thin layer of till.
and in Canadian and Siberian rivers (Maavara et al., 2018;        The catchment vegetation is comprised of Arctic species of
Pokrovsky et al., 2013). However, the significance of ground-     mosses, grasses, and shrubs (Shemesh et al., 2001). There
water discharge is still often overlooked in studies about Si     are two ephemeral inlets (max 6 cm deep) in the eastern part
dynamics in lakes.                                                of the lake and one outlet (10 cm deep) in the western part
   The contribution of groundwater to the lake Si cycle can       (Fig. 1, Table S1). In addition to streams, additional sources
be evaluated using Si isotopes. Stable Si isotopes are used       of water to rivers and lakes can be snow patches or inputs of
to trace variation in DSi sources or diatom production and        groundwater (Pienitz et al., 2008). From mid-October until
discern processes affecting BSi accumulation in lake sedi-        late May–early June, the lake is ice-covered. The catchment
ments. Among the three stable isotopes (28 Si, 29 Si and 30 Si)   is snow-covered from mid-September to mid-June. In Au-
diatoms preferentially take up the lighter 28 Si (De La Rocha     gust, the lake is well-mixed, with no thermal stratification.
et al., 1997). Diatoms tend to fractionate the Si isotopes with   The lake is classified as oligotrophic and has a pH of 6.8
a fractionation factor of −1.1 ‰ (De La Rocha et al., 1997),      and a dissolved organic carbon concentration of 2.3 mg L−1
which means that the diatom BSi will have an isotopically         (Shemesh et al., 2001).
lighter ratio compared to the source DSi. Riverine DSi usu-
ally shows isotopically heavier ratios compared to ground-
water, as there are more processes that fractionate Si iso-
topes during river transport (Frings et al., 2016; Opfergelt      3     Numerical analyses – mass balance models
and Delmelle, 2012; Sutton et al., 2018). Therefore, stable Si
isotopes are an ideal tracer for the contribution of groundwa-    3.1    Radon mass balance
ter.
   Here, we investigate the diatom-rich sediment formation in     Radon (222 Rn, hereafter Rn) is produced from the radioac-
Lake 850 through water and silicon mass balances. Lake 850,       tive decay of 226 Ra (Ra hereafter) present in rocks, soils, and
northernmost Sweden, is an ideal case study with a high con-      sediments. Radon emanates from Ra-bearing minerals, en-
tent of BSi in the sediment, ca. 40 wt % (Rosén et al., 2010).    ters the groundwater, and is transported through the aquifer.
Oxygen isotopes from diatoms suggested that the lake’s iso-       Groundwaters usually contain Rn concentrations orders of
topic ratio is mostly influenced by summer precipitation and      magnitude higher than surface waters, and groundwater dis-
variations in the ephemeral inlet streams (Shemesh et al.,        charging into surface waters can thus be easily detected by
2001). Unlike previous studies in this lake, we hypothesize       a Rn enrichment with respect to surface waters (Burnett and
that groundwater discharge is an important mechanism con-         Dulaiova, 2003).
trolling lake DSi concentrations. To test this hypothesis, we        Groundwater discharge into Lake 850 was quantified using
estimate groundwater flows discharging into the lake using a      a Rn mass balance approach and assuming steady state (Di-
water and a radon (222 Rn) mass balance. DSi concentration        mova and Burnett, 2011; Dimova et al., 2013). For steady-
and stable Si isotope mass balances were used to determine        state conditions, the groundwater flow discharging into the
Si sources for the diatom-rich sediment deposited in recent       lake can be determined by the imbalance between all Rn
decades.                                                          sources and loss terms (Eq. 1).

Biogeosciences, 18, 2325–2345, 2021                                                  https://doi.org/10.5194/bg-18-2325-2021
P. Zahajská et al.: Modern silicon dynamics of a small high-latitude subarctic lake                                                2327

Figure 1. Sampling sites of Lake 850 (northern Sweden). Inlets and outlet streams are signified by white arrows. Plotted in R using the
package ggmaps (Kahle and Wickham, 2013) and modified.

   The sources of Rn are the main inlet streams (n = 2), Rn           where k is the gas transfer coefficient [m d−1 ] based on an
production by dissolved Ra in the water column, Rn diffu-             empirical relationship that relates k with wind speed and lake
sion from underlying sediments, and groundwater discharge.            area (Vachon and Prairie, 2013), and α is the air–water par-
Radon losses include radioactive decay, atmospheric eva-              titioning of Rn corrected for salinity and temperature (Schu-
sion, and losses through outlet streams (n = 1). Losses by            bert et al., 2012).
recharge into underlying aquifers are considered minor, be-               The steady-state assumption implies that Rn sources and
cause the concentration of Rn seeping into sediments is usu-          Rn sinks are balanced and constant with respect to the
ally much lower than that seeping into the lake (Dimova and           timescale of Rn within the system. The residence time of Rn
Burnett, 2011). By evaluating all Rn source and loss terms,           in the lake can be calculated by dividing the Rn inventory in
the groundwater flow discharging into the lake can be deter-          the lake water by the sum of all tracer losses using the equa-
mined using the following equation:                                   tion
Qgw Rngw + Fsed A + λRalake V + Qin Rnin                                            1
                                                                      tRn ≈        Qout
                                                                                                 ,                                   (3)
= Fatm A + λRnlake V + Qout Rnout ,                          (1)              λ+    V     + hk
where Qgw is the unknown groundwater discharge [m3 d−1 ];             where λ is the radioactive decay constant of Rn [d−1 ], Qout
Qin and Qout are the discharge from inlet and outlet streams          is the discharge from the outlet stream, V is the lake volume,
[m3 d−1 ], respectively; Rnlake and Rngw are the concentra-           k is the gas transfer coefficient [m d−1 ] based on an empiri-
tions of Rn [Bq m−3 ] in lake water and groundwater, respec-          cal relationship that relates k with wind speed and lake area
tively; Rnin and Rnout are the concentrations of Rn [Bq m−3 ]         (Vachon and Prairie, 2013), and h is the lake depth [m].
in the main inlet and outlet streams, respectively; Ralake is            Groundwater discharges (Qgw ) were estimated for August
the concentration of Ra in the lake water column [Bq m−3 ];           and September 2019. For the remaining months, we interpo-
Fsed is the net diffusive flux of Rn per unit area from lake          lated the estimated values by assuming two different scenar-
sediments [Bq m−2 d−1 ]; Fatm is the loss of Rn to the atmo-          ios of (i) constant or (ii) variable groundwater inflows over
sphere [Bq m−2 d−1 ]; λ is the radioactive decay constant of          the year (see Appendix A1) for variable groundwater inflows
Rn [d−1 ]; and A [m2 ] and V [m3 ] are the area and volume of         scenario).
the lake, respectively.
   The calculation of Rn loss to the atmosphere was based on
the empirical equation by MacIntyre et al. (1995):
Fatm = k (Rnlake − αRnair ) ,                                (2)

https://doi.org/10.5194/bg-18-2325-2021                                                              Biogeosciences, 18, 2325–2345, 2021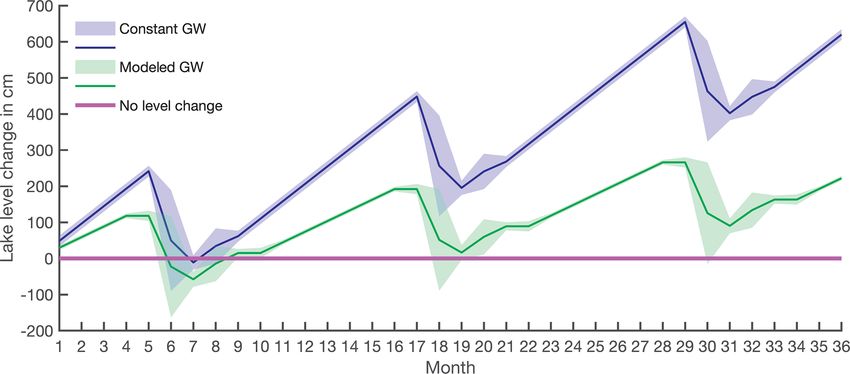
2328                                    P. Zahajská et al.: Modern silicon dynamics of a small high-latitude subarctic lake

3.2    Water balance                                             thus groundwater DSi concentrations. The scenario better de-
                                                                 scribing recent diatom production considers that the diatom
The lake water balance was calculated from the volumetric        growing season and thus the BSi flux occur in 4 months, from
water balance equation:                                          June until August, in a year (Shemesh et al., 2001), and that
                                                                 scenario is presented here.
1V = Qin + P + Qgw − Qout − E,                             (4)
                                                                 3.4    Silicon isotope mass balance
where 1V is the change in lake water volume; Qin and Qout
are the stream inflow and outflow, respectively; Qgw is the      The variability of the isotopic Si ratio of the lake water is
groundwater inflow; P is precipitation; and E is evaporation.    likely to be biologically driven and, therefore, was described
Monthly summer precipitation of 48 mm (ANS, 2020) has            using a Si isotopic fractionation model. We hypothesize that
been considered to be included in the stream inflow term.        the lake has sufficient inlet and groundwater supply to allow
Evaporation and precipitation have been shown to only have       for DSi concentrations to remain high and that DSi is un-
a small contribution to the lake water balance, and thus they    limited for diatom growth; thus, an open-system model was
are considered negligible here (Shemesh et al., 2001).           used. The open-system model (Varela et al., 2004) describes
                                                                 the expected diatom δ 30 SiBSi , as well as the post-uptake ratio
3.3    Silicon mass balance
                                                                 of the lake water δ 30 Sipostuptake .
The DSi flux into and from the lake is calculated as φ = Q ·
                                                                 δ 30 SiBSi = δ 30 Siinitial + ε · f,                                 (7)
c, where Q is discharge [L s−1 ] and c is DSi concentration
                                                                  30                   30
[mg SiO2 L−1 ]. The DSi balance is then calculated as            δ Sipostuptake = δ Siinitial − ε · (1 − f),                          (8)

1DSi = φin + φgw − φout − φBSi ,                           (5)   where δ 30 Siinitial is the isotopic ratio of the initial DSi
                                                                 source, ε is the fractionation factor of freshwater diatoms
where 1DSi is the change of lake DSi [mg SiO2 yr−1 ], and        −1.1 ± 0.41 ‰ (De La Rocha et al., 1997), and f is the frac-
φin , φout , and φgw are the DSi fluxes of the inlet, outlet,    tion of remaining DSi calculated as f = ccinitial    out
                                                                                                                          , where cinitial
and groundwater discharge [mg SiO2 yr−1 ], respectively. Fi-     and cout are DSi concentrations before and after diatom pro-
nally, φBSi represents the flux of BSi into the sediment         duction uptake. Thus, (1 − f ) is the DSi utilization by di-
[mg SiO2 yr−1 ], and it was calculated as                        atom production. The initial DSi concentration is calculated
                                                                 through a mixing model with knowledge of the discharges
φBSi = (SAR · ρdry · BSi wt % · Ased ) · 1000,             (6)
                                                                 (Qin and Qgw ) and DSi concentrations (cin and cgw ) of the
where SAR is sediment accumulation rate [cm yr−1 ] calcu-        end-members.
lated from the age–depth model (see Methods Sect. 4.1.2),           The initial isotopic ratio of lake DSi before diatom uptake
ρdry is dry bulk sediment density [g cm−3 ], BSi wt % is the     is back-calculated from δ 30 Sipostuptake (Appendix A3). The
mean of BSi content in sediments, Ased is the area of sedi-      known variables are the (1 − f ) and the δ 30 Sipostuptake repre-
mentary basin of the lake in square centimeters, and 1000 is     sented either in the lake isotopic composition or in the lake
the unit conversion from grams to milligrams.                    outlet δ 30 Siout , if δ 30 Silake = δ 30 Siout . Further, the ground-
   Assuming that the lake is in steady state, which means        water isotopic composition can be calculated from the initial
that the sum of input DSi fluxes equals the sum of output        isotopic Si mixture before diatom uptake and fractionation
Si fluxes, thus 1DSi = 0, DSi concentration in groundwater       through an isotope mixing model (see Appendix A3).
was then calculated by dividing φgw from Eq. (5) by Qgw .           Similar to the Si mass balance, the isotope Si mass bal-
The groundwater DSi flux in the ice-free period is depen-        ance was examined through three scenarios that differ in BSi
dent on inlet (φin ), outlet DSi flux (φout ), and BSi flux to   flux to the sediment representing different lengths of diatom
sediment (φBSi ). However, during the ice-covered period, the    production (Appendix B). As differences in BSi fluxes al-
φgw is dependent only on φBSi , if there is some (scenario 1,    ter groundwater DSi concentrations, the isotopic composi-
Appendix B) and on differences of lake volume and DSi con-       tion also changes. However, the scenario describing the re-
centration. Thus, in order to solve Eq. (5), φBSi and lake DSi   cent lake functioning is used for the model presented here.
concentration changes in the ice-covered period are required.    Results of this model were compared with measured data of
The φgw during the ice-covered period is calculated by a mix-    δ 30 SiBSi and δ 30 Sipostuptake (which equals δ 30 Silake ). For vali-
ing model (see Appendix A2).                                     dation, the groundwater δ 30 Sigw for monthly steady state was
   To constrain DSi concentrations in groundwater, we have       calculated and compared with data in the literature.
examined three different scenarios considering different BSi
fluxes (φBSi ) to the sediment driven by the length of di-
atom production. Two scenarios with maximal and minimal
monthly BSi flux appear in the Appendix B aiming to de-
scribe maximal and minimal diatom production period and

Biogeosciences, 18, 2325–2345, 2021                                                     https://doi.org/10.5194/bg-18-2325-2021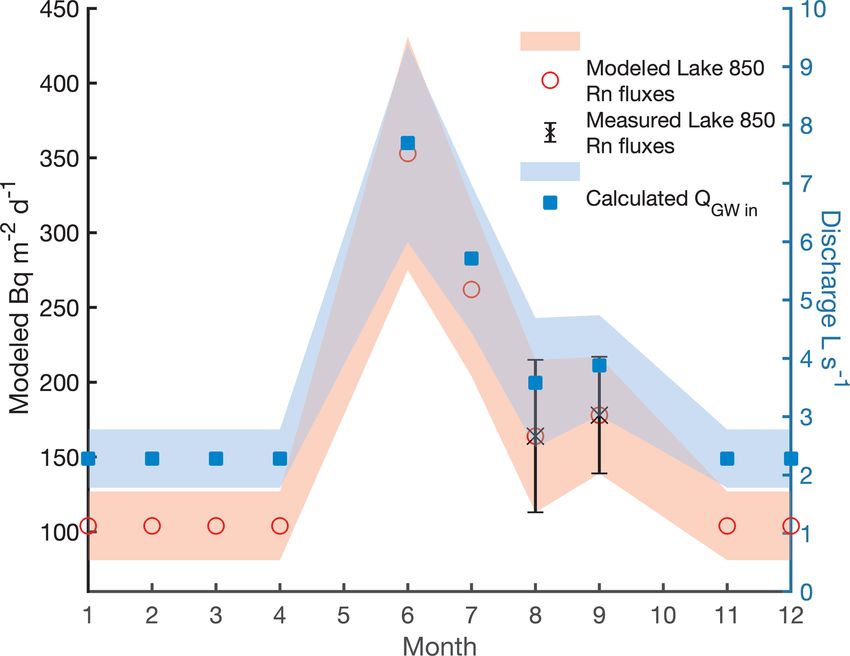
P. Zahajská et al.: Modern silicon dynamics of a small high-latitude subarctic lake                                        2329

4     Materials and methods                                      60 ◦ C before the TOC measurements (Brodie et al., 2011).
                                                                 The measurements were done on a COSTECH ECS4010 el-
4.1     Sample collection, chemical analyses, and                emental analyzer at the Department of Geology, Lund Uni-
        chronology                                               versity, with the mean analytical uncertainty for TOC of
                                                                 0.3 wt % based on duplicate analysis (n = 14). The carbon-
4.1.1    Water sampling                                          ate content calculated as a difference in TOC between de-
                                                                 calcified and bulk sample was below 0.5 wt % and thus con-
For DSi analyses, water samples from the ephemeral inlets        sidered negligible.
and outlet streams and lake waters were collected monthly           Biogenic SiO2 content in the sediment was analyzed by
from June to September 2019 (Fig. 1, Table S1). Addition-        sequential alkaline extraction (Conley and Schelske, 2001).
ally, samples of two profiles of lake water from the deepest     Freeze-dried and homogenized samples were digested in
part and a shallower part of the lake were collected in Au-      0.1 M Na2 CO3 (sample reagent ratio 0.03/40 [g mL−1 ]) in
gust and September 2019. All water samples were filtered         a shaking bath at 85 ◦ C for 5 h. Subsamples of 100 µL were
directly in the field through a 0.45 µm cellulose Sterivex™-     taken at 3, 4, and 5 h and neutralized in 9.9 mL of HCl to
HV Durapore filter and acidified with HCl to pH 2 in the lab-    examine for the dissolution of minerals. The extracted DSi
oratory. DSi concentrations were analyzed by the automated       was measured using the automated molybdate-blue method
molybdate-blue method (Strickland and Parsons, 1972) with        (Strickland and Parsons, 1972) with a Smartchem 200, AMS
a Smartchem 200, AMS™ discrete analyzer at Lund Univer-          System™ discrete analyzer at Lund University with an in-
sity with an instrumental error of ±3.7 %. All values for DSi    strumental error of ± 3.7 %. As there were no changes in
concentrations are reported as milligrams of SiO2 .              the amount of total Si extracted during the time course of
   For Rn analyses, surface water samples (maximum of            dissolution (n = 3, slope ≈ 0), the mean BSi concentration
1.5 m depth from the surface or 0.5 m depth at the shallow       from all the values was used to estimate BSi concentration
depths) were collected from five different stations (Fig. 1,     with no correction applied for Si-containing minerals (Con-
Table S1). A deeper water sample (4 m depth) was collected       ley, 1998). All values for BSi concentrations are reported as
from the deeper central point of the lake to evaluate the po-    wt % of SiO2 .
tential stratification of Rn concentrations. Samples of water       All sediment samples were analyzed for radionuclide
from the main inlet and the outlet stream were also collected.   concentrations (210 Pb, 226 Ra, and 137 Cs) at Lund Univer-
Water samples were collected in 1.5 L polyethylene tereph-       sity. 210 Pb, 226 Ra, and 137 Cs were determined by direct γ -
thalate (PET) bottles with no headspace using a peristaltic      counting using a high-purity germanium detector ORTEC
pump. Water was pumped directly into the bottle and left         (model GEM FX8530P4-RB). Freeze-dried and ground sam-
overflowing to replenish the volume at least three times to      ples were sealed for at least 3 weeks before counting to en-
ensure minimal contact with air. Shortly after collection, Rn    sure secular equilibrium of 226 Ra daughters. 210 Pb was deter-
concentrations were determined using a Rn-in-air alpha spec-     mined through the 46 keV γ -emission and 226 Ra through the
trometer RAD7 (Durridge Inc.) coupled to the Big Bottle          351 and 609 keV γ -emission of its daughter nuclides 214 Pb
RAD H2 O accessory (Durridge Inc.). All Rn concentrations        and 214 Bi, respectively. 137 Cs was measured by its emission
were decay-corrected for the time of collection.                 at 662 keV. Self-absorption was measured directly, and the
   Discharges from the inlet and outlet streams were de-         detector efficiency was determined by counting a National
termined by measuring the water velocity at 60 % of the          Institute of Standards and Technology sediment standard.
sampling point depth using the six-tenths-depth method              Sediment core chronologies were obtained by applying the
(Turnipseed and Sauer, 2010) and creating a cross section        Bayesian statistics approach with the software package Plum
through the tributary.                                           (Aquino-López et al., 2018). The Plum package was applied
                                                                 using the default settings for the thickness of Bacon sections
4.1.2    Sediment sampling                                       (1 cm). Plum used the individual 226 Ra measurements as an
                                                                 estimate of the supported 210 Pb concentration. The unsup-
Two short (∼ 15 cm) sediment gravity cores were sampled          ported 210 Pb was found in the uppermost 7 cm, and the soft-
with a HTH gravity corer in March and August 2019 (Ta-           ware package Plum (Aquino-López et al., 2018) extrapolated
ble S1). Both cores showed an undisturbed water–sediment         the ages for the remaining 7 cm based on measured data.
interface. One of the cores was sliced directly in the field        To constrain the Rn mass balance, the second sediment
in 1 cm sections. Each section was weighed before and af-        gravity core was used for equilibration experiments in order
ter freeze drying to determine water content, porosity, and      to determine Rn diffusion from underlying sediments and the
wet and dry bulk densities. Total organic carbon (TOC) and       Rn concentration representative of the groundwater discharg-
total nitrogen (TN) analyses were carried out on all freeze-     ing into the lake. Briefly, diffusive flux experiments were car-
dried samples, after packing 5 to 10 mg of dry sediment into     ried out in the laboratory by incubating ∼ 200 g of dry sedi-
tin capsules. Five samples throughout the core were tested       ment placed into 500 mL PET bottles with Milli-Q® water, as
for carbonate content by acidifying with HCl and heating to      described in Chanyotha et al. (2014). Using the RAD7 cou-

https://doi.org/10.5194/bg-18-2325-2021                                                 Biogeosciences, 18, 2325–2345, 2021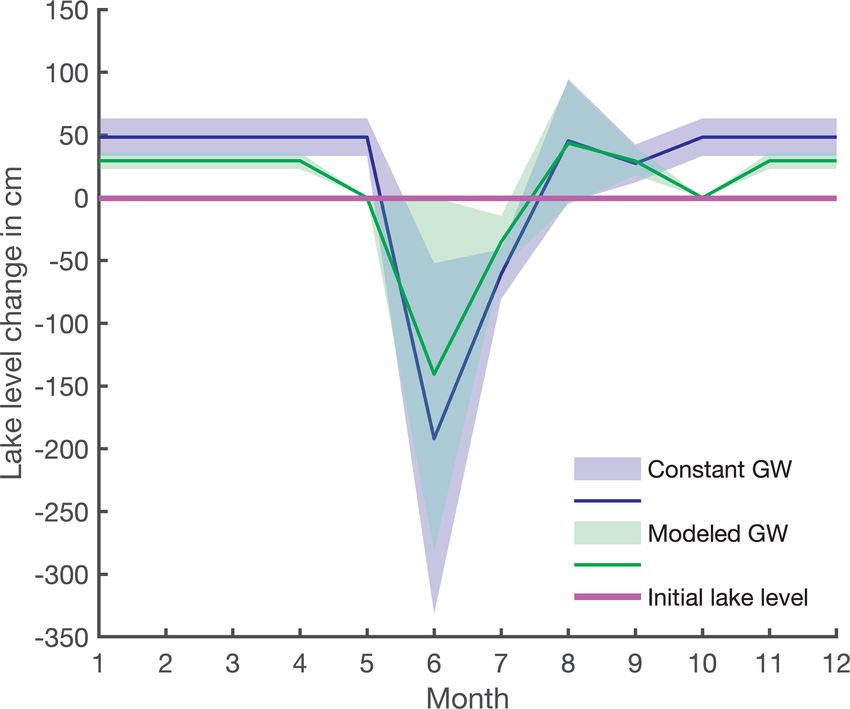
2330 P. Zahajská et al.: Modern silicon dynamics of a small high-latitude subarctic lake
pled to the Big Bottle RAD H2 O accessory (Durridge Inc.), reference solution in ‰, denoted δ 30 Si and δ 29 Si as follows:
Rn concentrations were monitored for 14 h. The rate of Rn 30
Si
diffusion from the sediment (Fdiff ) was derived from the ex- 28 Si sample
ponential ingrowth of Rn concentrations with time. The bot- δ 30 Si = 30 − 1 · 1000. (9)
Si
tles containing grab sediments were then stored for more than 28 Si NBS28
a month and periodically shaken. After this time, the Rn con-
centration in water was measured using the RAD7 and con- Each sample was measured three times, bracketed by
verted into groundwater end-member activities using poros- NBS-28 in between, and full chemical replicates for di-
ity and bulk density as described in Chanyotha et al. (2014). atom (n = 3) and water samples (n = 23) were measured
for 65 % of all samples (total measurements n = 137).
Secondary reference materials Diatomite, Big-Batch, and
4.2 Stable Si isotope analyses IRMM-018 were measured throughout all measuring ses-
sions in a period of 3 years, with means of δ 30 Si =
1.26 ± 0.19 ‰ (2SDrepeated , n = 219) for Diatomite, δ 30 Si =
Stable Si isotope analyses were performed on diatoms re- −10.64 ± 0.18 ‰ (2SDrepeated , n = 77) for Big-Batch, and
covered from sediment, lake, and stream water samples. δ 30 Si = −1.77 ± 0.18 ‰ (2SDrepeated , n = 100) for IRMM-
Cleaned diatom material (n = 3) from a published core taken 018 for quality control purposes. All secondary reference
in 1999 (Shemesh et al., 2001) was used to determine the material values were in good agreement with values from a
stable silicon isotope ratio in sedimentary diatoms and then previous interlaboratory comparison (Reynolds et al., 2007).
used in mass balance models. Briefly, pure diatom samples The reproducibility of all samples was < 0.2 %. At the Veg-
(∼ 0.8 mg) were digested with 0.5 to 1 mL of 0.4 M NaOH acenter, the long-term precision for δ 30 Si is 0.15 ‰ (2 SD).
(analytical purity) at 50 ◦ C for at least 48 h. When all diatoms
were dissolved, samples were diluted with Milli-Q® water
5 Results
to prevent precipitation and fractionation of amorphous sil-
ica and then neutralized by 0.5 to 1 mL of 0.4 M Suprapur® 5.1 Lake water chemical and isotopic properties
HCl. The solutions were measured for their DSi concentra-
tion to obtain the Si recovery, which was between 90 % and Lake 850 is a subarctic lake in a region with strong season-
100 %. Sample solutions were purified for Si isotope analysis ality. The discharge from inlets and the outlet streams show
by cation-chromatographic separation using 1.5 mL cation- a decreasing trend throughout the ice-free period from June
exchange Dowex® 50W-X8 (200–400 mesh) resin follow- through September (Table 1). The highest water flow rates
ing the method of Georg et al. (2006). Silicon from filtered are observed during the snowmelt period (June and July). In-
water samples was purified using the same cation-exchange flow from the stream inlets to the lake in August is low, and
method (Georg et al., 2006). The international Si standard both inlets are dry in September.
NIST reference material RM-8546 (former NBS-28) and lab- During the ice-free period direct surface precipitation is
oratory standard Diatomite were prepared by alkaline NaOH 0.65 L s−1 , which represents only 1.4 % of the lake volume,
fusion and purified following protocol by Georg et al. (2006). and similar or higher discharges are observed in the stream
The reference material RM-8546 (former NBS-28) and inlets from July to August. Therefore, the influence of pre-
laboratory standards IRMM-018, Big-Batch, and Diatomite cipitation on the water mass balance is limited. The calcu-
used in the Vegacenter, Swedish Museum of Natural His- lated lake water residence time during the high-flow regime
tory, Stockholm, were prepared by another type of fusion in June, defined as lake volume (1.2×10⁵ m3 ) divided by the
with LiBO2 (Sun et al., 2010). Thus, our alkaline NaOH- lake outlet discharge (Table 1), is 65 d. During the rest of the
fused NBS-28 and Diatomite standards (Georg et al., 2006), year, the lake water residence time is between 5 months and
purified identically to the samples, were matrix-matched to 2.4 years.
contain 3 mg L−1 Li IPC-MS standard. Similarly, all purified Lake DSi concentration varies seasonally (Table 1), with
samples were diluted to a concentration of 3 mg L−1 of Si in the highest values during the ice-covered period in March,
0.12 M SeaStar™ HCl matrix and doped with Li to contain reaching 2.51 ± 0.35 mg SiO2 L−1 . With snowmelt, the lake
3 mg L−1 Li to match the standard matrix. DSi decreases to 1.24 ± 0.02 mg SiO2 L−1 in June and to
The stable isotope measurements were carried out on its minimum value of 0.96 ± 0.06 mg SiO2 L−1 in August.
a NuPlasma (II) HR multi-collector inductively coupled With the first snow in September, lake DSi concentration
plasma mass spectrometer (MC-ICP-MS, Nu Instruments™) rebounds, having values of 1.37 ± 0.04 mg SiO2 L−1 . Data
with an Apex HF desolvation nebulizer at the Vegacenter. of DSi for the inlets and the outlet streams show two dif-
The 28 Si signal intensity of full procedural blanks was deter- ferent patterns during the year (Table 1). A lower inlet DSi
mined to be less than 0.35 % of the total signal intensity; thus concentration of 2.34±0.05 mg SiO2 L−1 is observed during
no sample contamination was observed. Silicon isotope data snowmelt in June compared to July and August, when the in-
30 29
are reported as deviations of 28 Si Si
and 28 Si
Si
from the NBS-28 let DSi concentrations increase to 4.79 ± 0.05 mg SiO2 L−1
Biogeosciences, 18, 2325–2345, 2021 https://doi.org/10.5194/bg-18-2325-2021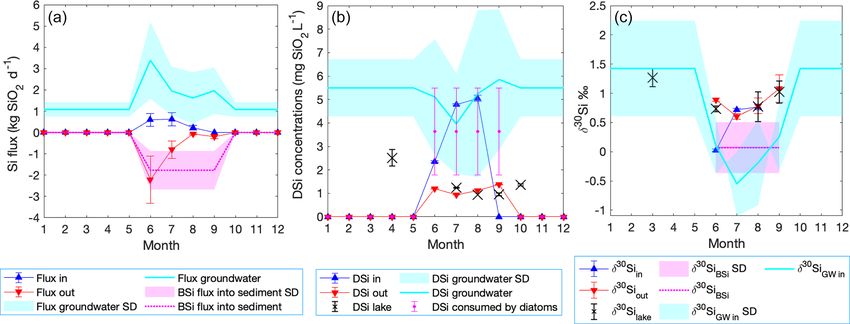
P. Zahajská et al.: Modern silicon dynamics of a small high-latitude subarctic lake                                                            2331

Table 1. Summary of discharge from the inlets (Qin ), the outlet (Qout ) stream, and groundwater discharge (Qgw ); dissolved Si concentration
as mg SiO2 L−1 in the inlets (cin ), the outlet (cout ), and the lake water (clake ); and stable Si isotopic signal of the inlet (δ 30 Siin ), outlet
(δ 30 Siout ), and lake (δ 30 Silake ).

                                                  March            June             July             August          September
                   Qin           L s−1                             2.9              1.5              0.5             Dry
                   Qout          L s−1                             21.5             9.9              4.5             1.6
                   Qgw           L s−1            Not sampled      Not sampled      Not sampled      3.58 ± 1.11     3.88 ± 0.86
                   cin           mg SiO2 L−1                       2.34 ± 0.05      4.79 ± 0.05      5.05 ± 0.12     Dry
                   cout          mg SiO2 L−1                       1.19 ± 0.02      0.94 ± 0.01      1.12 ± 0.03     1.37 ± 0.01
                   clake         mg SiO2 L−1      2.51 ± 0.35      1.24 ± 0.02      Not sampled      0.96 ± 0.06     1.37 ± 0.04
                   δ 30 Siin     ‰                                 0.02 ± 0.10      0.72 ± 0.10      0.78 ± 0.15     Dry
                   δ 30 Siout    ‰                                 0.89 ± 0.10      0.61 ± 0.10      0.79 ± 0.12     1.09 ± 0.20
                   δ 30 Silake   ‰                1.27 ± 0.15      0.73 ± 0.10      Not sampled      0.77 ± 0.32     1.02 ± 0.24

and 5.05 ± 0.12 mg SiO2 L−1 , respectively. The lake outlet                  cluded in the estimation of the associated uncertainty (ISO
DSi concentration shows little variability, with the lowest                  NORM, 1995; Taylor and Kuyatt, 1994).
concentration of 0.94 ± 0.01 mg SiO2 L−1 in July and only                       Using the mean wind speed for the 48 h period prior
a small increase up to 1.12 ± 0.03 mg SiO2 L−1 towards the                   to sampling (3.1 ± 1.2 and 5.0 ± 1.8 m s−1 in August and
end of the summer season in August. In September, when the                   September, respectively) resulted in kRn estimates of 1.1 ±
inlet streams are snow-covered, the DSi concentration in the                 0.2 and 1.2 ± 0.4 m s−1 . Uncertainties include the variation
outlet stream is the same as the lake water concentration at                 in wind speed and uncertainties associated with the empir-
1.37 ± 0.01 mg SiO2 L−1 .                                                    ical equation to estimate kRn . Using the Rn concentration
   The stable Si isotope ratios of the lake, inlet, and out-                 in lake waters, total losses of Rn to the atmosphere are
let streams vary during the year. The heaviest lake δ 30 Silake              123 ± 32 and 138 ± 32 Bq m−2 d−1 in August and Septem-
ratio, 1.27 ± 0.15 ‰, is observed during the ice-cover pe-                   ber, respectively. Radon losses due to decay were 125 ± 22
riod, and the lightest ratio, 0.73 ± 0.10 ‰, occurs during                   and 123 ± 15 Bq m−2 d−1 , respectively, where uncertainties
the snowmelt in June (Table 1). In June, the inlet has a                     are obtained from the analytical uncertainties for Rn concen-
lighter δ 30 Siin of 0.02 ± 0.10 ‰, whereas in August the in-                trations in lake waters. Losses of Rn through the outlet stream
let isotopic ratio 0.78 ± 0.15 ‰ has similar values as the                   were 7±4 and 9±4 Bq m−2 d−1 . Among all Rn losses, atmo-
lake. The δ 30 Siout of the outlet in June is slightly heavier               spheric evasion (50 %) and decay (47 %) were the terms that
(0.89 ± 0.10 ‰) compared to the lake δ 30 Silake . In July the               have the largest contribution to the Rn mass balance. Radon
outlet δ 30 Siout is lighter than the inlet one (Table 1). During            losses through the outlet stream are almost negligible (3 %).
the remainder of the year, the outlet δ 30 Siout is closely similar          Additionally, using the average kRn and Qout (Eq. 3), the av-
to the lake and inlet δ 30 Silake .                                          erage 222 Rn residence time in Lake 850 is ∼ 2 d.
                                                                                Diffusive Rn flux from underlying sediments (Fdiff )
                                                                             obtained from diffusion experiments in the lab is 89 ±
5.2   Groundwater discharge                                                  17 Bq m−2 d−1 , and it is one of the main sources of Rn into
                                                                             the system. Fluxes of Rn from the sediment compensate for
                                                                             up to 57 % of total Rn losses. Uncertainties associated with
Surface lake Rn concentrations range between 94 and
                                                                             this flux are from analytical uncertainties in the slope for
136 Bq m−3 in August and from 96–126 Bq m−3 in Septem-
                                                                             the regression analyses of the increase in Rn concentration
ber. Dissolved Ra in lake waters is assumed to be similar
                                                                             through time in the sediment diffusion experiment. Due to
to dissolved Ra found in other lakes in the region (1.4 ±
                                                                             the low concentrations of Ra in lakes from the same area
0.6 Bq m−3 ). However, the measured Rn inputs (the stream
                                                                             (1.4 ± 0.6 Bq m−3 , C. Olid, unpublished data), Rn inputs due
inlets) due to Ra decay were below 0.5 %, compared to the
                                                                             to Ra decay were considered negligible in the Rn mass bal-
net excess of Rn delivered by groundwater discharge. Thus,
                                                                             ance.
the inlet Rn flux was neglected in the total Rn balance.
                                                                                Rn inputs from groundwater are required to balance the
   There was no significant vertical stratification of Rn con-
                                                                             Rn losses from the lake. The Rn flux into the lake through
centration with Rn concentrations in deep waters (105 ± 26
                                                                             groundwater discharge is calculated to be 164±51 and 178±
and 79 ± 24 Bq m−3 ) in August and September, respectively.
                                                                             39 Bq m−2 d−1 in August and September, respectively. Con-
Equation (1) was solved analytically to obtain the amount of
                                                                             sidering the lake area of 20 000 m2 and the Rn concentra-
groundwater discharging into the lake (Qgw ) in August and
                                                                             tion in groundwater obtained from incubation experiments
September 2019. Uncertainties of individual terms were in-

https://doi.org/10.5194/bg-18-2325-2021                                                                Biogeosciences, 18, 2325–2345, 2021
2332 P. Zahajská et al.: Modern silicon dynamics of a small high-latitude subarctic lake
the core processing and also was described in the sediment
lithology by Shemesh et al. (2001). Changes in the sediment
content of aquatic or terrestrial mosses were also supported
by the C/N wt % ratio (Fig. 4), suggesting this is the cause of
changes in MAR.
Lake 850 sediment is composed of carbonate-free clay
gyttja with a mean TOC content of 11.4 wt %, mean TN of
1.1 wt %, and a resultant C/N wt % ratio of 10.2 (Fig. 4).
Sediment porosity as high as 89.5 % is found in the sur-
face sediment, where sediment dry bulk density mean is
0.19 ± 0.06 g cm−3 . The BSi concentration along the sedi-
ment varies from 13.2 ± 0.28 wt % to 22.8 ± 0.24 wt %, with
the highest BSi concentration in the surface of the core.
The BSi concentrations reported here are lower than previ-
ous measurements. For example, BSi concentration in the
surface sediment of Lake 850 was previously reported to
Figure 2. The modeled groundwater radon flux of Lake 850 (red be 40.3 wt % (Rosén et al., 2010), which is twice the value
circles) based on Rn fluxes in Lake Almberga in Abisko (Olid et al., found here, demonstrating a high variability of BSi in the
unpublished data), the measured Rn fluxes in August and September sediments.
(black cross), and the calculated groundwater discharge in L s−1 From MAR and BSi wt % we estimated the BSi accumu-
throughout the year (blue squares). Uncertainties are shown as error lation rate (φBSi ). BSi accumulation rates show stable values
bars and with shading. around 1.8 mg SiO2 cm−2 yr−1 in the upper 7 cm of the core,
whereas an increase in BSi accumulation is observed towards
the bottom 7 cm of the core (Fig. 4) likely connected to the
(10 626 ± 1720 Bq m−3 ), groundwater fluxes are 3.58 ± 1.11 higher MAR. The mean BSi accumulation rate for the en-
and 3.88 ± 0.86 L s−1 for August and September, respec- tire gravity core of 2.9 ± 1.5 mg SiO2 cm−2 yr−1 was used as
tively. Note that this is a conservative estimate for ground- the BSi flux to sediment in the mass balance models. The
water fluxes, because we use the highest measured Rn con- mean diatom isotopic ratio (δ 30 SiBSi ), measured on cleaned
centration as the end-member. diatoms from the uppermost 8 cm of a sediment piston core
Due to the lack of Rn measurements for the entire year, from 1999 (Shemesh et al., 2001), is 0.07 ± 0.43 ‰ (n = 3).
we estimated groundwater inputs for the months where no
sampling was carried out using two scenarios: (i) constant
groundwater inflow of 3.73 ± 1.40 L s−1 , calculated as the 6 Mass balance models
mean of the August and September data, and (ii) mod-
eled groundwater inflow based on groundwater fluxes ob- 6.1 Water balance
tained from a lake survey in the Abisko region in 2018–
2019 (C. Olid, unpublished data), which ranged from 2.28 ± Two water balance scenarios were considered where changes
0.50 L s−1 to 7.69±1.70 L s−1 (Fig. 2). The annual Rn fluxes in the lake level were evaluated: (i) constant groundwater
follow a pattern of a distinct peak in discharge in June inflow over the annual cycle as an additional water source
and a gradual decrease towards July–October, reaching the and (ii) modeled groundwater discharges varying throughout
base-flow level in November (Fig. 2). The ratio between an annual cycle (Figs. 5 and A1). In both scenarios, lake-
the groundwater Rn flux in September in Lake 850 and level increases during the ice-covered period (Fig. 5, blue
the groundwater Rn fluxes from the lake survey was used and green lines) are a result of a potential groundwater in-
to model the missing groundwater Rn fluxes in Lake 850 flow. This accumulated water is released through the outlet
(Fig. 2, Appendix A1). when the lake ice starts to melt in May–June, and the outlet
discharge is thus high (Table 1). After this period, lake level
5.3 Age–depth model, lithology, and mass is stabilized, and groundwater replenishes the original lake
accumulation rates volume during short periods over the summer.
When groundwater discharge is assumed to be constant
The age–depth model for the sediment core is shown in Fig. 3 (scenario i, 3.73 ± 1.4 L s−1 ) based on our data from August
(or Fig. S2). The mean sediment accumulation rate (SAR) and September, the lake shows annual lake-level changes up
was estimated to be 0.083 ± 0.041 cm yr−1 , which equals a to 1.9 m (Figs. 5 and A1, blue line). From July to December,
sediment accumulation rate of 12 ± 6 yr cm−1 and a mass the lake volume is restored by the groundwater inflow, and,
accumulation rate (MAR) of 16.0 ± 9.3 mg cm−2 yr−1 . The on the annual timescale, the lake level would increase around
presence of mosses in the sediment was observed during 2 m every year (Fig. 5, blue line).
Biogeosciences, 18, 2325–2345, 2021 https://doi.org/10.5194/bg-18-2325-2021P. Zahajská et al.: Modern silicon dynamics of a small high-latitude subarctic lake 2333
Figure 3. Age–depth model of the gravity core. Red line is the median probability age from all age–depth iterations. Grey shading represents
age model probability and contains 95 % confidence interval (dashed lines). The blue rectangles are the unsupported 210 Pb concentration in
Bq kg−1 .
Using the modeled annual groundwater inflow (scenario ii, Groundwater discharges from scenario ii (Fig. 2) were
Fig. 2), limited lake-level changes were observed. The max- used to build a Si mass balance and a Si isotope mass bal-
imum lake-level decrease is 1.4 m during summer (Figs. 5 ance. Here, we assume that the recent BSi flux into the sed-
and A1, green line), but groundwater discharge restores lake iment occurs only during the diatom growing season (from
level during upcoming months. Taking into account the un- June until September) (Fig. 6a; Shemesh et al., 2001). The
certainties, lake-level variation can be as great as 2.8 m or missing DSi flux resulting from the mass balance was con-
none (Figs. 5 and A1, green shading). This scenario with the sidered to originate from the groundwater flux, and thus we
smallest lake-level changes is in agreement with previous re- use this flux to calculate back the groundwater DSi concen-
sults of oxygen isotope mass balance (Shemesh et al., 2001). tration and isotopic ratio.
Therefore, we used this water balance model further for the During the diatom growing season, the modeled BSi flux
Si balances. into the sediment increases up to 1.76 ± 0.87 kg SiO2 d−1
(magenta line, Fig. 6a), which produces DSi deficiency in
the lake. To balance this deficiency, groundwater discharge
6.2 Silicon and silicon isotope mass balance
must supply between 1.62±1.21 and 3.39±1.81 kg SiO2 d−1
during the diatom growing season (cyan line, Fig. 6a). Con-
Based on the steady-state assumption, BSi accumulation oc- sidering the modeled groundwater discharges derived from
curs in conditions when the total DSi influx is higher than Rn mass balance, the DSi concentration in the groundwa-
the stream DSi outflux. Therefore, we construct a Si mass ter is estimated to range from 3.96 ± 2.14 mg SiO2 L−1 to
balance based on stream inlets and the outlet. The DSi influx 5.85 ± 2.99 mg SiO2 L−1 during diatom growth (cyan line,
through the inlet stream is not sufficient to maintain lake DSi Fig. 6b). During the ice-covered period the BSi flux into
concentration at steady state in June (red and blue triangles, the sediment is considered to be negligible, while ground-
Fig. 6a). In contrast, in July and August sufficient DSi en- water is still flowing into the lake. The winter groundwater
ters the lake to supply the outlet DSi flux. The monthly inlet concentration is calculated from the difference in the lake
DSi flux is between 0.22±0.11 and 0.62±0.31 kg SiO2 d−1 , concentration from September (1.02 ± 0.91 mg SiO2 L−1 ) to
while the outlet DSi flux ranges from 0.19 ± 0.10 to 2.21 ± March (2.51±0.35 mg SiO2 L−1 ) (Appendix A2). Therefore,
1.11 kg SiO2 d−1 . However, diatom production is an addi- the groundwater discharging into the lake from late October
tional sink of Si by creating a BSi flux into the sediment. The until mid-June is the only water inflow with a DSi concentra-
DSi influx is, thus, not sufficient to account for both the DSi tion of 5.50 ± 1.22 mg SiO2 L−1 .
outflux and the BSi flux into the sediment (Fig. 6a). There- The Si isotope mass balance using the open fractiona-
fore, an external source (i.e., groundwater discharge) must tion model (Varela et al., 2004) shows that the higher de-
supply additional DSi to compensate for the mean BSi flux mand of DSi in the productive months (Fig. 6a, b) needs to
(2.9 mg SiO2 cm−2 yr−1 ) into the sediment.
https://doi.org/10.5194/bg-18-2325-2021 Biogeosciences, 18, 2325–2345, 20212334 P. Zahajská et al.: Modern silicon dynamics of a small high-latitude subarctic lake
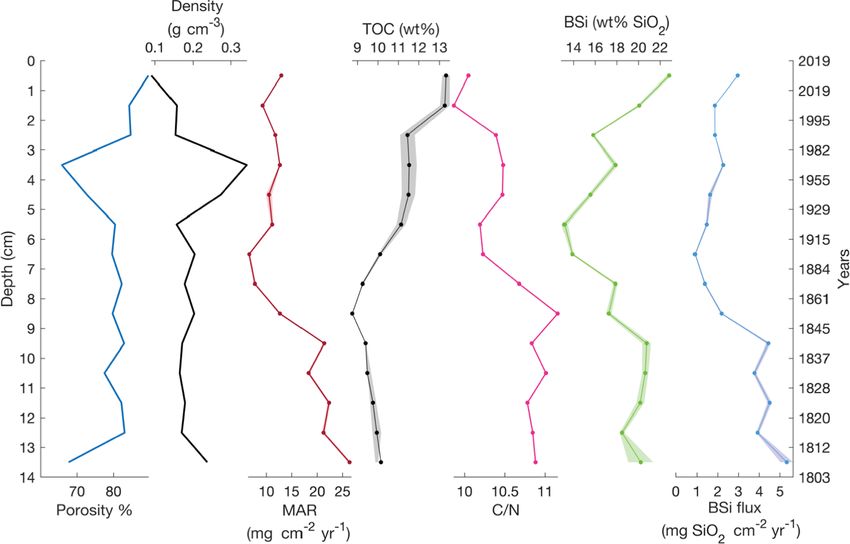
Figure 4. The gravity core sediment properties (porosity and dry bulk density), mass accumulation rate (MAR), and sediment density. Total
organic carbon (TOC) and C/N showing changes in lake carbon content and sources. Biogenic silica (BSi) and BSi flux calculated from
MAR and BSi concentrations. Shading shows 1 standard deviation.
have a lighter isotopic composition in order to produce the (Rosén et al., 2010) places Lake 850 in the upper 6 % of lake
δ 30 SiBSi of 0.07 ± 0.43 ‰ measured on diatoms preserved in sediments studied worldwide (Frings et al., 2014). Based on
the sediment. The isotopically lighter source is assumed to be the positive correlation between water residence time and the
groundwater discharge, with calculated ranges from −0.55± relative retention of DSi in lakes (Frings et al., 2014), Lake
0.55 ‰ in July to 0.25 ± 0.58 ‰ in September (Fig. 6c). Us- 850 with its DSi retention of 35 ± 17 % of the total DSi inlet
ing the modeled groundwater δ 30 Si, the expected δ 30 SiBSi input and a residence time ranging from 0.18 to 2.4 years ac-
in all productive months varies from −0.49 ± 0.49 ‰ to cumulates more DSi as BSi than expected. Although several
−0.01 ± 0.56 ‰ (not shown), values that are in agreement factors, including the morphology of the watershed (Jenny,
with the sediment BSi of δ 30 SiBSi = 0.07±0.43 ‰. The pro- 1941; Rubensdotter and Rosqvist, 2003), diatom production
duction consumes 73 % of the initial DSi in June, 77 % in and low detrital input (Conger, 1942), vegetation (Struyf
July and September, and 79 % in August. During the ice- et al., 2010), and preservation potential (Ryves et al., 2003),
covered period from late October until mid-June, the ground- are known to affect sedimentation regimes and BSi accumu-
water base flow is considered to be constant, calculated from lation resulting in a diatom-rich sediment, we show here that
the difference of the lake isotopic ratios from September until groundwater input is an important factor leading to the high
March (Appendix A3), and thus the δ 30 Sigw = 1.43±0.82 ‰ BSi accumulation in Lake 850.
(Fig. 6c). The combined results from the water, Rn, and Si mass bal-
ances indicated the importance of an external source of DSi
through groundwater discharge. Groundwater inflow was the
7 Discussion primary water and DSi supply to the lake, with a contribution
about 3 times higher than the stream inlets (Fig. 6a). The Si
Lake 850 is unusual in terms of both the DSi and BSi concen- and Si isotope mass balance models showed that groundwa-
tration in water and sediment, respectively. The maximum ter DSi concentration and isotopic composition varied during
DSi concentration of 2.51 mg SiO2 L−1 in March is among the ice-free period, compared to the ice-covered period, when
the top 10 % of lakes in northern Sweden (Bigler and Hall, they were stable (Fig. 6b, c).
2002). The mean BSi content in the lake sediment of 40 wt %
Biogeosciences, 18, 2325–2345, 2021 https://doi.org/10.5194/bg-18-2325-2021P. Zahajská et al.: Modern silicon dynamics of a small high-latitude subarctic lake 2335
Figure 5. Long-term lake-level change calculated based on lake volume changes and water balance. The purple line indicates the lake-level
starting point. The blue line with shading is the lake-level change with constant groundwater flow (scenario i), and the green line with shading
is the lake-level change based on water balance with modeled groundwater discharges (scenario ii).
The significance of groundwater-sourced DSi to the lake’s 7.2 The role of groundwater in the water balance
Si cycle is also evidenced by the relatively lighter stable Si
isotope ratio of diatoms from sediment, which suggests that The water balance coupled with the Rn mass balance indi-
groundwater is the primary DSi source for diatoms. Stream cated that groundwater discharge is an essential water source
inputs could also be a source of DSi for diatoms, especially in for the lake. Both models of groundwater inflow (constant
early spring, when snowmelt can deliver isotopically lighter and varying groundwater inputs) demonstrated changes in
DSi by displacement of shallow groundwater into the stream lake volume as a result of high water discharge at the out-
inlet (Campbell et al., 1995). However, spring snowmelt wa- let of the lake during spring snowmelt. More pronounced
ter and groundwater in June are likely to have the same iso- changes in lake volume were observed in scenario i, where
topic composition (Fig. 6c) because the same factors, e.g., constant groundwater inflow was assumed (Fig. 5, blue line).
short residence time in the watershed, are present in both However, because the oxygen isotope data showed negligible
types of water. Thus, only by using mass balance is the quan- evaporation and precipitation effect on lake volume change
tification of each DSi source apparent, providing evidence (Shemesh et al., 2001), this model is not considered to be
that groundwater supplies almost 4 times more DSi com- the most realistic. Scenario ii, which considered a variable
pared to streamflow in June. Our results suggest that the groundwater flow (Fig. 5, green line) seems to be more real-
groundwater supply plays a crucial role in providing DSi for istic. The modeled groundwater hydrograph (Fig. 2) is com-
the production of diatoms and accumulation of BSi in Lake parable with the hydrograph of the neighboring river Mielle-
850. johka (Fig. S1) and resembles the hydrographs of ground-
water discharge in studies of high-altitude lakes from other
7.1 Environmental controls on BSi accumulation regions (Clow et al., 2003; Hood et al., 2006; Huth et al.,
2004; Liu et al., 2004). The results from this model show
The results from our study can be applied more broadly to that groundwater discharge is up to 5 times higher than the
other lakes to evaluate factors governing the accumulation lake water outflow through the outlet. Similarly, groundwa-
of diatom-rich sediment. BSi-rich sediments are likely to be ter discharge corresponds to 3 % to 17 % of the lake volume
found in lakes situated on silica-rich bedrock, such as in Lake depending on the month.
Challa, Tanzania–Kenya (Barker et al., 2013), or, as shown
here, in lakes with sufficient DSi inputs from groundwater 7.3 The role of groundwater in Si concentration mass
that supply sufficient DSi during the diatom growing sea- balance and Si isotope mass balance
son to alleviate potential DSi limitation of diatom growth. In
addition, lakes with high autochthonous carbon production The lake Si mass balance (Fig. 6a) shows that modeled
and deposition combined with very low mean sedimentation groundwater concentration and flux of BSi vary through the
rates, which commonly characterize Arctic lake sediments year, which is similar to observations from Crystal Lake
(Wolfe et al., 2004), as well as lakes with low-relief water- in Wisconsin (Hurley et al., 1985). Seasonal variations in
shed morphology and with low stream input, which com- groundwater DSi concentration related to discharges were
bined yield low quantities of fine-grained clastic input, are also observed in Canadian rivers with groundwater inputs
potential systems for high BSi accumulation (Conger, 1942). (Maavara et al., 2018). Moreover, the calculated BSi flux into
the sediment is comparable (or higher) with BSi fluxes ob-
https://doi.org/10.5194/bg-18-2325-2021 Biogeosciences, 18, 2325–2345, 20212336 P. Zahajská et al.: Modern silicon dynamics of a small high-latitude subarctic lake
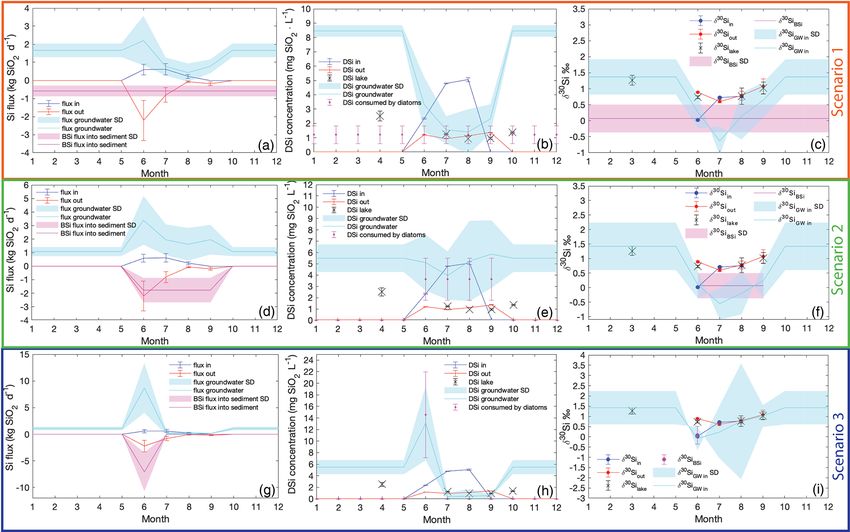
Figure 6. Si and Si isotope mass balance model of Lake 850 throughout the year. (a) Mass balance showing the stream DSi influx (blue
triangles), the lake outlet DSi outflux as negative flux (red triangles), and the diatom BSi flux based on a diatom bloom season lasting 4
months (magenta dotted line), also as a negative flux. The calculated groundwater DSi flux is shown as a positive flux (cyan line). (b) The
monthly changes in the DSi concentration of the inlet (blue triangles), outlet (red triangles), lake (black crosses), diatom DSi uptake (magenta
circles), and groundwater (cyan line). (c) The stable Si mass balance showing monthly variation in the isotopic composition of all DSi sources
and sinks. Shading and error bars represent uncertainties.
served in some of the North American Great Lakes (Con- residence time due to higher discharges, as also observed in
ley, 1988; Newberry and Schelske, 1986; Schelske, 1985) Arctic rivers (Pokrovsky et al., 2013).
and lakes with diatomaceous sediment in the Arctic (McKay The greatest variation in the isotopic ratio of groundwater
et al., 2008; Kaplan et al., 2002; Tallberg et al., 2015). occurs in August, when the modeled groundwater isotopic
The model of stable Si isotopes shows little variation composition is fully dependent on the changes in BSi flux
during the ice-covered period, as no diatom production is into the sediment. As the yearly BSi accumulation occurs
expected. The modeled δ 30 Si of groundwater for the ice- during the diatom growing season which is only 4 months,
covered period (Fig. 6c) falls into the range of measured the modeled groundwater must bring additional DSi to sup-
groundwater isotopic composition worldwide, which ranges ply diatom production. Hence, the isotopic model calculating
from −1.5 ‰ to 2 ‰ (Frings et al., 2016). However, the the groundwater isotopic composition shows δ 30 Sigw compa-
modeled groundwater ratio δ 30 Sigw is heavier than found rable with values for groundwater reported in a small number
in other groundwater studies (Georg et al., 2009; Opfergelt of other studies (Frings et al., 2016; Opfergelt et al., 2011).
et al., 2011; Ziegler et al., 2005), which may reflect lower Further, the calculated δ 30 SiBSi based on the initial mixture
dissolution of primary minerals, longer groundwater resi- of the modeled groundwater and stream inlet ratio gives re-
dence time, and possibly some clay mineral formation in sults within the range of the measured δ 30 SiBSi .
the groundwater pathway (Frings et al., 2016; Pokrovsky
et al., 2013) during the ice-covered period. Further, no di-
atom production, and thus no associated Si isotope fraction- 7.4 Model uncertainties
ation, is expected in winter. Therefore, the δ 30 Silake is influ-
enced by the input of δ 30 Sigw only and not by diatom pro- The largest sources of uncertainty in the water and silicon
duction. The δ 30 Silake measured in March is slightly lighter balance models (Figs. 5, 6, and A1) are the discharge uncer-
than all modeled δ 30 Sigw for the ice-covered period, which tainties of the inlet and outlet and the winter groundwater dis-
can be explained by diatom dissolution in the uppermost sed- charges. The spring snowmelt dynamically changes the inlet
iment layers. However, if the uncertainties of the modeled and outlet discharges, as has been observed on rivers in the
groundwater isotopic composition are taken into account, the area, such as Miellejohka (Fig. S1). With only a single sam-
lake ratio is within the same range as the groundwater ratio. ple every month, there is no information on variation in the
Therefore, no additional processes must be present during stream on a finer temporal scale. Thus, monthly stream flow
the ice-covered period, and the groundwater isotopic ratio is and the modeled groundwater discharges might be over- or
reflected in the lake isotopic signal. With snowmelt, the de- underestimated. Further, uncertainties in the isotopic model
crease in the modeled δ 30 Sigw reflects the increase in weath- and the isotopic composition of the groundwater were prop-
ering of primary minerals and decrease in the groundwater agated from the mass balance model and from the stable iso-
topic measurements, especially in the outlet water in August.
Biogeosciences, 18, 2325–2345, 2021 https://doi.org/10.5194/bg-18-2325-2021You can also read