Hydrological soil properties control tree regrowth after forest disturbance in the forest steppe of central Mongolia
←
→
Page content transcription
If your browser does not render page correctly, please read the page content below
SOIL, 7, 563–584, 2021

                                                                                                           SOIL
https://doi.org/10.5194/soil-7-563-2021
© Author(s) 2021. This work is distributed under
the Creative Commons Attribution 4.0 License.

               Hydrological soil properties control tree regrowth
                 after forest disturbance in the forest steppe
                              of central Mongolia
              Florian Schneider1 , Michael Klinge1 , Jannik Brodthuhn1 , Tino Peplau2 , and Daniela Sauer1
                     1 Departmentof Physical Geography, University of Göttingen, 37077 Göttingen, Germany
       2 Intitute   of Climate-Smart Agriculture, Johann-Heinrich von Thünen Institute, 38116 Braunschweig, Germany
                           Correspondence: Florian Schneider (florian.schneider@uni-goettingen.de)

                                     Received: 24 August 2020 – Discussion started: 5 October 2020
                             Revised: 6 March 2021 – Accepted: 4 August 2021 – Published: 30 August 2021

      Abstract. The central Mongolian forest steppe forms a transition between different ecozones and is as such
      particularly sensitive to environmental changes. It is commonly affected by disturbances such as logging and
      forest fires. Intensified drought events aggravate stress on the trees that are anyway at their drier limit in the forest
      steppe. Climate change increases evapotranspiration and reduces the distribution of discontinuous permafrost,
      which leads to drier soil conditions. The motivation for this study came about through our previous observation
      that forest stands show great differences with respect to their recovery after disturbance by fire or logging.
      Sometimes, no regrowth of trees takes place at all. As water availability is the main limiting factor of forest
      growth in this region, we hypothesised that differences in soil hydrology control the forest recovery pattern.
         To test this hypothesis, we analysed soil properties under forests, predominantly consisting of Siberian larch
      (Larix sibirica Ledeb.), in the forest steppe of the northern Khangai Mountains, central Mongolia. We distin-
      guished the following four vegetation categories: (1) near-natural forest (FOR), (2) steppe close to the forest
      (STE), (3) disturbed forest with regrowth of trees (DWIR), and (4) disturbed forest showing no regrowth of trees
      (DNOR). A total of 54 soil profiles were described in the field and sampled for soil chemical, physical, and
      hydrological analysis. We found a significant difference in soil texture between soils under DWIR and DNOR.
      Sand generally dominated the soil texture, but soils under DWIR had more silt and clay compared to soils under
      DNOR. Soil pF curves showed that soils under DWIR had higher plant-available field capacity in their upper-
      most parts than soils under DNOR. In addition, hydraulic conductivity tended to be higher in the uppermost
      horizons of soils under DWIR compared to their counterparts under DNOR. Chemical properties of the soils
      under DWIR and DNOR showed no significant differences.
         We conclude that the differences in post-disturbance tree regrowth are mainly caused by different soil hydrol-
      ogy. High plant-available field capacity is the key factor for forest recovery under semi-arid conditions. High
      hydraulic conductivity in the uppermost soil horizons can further support tree regrowth because it reduces the
      evaporation loss and the competition of larch saplings with grasses and herbs for water. Another important factor
      is human impact, particularly grazing livestock on cleared forest sites, which often keeps seedlings from grow-
      ing and, thus, inhibits forest recovery. None of the disturbed sites (DWIR and DNOR) had permafrost. We, thus,
      conclude that permafrost is no major factor for the post-disturbance tree regrowth pattern, although it generally
      supports tree growth in the forest steppe by preventing meltwater from seasonal ice from seeping below the root
      zone, thus increasing the water supply in summer.

Published by Copernicus Publications on behalf of the European Geosciences Union.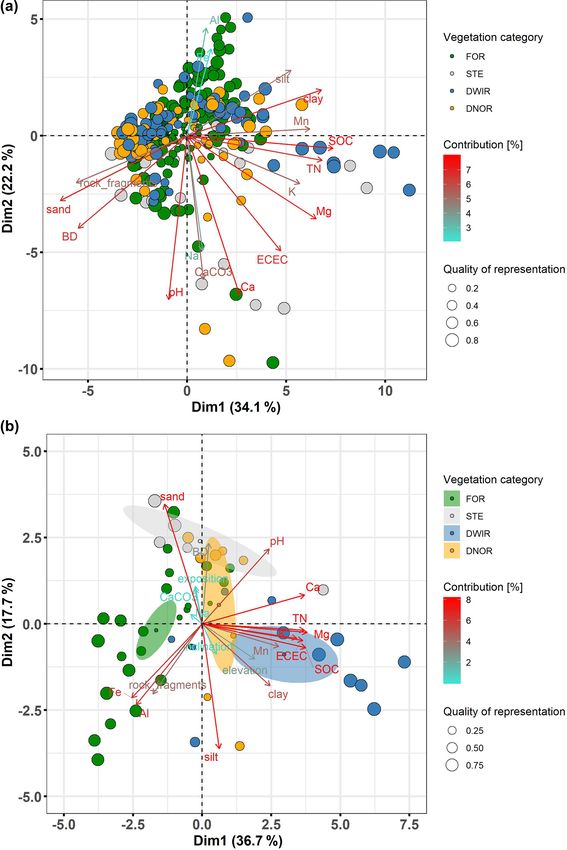
564                            F. Schneider et al.: Hydrological soil properties control tree regrowth after forest disturbance

1   Introduction                                                   distribution, chemical soil properties, and water content. He
                                                                   reported forest vegetation on soils with higher water content
The forest steppe in central Mongolia represents the tran-         and predominant steppe vegetation on soils with lower water
sition between the Siberian taiga in the north and the Gobi        content. However, he focused mainly on general soil descrip-
Desert in the south, responding sensitively to climatic, eco-      tion and did not report any further details on soil–vegetation
logical, and anthropogenic disturbances. Water availability        relationships. Krasnoshchekov (2008, 2010) described phys-
is the key factor that determines where forest patches can ex-     ical and chemical soil properties in the eastern Khubsugul
ist within this landscape. Climate change is a major threat        region and the Khangai Mountains. Sympilova and Gyni-
to the forest steppe due to aggravated drought stress (Allen       nova (2012) conducted similar research in the Selenga high-
et al., 2010). In Mongolia, intensified summer droughts be-        lands. However, in both studies, only the soils were charac-
came more frequent over the last century (Batima et al.,           terised, without linking them to the vegetation pattern. Som-
2005; Dashkhuu et al., 2015). Siberian larch (Larix sibirica       mer (2000) analysed soils of the forest steppe of the Turgen–
Ledeb.), which is the dominant tree species in the Mongo-          Charchiraa mountains in northwestern Mongolia. He focused
lian forest steppe, suffers due to these intensified droughts      on soil chemical aspects and did not find a clear relationship
(Dulamsuren et al., 2010; Chenlemuge et al., 2015). Further-       between forest distribution and soil properties. He concluded
more, summer droughts increase the risk of fires that disturb      that forest distribution was climate controlled and disturbed
the vegetation structure in forests and reduce the size of the     by pastoral pressure and logging. Yet, he did not analyse soil
forest patches (Kharuk et al., 2008). This causes a negative       hydrological properties.
effect on the forest microclimate, which in turn intensifies the      During previous fieldwork in the Khangai Mountains, in
sensitivity of the forest to drought stress (Khansaritoreh et      the central Mongolian forest steppe, we observed that for-
al., 2017a). In addition to fire, the human impact also affects    est regrowth after disturbance does not proceed equally. The
the structure of the forest stands. Logging and forest pas-        post-disturbance development of forest stands with appar-
ture reduce the forest size, open the forest stand, and hamper     ently the same site conditions ranges from spontaneous dense
post-disturbance forest regrowth (Khishigjargal et al., 2013;      regrowth to no regrowth at all. As the trees are at their drier
Tsogtbaatar, 2013; Dulamsuren et al., 2014).                       limit in this sensitive landscape, we assumed that water avail-
   Meltwater from the active layer above permafrost patches        ability is the main factor that controls forest regrowth after
increases the soil water availability and can, thus, support       disturbance, whereas nutrient availability plays a less impor-
the survival of trees during drought events in summer (Sug-        tant role. Since both factors are related to soil properties, we
imoto et al., 2002; Ishikawa et al., 2005; Churakova et al.,       established the following hypotheses:
2016). Permafrost in Mongolia is discontinuous and espe-
cially occurs under large forests. However, climate change          1. Silty soil texture leads to high plant-available field ca-
is currently reducing the area of permafrost in Mongolia               pacity and is, thus, favourable for post-disturbance tree
(Sharkhuu and Sharkhuu, 2012). After forest disturbance by             regrowth.
fire or logging, permafrost degrades and may only reconsti-
tute under certain conditions (Klinge et al., 2021). The loss       2. High hydraulic conductivity in the uppermost parts of
of this additional water source leads to the enhanced stress of        the soils supports post-disturbance forest regrowth, as
trees during droughts.                                                 rapid water infiltration to some depth reduces evapora-
   Decreased water supply and increased drought stress raise           tion and ground vegetation transpiration.
the importance of soil properties in the Mongolian forest
steppe even further. Soil water distribution in the landscape       3. High nutrient stocks, for example after fire events, may
after a rainfall event is generally controlled by bedrock, sed-        support post-disturbance forest regrowth, unless nutri-
iment cover, slope morphology, and vegetation. In addition,            ent stocks are well above the requirements of Siberian
plant-available field capacity and hydraulic conductivity of           larch anyway. In this case, no effect is to be expected.
the soils influence the amount of water available at a site.
Moreover, water repellency can reduce water infiltration, es-       4. Permafrost may increase water availability for trees
pecially after fire events (DeBano, 2000; Doerr et al., 2000).         through the continuous water release at the melting
Several studies have been conducted on soil distribution and           front above the permafrost table over the summer sea-
soil properties in the Mongolian forest steppe (Opp and                son. As water above the permafrost table cannot infil-
Hilbig, 2003; Maximovich, 2004; Lehmkuhl et al., 2011).                trate downwards, interflow may occur above the per-
Nandintsetseg and Shinoda (2011) modelled soil moisture                mafrost table. This process leads to increased water
conditions in Mongolia based on data from meteorological               availability, especially in concave slope positions where
stations from 1986 until 2005. They obtained a gradient of             interflow converges. Thus, permafrost may also support
increasing soil moisture from southwest to northeast during            post-disturbance forest regrowth at sites with otherwise
the summer. Haase (1963) studied soils in relation to altitudi-        unfavourable soil hydrological conditions for forest re-
nal zones in the Khangai Mountains, including particle size            growth.

SOIL, 7, 563–584, 2021                                                                 https://doi.org/10.5194/soil-7-563-2021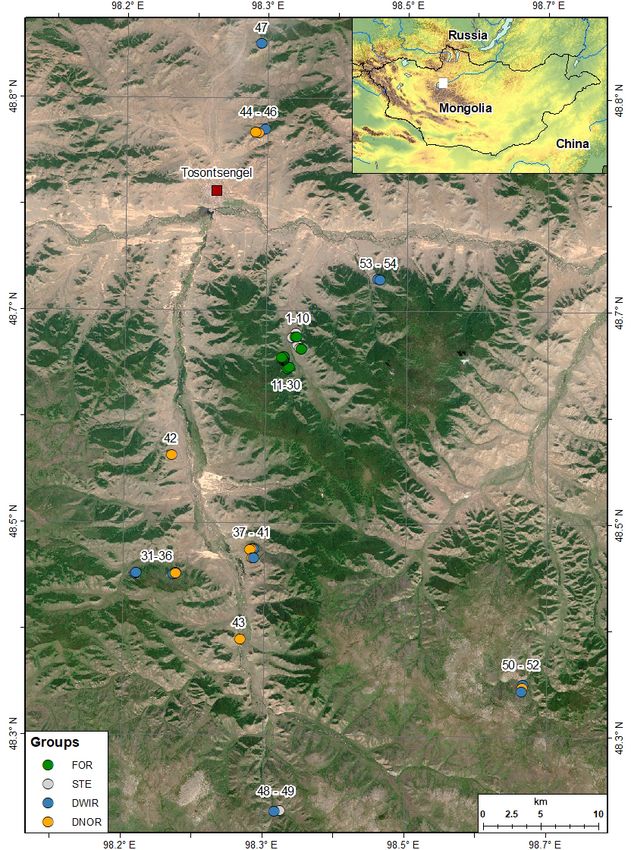
F. Schneider et al.: Hydrological soil properties control tree regrowth after forest disturbance                                565

2     Materials and methods                                         2.2   Fieldwork

2.1    Study area                                                   The site selection within the study area was based on four
                                                                    categories of vegetation: near-natural forest (FOR), steppe
The study area was located in the central Mongolian forest          close to forest (STE), disturbed forest with regrowth of trees
steppe, in the northern Khangai Mountains, near the town            (DWIR) and disturbed forest showing no regrowth of trees
Tosontsengel (Fig. 1). The geological basement predomi-             (DNOR; Figs. 1 and 2). In addition, we distinguished three
nantly consists of Permian acidic plutonic and metamorphic          categories of disturbance intensity. “Low intensity” included,
sedimentary rock, with some occurrences of Carboniferous            e.g., logging of single trees. “Moderate” included logging
mafic rock (Academy of Sciences of Mongolia, 1990). Slope           of patches within a forest stand and fires that did not affect
debris with mixed in aeolian sand and silt provides the par-        the whole forest stand. “Severe” included clear cutting and
ent material for the soils in the region. The widespread aeo-       fires that destroyed the whole forest stand (Table A1; Ap-
lian deposits originate from lacustrine sediments of big lakes      pendix). To reduce the effects of factors that were not in the
that dried out during the glacial periods in the basin of Great     focus of this study, we kept geology, exposition (only north-
Lakes, located between the Mongolian Altai Mountains and            facing slopes), inclination, and slope morphology as simi-
the Khangai Mountains (Grunert et al., 2000; Lehmkuhl and           lar as possible. Elevation of the studied soil profiles ranged
Haselein, 2000; Klinge and Lehmkuhl, 2013).                         from 1850 to 2100 m a.s.l., which is well below the upper tree
   The climate is cold, semi-arid, and highly continental. In       line of approx. 2500 m a.s.l. (Klinge et al., 2018). A total of
the town of Tosontsengel, in the northern part of the study         54 soil profiles were described according to the FAO Guide-
area, the mean monthly temperatures range from −31.7 ◦ C            lines for Soil Description (Jahn et al., 2006) and classified
in January to 14.9 ◦ C in July (see Fig. S1 in the Supple-          according to the World Reference Base (WRB) for Soil Re-
ment). Mean annual precipitation is 200–500 mm. Rainfall            sources (IUSS Working Group WRB, 2015). The presence of
concentrates in summer because of low-pressure cells that           permafrost was documented as well. The soil profiles were
are blown in with the westerlies (Batima et al., 2005). The         sampled horizon-wise, whereby thick horizons were subdi-
mean annual temperature of −5.9 ◦ C supports discontinuous          vided for the sampling, such that the maximum thickness in-
permafrost in the study area (Bonan and Shugart, 1989). Per-        cluded in one sample did not exceed 30 cm. We also carried
mafrost patches occur on forested slopes, where the canopy          out in situ measurements of saturated hydraulic conductivity,
protects them from solar radiation, and the organic layer in-       using a compact constant-head permeameter (Eijkelkamp;
sulates them from high air temperatures in summer (Dasht-           Amoozegar and Warrick, 1986; USDA, 2014). The measure-
seren et al., 2014). In summer, the forests benefit from an         ments were done in five replicates. In addition, soil horizons
additional water supply by meltwater from the active layer          with low rock fragment contents were sampled with 100 and
above the permafrost (Zhang et al., 2011).                          250 cm3 steel cylinders for laboratory measurements of pF
   The vegetation of the study area is dominated by steppe.         curves and hydraulic conductivity, respectively. Samples for
Only north-facing slopes and some valley positions are cov-         pF curves were taken during two field campaigns, whereas
ered by forest, which predominately consist of Siberian larch       samples for hydraulic conductivity were taken only during
(Hilbig, 1987; Tsogtbaatar, 2013). The understorey of these         one field campaign and, thus, not from all profiles that were
forests varies with respect to proportions of grasses, herbs,       sampled for pF measurements. The in situ measurements of
mosses, and shrubs (commonly including, e.g., Vaccinium             hydraulic conductivity provided additional data. Therefore,
vitis-idaea and Lonicera altaica). High evapotranspiration          the sizes of the data sets for pF curves and hydraulic con-
combined with low precipitation and relief-dependant differ-        ductivity differ.
ences in insolation control the vegetation pattern (Schlütz et
al., 2008; Hais et al., 2016). The semi-arid conditions pro-
mote frequent forest fires in this region (Goldammer, 2002;         2.3   Laboratory analyses
Hessl et al., 2016). The last two severe fire events in the study
                                                                    The soil samples were dried at 40 ◦ C and passed through a
area happened in 1996 and 2002.
                                                                    2 mm sieve. Approximately 10 g of each sample was dried
   A timber factory was established in the 1960s in
                                                                    at 105 ◦ C to gravimetrically determine the remaining wa-
Tosontsengel. Thus, logging strongly affected the forest
                                                                    ter contents for correcting all analytical data obtained from
stands in the study area. Since the 1990s, industrial log-
                                                                    the samples dried at 40 ◦ C. An aliquot of each sample was
ging has been abandoned, but illegal logging is still com-
                                                                    milled. Total C and N contents were analysed on the milled
mon (Lkhagvadorj et al., 2013). Moreover, pastoral pres-
                                                                    samples using a CHN analyser (LECO TruSpec). Carbon-
sure increased over the last few decades (Lkhagvadorj et al.,
                                                                    ate contents were also analysed on the milled samples us-
2013). Logging, followed by grazing, led to a reduction in
                                                                    ing the Scheibler method. Soil organic carbon (SOC) con-
the forested area, especially at its lower boundary and at the
                                                                    tents were calculated by subtracting soil inorganic C (ob-
forest edges.
                                                                    tained from carbonate analysis) from total C. Soil pH was
                                                                    measured in 1 M KCl solution at a soil : solution ratio of 1 : 5.

https://doi.org/10.5194/soil-7-563-2021                                                                  SOIL, 7, 563–584, 2021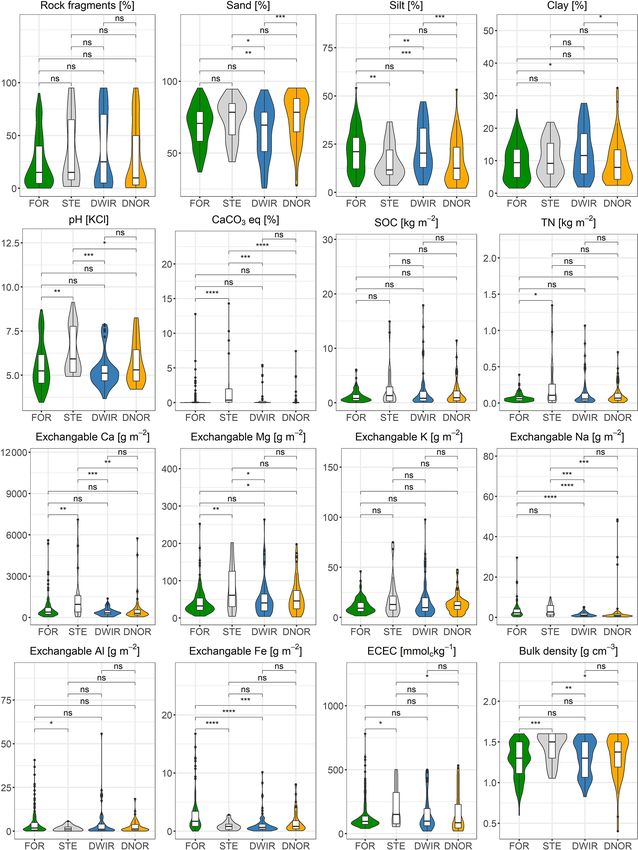
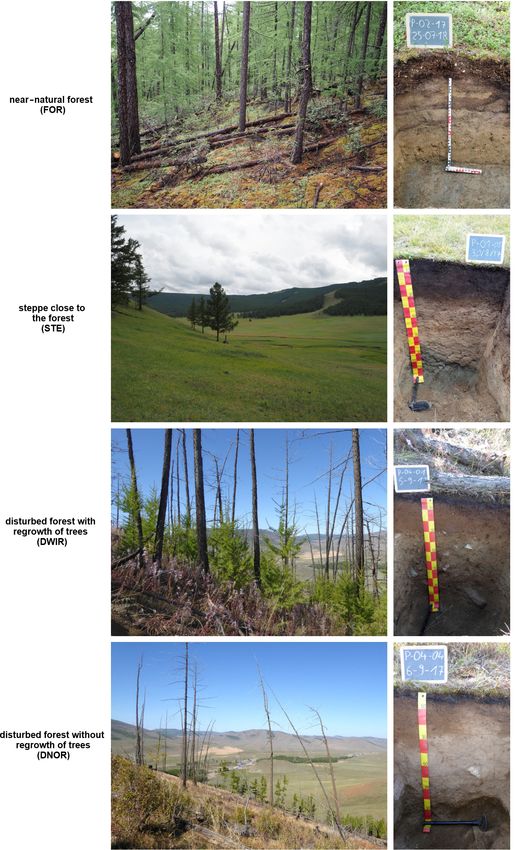
566                               F. Schneider et al.: Hydrological soil properties control tree regrowth after forest disturbance

Figure 1. Sentinel image (31 July 2019) of the study area with soil profile positions. The colours indicate the four vegetation categories that
were used for selecting the following soil profile locations: near-natural forest (FOR; green), steppe close to the forest (STE; grey), disturbed
forest with regrowth of trees (DWIR; blue), and disturbed forest showing no regrowth of trees (DNOR; orange). The soil profiles are listed
in Table 1 of the Appendix. The inset at the top right shows a physical map of Mongolia with the location of the study area (white square).

Exchangeable Al, Fe, Mn, Ca, Mg, K, and Na were extracted                  treatments for particle size distribution analysis were as fol-
with 1 M ammonium chloride solution and measured by use                    lows: soil organic matter was removed by 30 % H2 O2 , car-
of an ICP-OES (inductively coupled plasma–optical emis-                    bonates were dissolved, if necessary, by 10 % hydrochloric
sion spectrometer; Thermo Scientific). The effective cation                acid, and micro-aggregates were dispersed by 0.4 M sodium
exchange capacity (ECEC) was calculated as the sum of neg-                 pyrophosphate. The three sand fractions were separated by
ative charges occupied by these exchangeable cations. Pre-                 sieving, and the silt and clay fractions were determined by

SOIL, 7, 563–584, 2021                                                                            https://doi.org/10.5194/soil-7-563-2021
F. Schneider et al.: Hydrological soil properties control tree regrowth after forest disturbance                                     567

                                                                        ple was placed in a petri dish, and the surface was manually
                                                                        smoothened. The time was measured until a drop of distilled
                                                                        water, released from a pipette at 5 cm above the sample sur-
                                                                        face, infiltrated into the sample.

                                                                        2.4   Data processing and statistical analysis

                                                                        We described and sampled the soil profiles down to either
                                                                        the bedrock or permafrost, resulting in a maximum depth
                                                                        of 180 cm. According to the literature, the roots of Siberian
                                                                        larch can reach this depth (Kapper, 1954; Albenskiy et al.,
                                                                        1956). Therefore, we included all soil horizons in the calcu-
                                                                        lations of element stocks to evaluate the nutrient availability
                                                                        for larch trees at a site. To assess, in addition, the site condi-
                                                                        tions for tree seedlings without fully developed root system,
                                                                        we only used the properties of the uppermost 10 cm of the
                                                                        soils. For this purpose, we calculated the weighted means of
                                                                        the following variables for the uppermost 10 cm of the soils:
                                                                        content of rock fragments, bulk density, H+ concentration
                                                                        (log (10−pH )), carbonate content, clay content, silt content,
                                                                        sand content, and ECEC (first group of variables). Element
                                                                        contents in the fine earth of each horizon were converted to
                                                                        element stocks per horizon (considering rock fragment con-
                                                                        tent and bulk density) and were summed up over the upper-
                                                                        most 10 cm of the soils. This was done for exchangeable Al,
                                                                        Ca, K, Na, Mg, Mn, Fe, SOC, and total N (TN; second group
                                                                        of variables).
                                                                           All statistical analyses were carried out with the R project
                                                                        for statistical computing (R Core Team, 2014). The share of
                                                                        each horizon in the uppermost 10 cm of the soil was used for
                                                                        the weighting, based on the formula x1 (Eq. 1), for the first
                                                                        group of variables, and the formula x2 (Eq. 2), for the second
                                                                        group of variables.

Figure 2. Typical soil profiles under the four vegetation categories.   x1 = if (upper boundary > 10) {NA}

                                                                            else if (lower boundary  10) {NA}
turbed samples in the laboratory. All element concentrations
                                                                            else if (lower boundary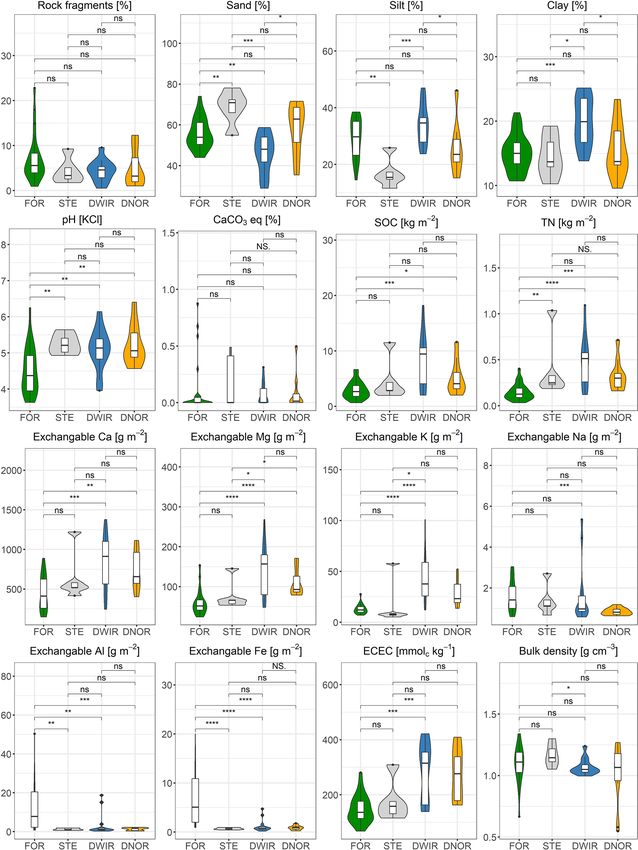
568                             F. Schneider et al.: Hydrological soil properties control tree regrowth after forest disturbance

between the variables and the samples. The PCA of the up-          3     Results
permost 10 cm of the soils also included inclination, expo-
sition, and elevation. Linear regression models were used to       3.1    Field observations
compare the data obtained for soils under DWIR and DNOR.
The results, including 95 % confidence intervals, described        The bedrock in the study area predominantly consisted of
the differences between the soils under DWIR and DNOR.             granite, with some minor occurrences of gneiss. Thick aeo-
   We did not subject measured plant-available field capac-        lian sand sheets locally covered the lower slopes and valley
ity (FCpa ) and hydraulic conductivity to statistical analy-       bottoms along west–east running valleys (Fig. 1). Thus, car-
sis because of their unequal representation of the vegetation      bonates that were observed in some of the soils were sup-
groups. Although we tried to sample as many profiles as pos-       posed to originate from aeolian deposits.
sible, high rock fragment contents prevented equal sampling           The parent materials of the soils on the slopes generally
of soils under the different vegetation groups and resulted in     consisted of a vertical succession of two to three sediment
a small number of samples. Thus, we only present the mea-          layers. The lowermost one was typically a solifluction layer,
sured data in a site-wise comparison to prevent any bias.          characterised by a high content of rock fragments with sizes
   In addition, we applied a pedotransfer function to esti-        ranging from fine gravel to angular stones. This layer was
mate FCpa for all soil horizons, based on other measured           usually overlain by another slope deposit, consisting of a
soil parameters that were available for all samples. We tested     mixture of weathering products of the bedrock, and aeolian
several transfer functions from the literature and chose the       sand and silt. This slope deposit showed lower rock fragment
function established by Gupta and Larson (1979) because it         contents than the underlying one but similar rock fragment
matched best with our measured pF data, is based on a large        sizes. The proportions of sand and silt in the upper slope de-
data set (43 soils and a test run on 61 soils), and included a     posit varied both within a profile and between the profiles. In
wide range of different soils (0 %–65 % clay content; 1 %–         places, a Holocene colluvial deposit with varying thickness
72 % silt content; 5 %–98 % sand content; 0.74–1.74 g cm3          covered the slope deposits described above. Our profiles 4,
bulk density; see Table S1). We calculated the plant-available     5, and 38 predominantly consisted of Holocene colluvium,
field capacity (FCpa,cal ) as follows:                             whereas most of the other profiles included either no or only
                                                                  a thin Holocene colluvial deposit. The Holocene colluvial de-
                                                                   posits had very low contents of rock fragments that typically
FCpa,cal (vol %) = 0.005678 · sand (%)
                                                                   consisted of fine to medium gravel. At three sites, only a thin
                                                                   sediment layer covered the bedrock (profiles 3, 47, and 52).
               + 0.009228 · silt (%)
                                                                   As an exception, the parent material at one of the forest sites
               + 0.009135 · clay (%)                               (profiles 1, 2, 7, 8, and 9) consisted of a slope deposit with
               + 0.006103 · Corg (%)                               extremely high proportions of aeolian sand.
                                                                   Phaeozems and Cambisols were the most common soils
                                            −3
               − 0.2696 · bulk density g cm                        under the near-natural forests (FOR) and disturbed ar-
                                                                  eas (DWIR, DNOR). In addition, Cryosols occurred above
               −       − 0.000059 · sand (%)                       permafrost patches. Soils under steppe (STE) included
                                                                   Phaeozems, Chernozems, and Kastanozems. The soil struc-
               + 0.001142 · silt (%)                               ture of the A horizons was generally granular, the B hori-
                                                                   zons had a subangular or angular blocky structure, and the C
               + 0.005766 · clay (%)
                                                                   horizons had a single grain, massive, or rock structure. Rock
               + 0.002228 · Corg (%) + 0.02671                     fragments in several C horizons showed manganese or car-

                                                                   bonate pendants (Table A1; Appendix). Bioturbation by ro-
               · bulk density(g cm3 ) · 100.               (3)     dents was observed in the soils at one forest site (profiles 1,
                                                                   2, 7, 8, and 9), whereas cryoturbation was not found at any
The results were multiplied by fine earth content (volumetric      of the investigated sites, most likely because of insufficient
fine earth content; hereafter vol %), thus assuming that rock      moisture. Charcoal was present in most of the topsoils.
fragments did not contribute to FCpa . We deleted three values        Human impact affected most of the sites, except for the
from the resulting FCpa,cal data set because they exceeded a       near-natural forest sites (FOR) that showed either no or only
FCpa,cal of 40 vol %, which we considered unrealistic.             minor disturbance, such as the cutting of single trees. Dis-
                                                                   turbance in DWIR and DNOR varied between moderate and
                                                                   severe. Most of the sites were impacted by both fire and log-
                                                                   ging; yet, some profiles were only affected by one type of
                                                                   disturbance (Table A1; Appendix).
                                                                      Permafrost was only encountered in soil profiles under
                                                                   near-natural forest (FOR). The depth of the permafrost table

SOIL, 7, 563–584, 2021                                                                 https://doi.org/10.5194/soil-7-563-2021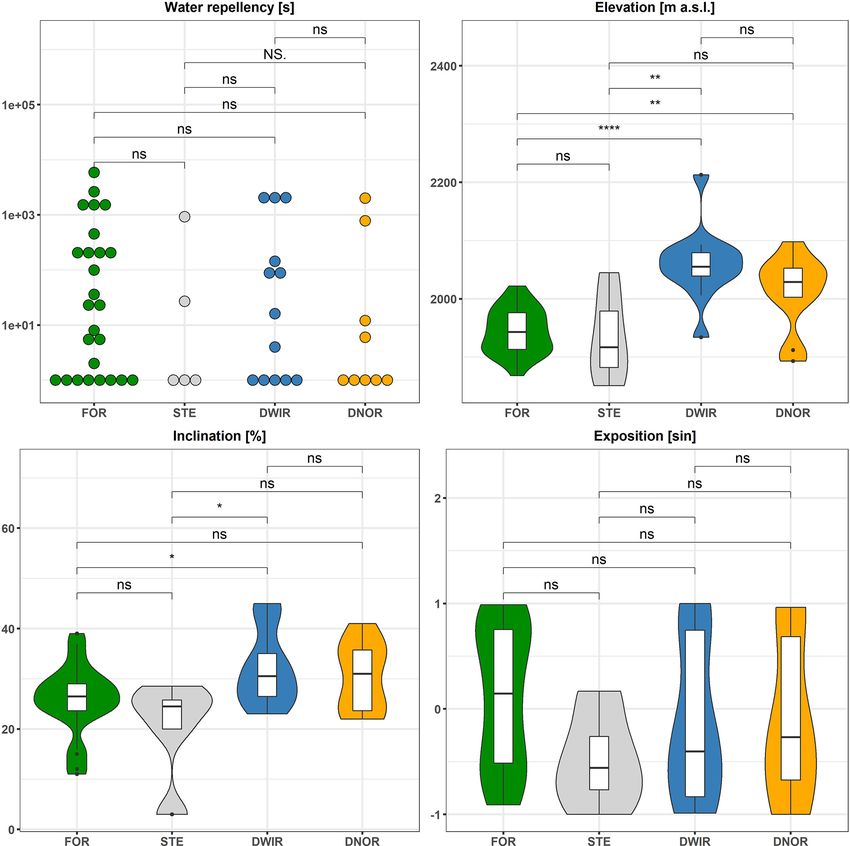
F. Schneider et al.: Hydrological soil properties control tree regrowth after forest disturbance                               569

varied between 60 and 100 cm in soils on slope debris under        der STE, DNOR, and FOR clustered around pH, carbonate
closed forests and between 140 and 180 cm in soils on sandy        content, and exchangeable Ca and Na. In addition, another
deposits under open forests (Table A1; Appendix). In soils         cluster around SOC and TN stocks, and exchangeable Mg,
under STE, DWIR, and DNOR, no permafrost was present               K, and Mn, occurred close to the axis of clay and silt con-
above the bedrock that was typically encountered between           tents. Mainly soils under DWIR, but also some soils under
80 and 110 cm soil depth.                                          STE, fell into this cluster.
                                                                      In the PCA of the data for the uppermost 10 cm of the
3.2   Chemical and physical soil properties
                                                                   soil profiles, the first two factors explained 54.5 % of the
                                                                   total variance (Fig. 5b). Sand content and bulk density on
Comparison of the entire soil profiles (down to either the         one hand, made up one axis together with silt content, on the
bedrock or permafrost) showed that soils under STE had sig-        other hand. Rock fragment content and exchangeable Fe and
nificantly higher contents of carbonates and exchangeable          Al, on one hand, made up a second axis together with pH,
Ca than soils under all other vegetation categories (Fig. 3),      on the other hand. In addition, a cluster of clay content, SOC
whereas soils under FOR had significantly higher contents of       and TN stocks, ECEC, and exchangeable Mg, K, and Mn oc-
exchangeable Fe compared to soils under all other vegetation       curred. The factor elevation also fell into this cluster but with
categories. There were no statistically significant differences    a minor contribution. The contributions of inclination, expo-
between soils under DWIR and DNOR with respect to rock             sition, carbonate content, and exchangeable Na were negli-
fragment contents, SOC and TN stocks, pH, contents of ex-          gible. In general, the data for the uppermost 10 cm of the
changeable Mg, K, Na, Al, Mn, and ECEC. However, soils             soils under the four vegetation categories (lower PCA) plot-
under DWIR and DNOR differed significantly in their parti-         ted more separately from each other than those for the entire
cle size distribution. Soils under DWIR had higher silt and        soil profiles (upper PCA). The arithmetic means and 95 %
clay contents, whereas soils under DNOR had higher sand            confidence intervals of the data for the uppermost 10 cm of
contents. Soils under FOR had similar silt contents to soils       the soils under the four vegetation categories (smaller dots
under DWIR, whereas soils under STE had similar sand con-          and shaded ellipses) confirmed the differences and clear sep-
tents to soils under DNOR. Bulk density of soils under FOR         aration. Soils under FOR plotted around the axes of sand
and DWIR was lower than that of soils under DNOR. Yet,             and exchangeable Fe and Al. Soils under STE concentrated
there was only a significant difference in bulk density be-        around sand and bulk density, thereby slightly shifting to the
tween soils under FOR and DNOR but not between soils un-           side of exchangeable Ca, Mg, K, and SOC and TN stocks.
der DWIR and DNOR.                                                 Soils under DWIR plotted closer to silt than to sand and
   Comparison of only the uppermost 10 cm of each soil pro-        mostly fell into the cluster of ECEC, exchangeable Mg, K,
file (for evaluating the soil conditions for tree seedlings)       and SOC and TN stocks. Soils under DNOR plotted between
suggested that soils under DWIR had larger stocks of ex-           those under STE and DWIR. The confidence interval of the
changeable Mg and K, SOC, and TN than soils under DNOR;            soils under FOR was clearly separated from all other con-
however, these were without significant differences (Fig. 4).      fidence intervals. That of the soils under DWIR was also
The other chemical soil properties showed no differences be-       separated and showed only a minor overlap with the one of
tween soils under DWIR and DNOR. In contrast, the par-             soils under DNOR. The confidence intervals of the soils un-
ticle size distribution again showed a significant difference      der STE and DNOR showed a considerable overlap.
between soils under DWIR and DNOR. Soils under STE had                Based on the data presented in Figs. 3–5, we chose the
the highest sand contents, followed by soils under DNOR.           most relevant variables for direct comparison of the soil
Soils under DWIR had the highest clay and silt contents, fol-      properties under DWIR and DNOR, using multiple linear re-
lowed by soils under FOR. Bulk densities and rock fragment         gression models (Fig. 6). We found a significant difference in
contents of the soils of the four vegetation categories were       particle size distribution, both for the data of the entire soil
similar.                                                           profiles (Fig. 6a) and for the uppermost 10 cm of the soil pro-
   In the principle component analysis (PCA) of the data for       files (Fig. 6b). Soils under DNOR clearly had more sand and
the entire soil profiles, the first two factors explained 56.3 %   less silt and clay than soils under DWIR. The soils did not
of the total variance (Fig. 5a). The variables of sand con-        exhibit significant differences with respect to any other soil
tent, rock fragment content, and bulk density, on the one          properties. All confidence intervals overlapped with the zero
hand, made up one axis together with clay and silt contents,       line, and all p values were >0.05. The only relevant observa-
on the other hand. Most of the data scattered around this          tion was that the uppermost 10 cm of the soil profiles under
axis, regardless of the vegetation category. Exchangeable Al       DNOR tended to have smaller stocks of SOC and exchange-
and Fe, on the one hand, made up a second axis together            able K compared to those under DWIR; however, these were
with pH, carbonate content, and exchangeable Ca and Na, on         without significant differences.
the other hand. Exchangeable Al and Fe did not contribute
much to the PCA, on the one hand, yet the soils under FOR
clustered around them. On the other hand, some soils un-

https://doi.org/10.5194/soil-7-563-2021                                                                 SOIL, 7, 563–584, 2021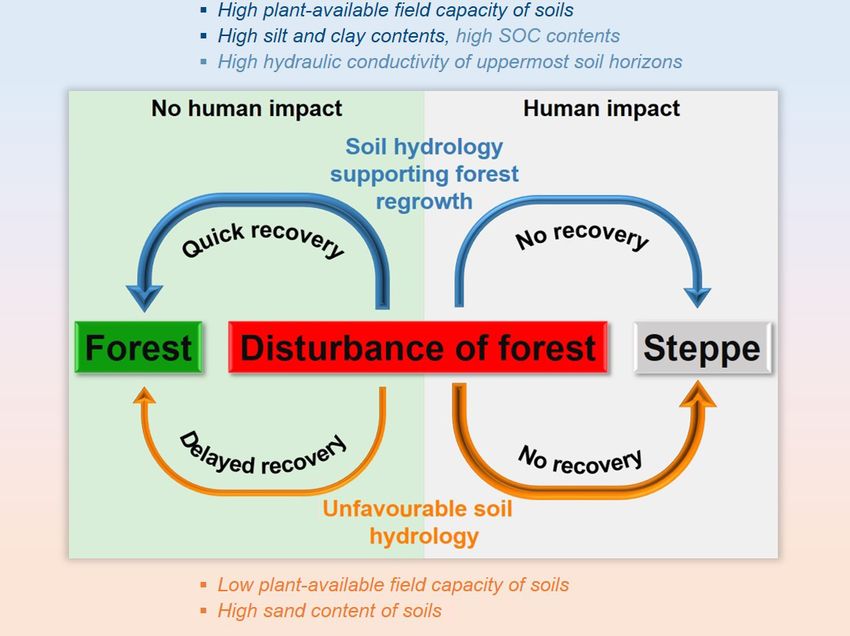
570 F. Schneider et al.: Hydrological soil properties control tree regrowth after forest disturbance
Figure 3. Properties of the entire soil profiles (down to either the bedrock or permafrost) under the following four vegetation categories
(n = 305): near-natural forest (FOR; green), steppe close to the forest (STE; grey), disturbed forest with regrowth of trees (DWIR; blue), and
disturbed forest showing no regrowth of trees (DNOR; orange). P values indicated above the plots were calculated for differences between
the arithmetic means (ns – p>0.05; ∗ – p ≤ 0.05; ∗∗ – p ≤ 0.01; ∗∗∗ – p ≤ 0.001; ∗∗∗∗ – p ≤ 0.0001). Horizontal bars are medians, boxes
are first and third quartiles, points are outliers, and violins are data distributions.
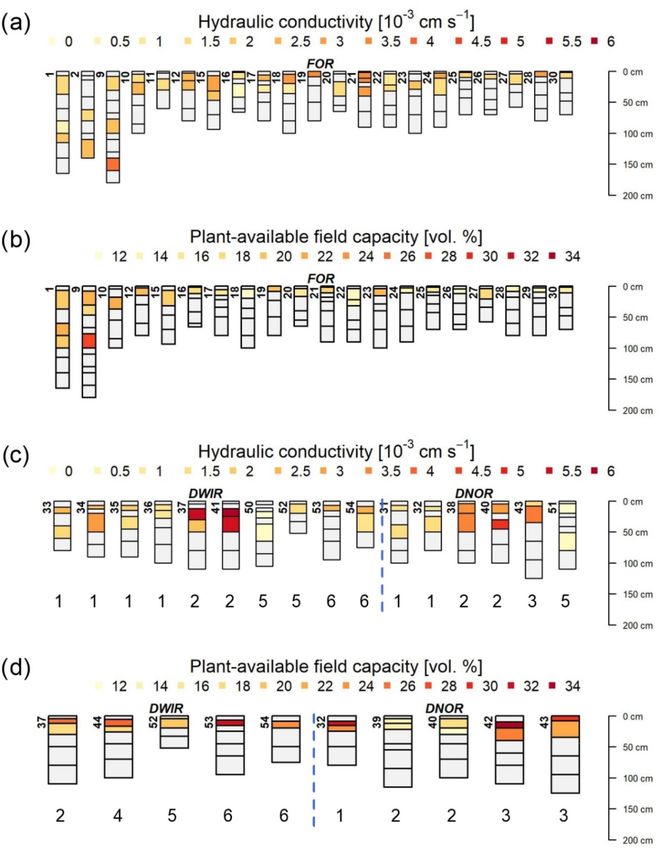
3.3 Hydrological soil properties in their uppermost horizons (Fig. 7c). For example, the hy-
draulic conductivities of soil profiles 31 and 32 (DNOR) at
site 1 were below 1.5 × 10⁻³ cm s−1 , whereas those of pro-
In general, all soils had high hydraulic conductivities due
files 33–36 (DWIR) ranged between 1.5 and 3×10⁻³ cm s−1 .
to their predominantly sandy texture. A site-wise compari-
Profiles 38 and 40 (DNOR) at site 2 showed hydraulic con-
son between soils under DWIR and DNOR showed that soils
ductivities between 2.5×10⁻³ and 3.5×10⁻³ cm s−1 in their
under DWIR tended to have higher hydraulic conductivities
SOIL, 7, 563–584, 2021 https://doi.org/10.5194/soil-7-563-2021
F. Schneider et al.: Hydrological soil properties control tree regrowth after forest disturbance                                        571

Figure 4. Properties of the uppermost 10 cm of the soil profiles under the following four vegetation categories (n = 54): near-natural forest
(FOR; green), steppe close to the forest (STE; grey), disturbed forest with regrowth of trees (DWIR; blue) and disturbed forest showing
no regrowth of trees (DNOR; orange). P values indicated above the plots were calculated for differences between the arithmetic means
(NS. – p = 1; ns – p>0.05; ∗ – p ≤ 0.05; ∗∗ – p ≤ 0.01; ∗∗∗ – p ≤ 0.001; ∗∗∗∗ – p ≤ 0.0001). Horizontal bars are medians, boxes are first
and third quartiles, points are outliers, and violins are data distributions.

uppermost horizons, while the hydraulic conductivities of                horizon, FCpa ranged from 12 vol % to 22 vol % in soils un-
profiles 37 and 41 (DWIR) exceeded 5 × 10⁻³ cm s−1 . Soils               der FOR and from 12 vol % to 33 vol % in soils under DWIR
under FOR showed similar hydraulic conductivities, with a                and DNOR. The differences between soils under DWIR and
maximum of 3.5 × 10⁻³ cm s−1 (Fig. 7a). Soils under FOR                  DNOR became clearer in a site-wise comparison. For exam-
had lower plant-available field capacities (FCpa ) than soils            ple, FCpa of profiles 39 and 40 (DNOR) at site 2 ranged be-
under DWIR and DNOR (Fig. 7). Except for one subsoil                     tween 12 vol % and 17 vol %, whereas profile 37 (DWIR) had

https://doi.org/10.5194/soil-7-563-2021                                                                         SOIL, 7, 563–584, 2021

572                               F. Schneider et al.: Hydrological soil properties control tree regrowth after forest disturbance

                                                                         Figure 6. (a) Estimates and 95 % confidence intervals of linear re-
                                                                         gression models, comparing entire soil profiles under disturbed for-
                                                                         est showing no regrowth of trees (DNOR; orange) to those under
                                                                         disturbed forest with regrowth of trees (DWIR; blue; n = 305). P
                                                                         values indicated below the plots were calculated for the differences
                                                                         between the estimates for soils under DNOR and DWIR. Data for
                                                                         exchangeable Mg were left out for better readability (estimate is
                                                                         +4.5; confidence intervals are +21.2/ − 12.2; p = 0.596). (b) Es-
                                                                         timates and 95 % confidence intervals of linear regression models,
                                                                         comparing the uppermost 10 cm of the soil profiles under DNOR
                                                                         (orange) to those under DWIR (blue; n = 54). P values indicated
                                                                         below the plots were calculated for the differences between the esti-
                                                                         mates for soils under DNOR and DWIR. Data for exchangeable Mg
                                                                         were left out for better readability (estimate is −32.2; confidence
                                                                         intervals are +16.5/ − 80.9; p = 0.184). BD is bulk density, SOC
                                                                         is soil organic carbon, TN is total nitrogen, and K is exchangeable
                                                                         potassium.
Figure 5. (a) PCA of the properties of the entire soil profiles under
the following four vegetation categories (n = 303): near-natural for-
est (FOR; green), steppe close to the forest (STE; grey), disturbed
forest with regrowth of trees (DWIR; blue), and disturbed forest
showing no regrowth of trees (DNOR, orange). (b) PCA of the prop-        Larson (1979) because of the wide range of soils used in
erties of the uppermost 10 cm of the soil profiles under the four veg-   their data set, making it widely applicable. We assume that
etation categories (n = 52). In addition, inclination, exposition, and   the mismatch with our measured data was due to the distur-
elevation were included in the second PCA. Arithmetic means and
                                                                         bance of the samples during the transport from Mongolia to
95 % confidence intervals of the data for soils under each vegetation
                                                                         Germany and due to high rock fragment contents in many of
category are represented by a smaller circle and a shaded ellipse, re-
spectively. SOC is soil organic carbon, TN is total nitrogen, ECEC       our samples, which created several problems. For instance,
is effective cation exchange capacity, BD is bulk density, and Ca,       there was a risk that rock fragments might have been hit
Mg, K, Na, Al, Fe, and Mn are exchangeable cations.                      and slightly moved by the cylinders when these were ham-
                                                                         mered into the soil, and that moving the rock fragments, in
                                                                         turn, pushed the finer particles, thus slightly altering the pore
                                                                         size distribution. The contribution of rock fragments to FCpa
FCpa between 17 vol % and 26 vol %. However, the limited                 was neglected, and there was uncertainty in the calculation
number of samples analysed for FCpa did not allow for a fi-              of rock fragment content (vol %), based on soil bulk density
nal statement on differences between the sites with respect to           and an assumed rock density of 2.65 g cm3 . FCpa,cal (vol %)
FCpa .                                                                   of each horizon was transformed into plant-available water
   Plant-available field capacity calculated by pedotransfer             volume at field capacity (PAWVFC ) per square metre in the
functions from the literature (FCpa,cal ) and measured plant-            whole soil profile (Fig. 8a) and only in the uppermost 10 cm
available field capacity (FCpa ) did not match well, and the             of the soils (Fig. 8b). Thereby, we assumed that PAWVFC
highest obtained R 2 was only 0.195 (see the Supplement; Ta-             stored in the whole profile is the relevant factor for mature
ble S1). We chose the pedotransfer function of Gupta and                 trees, whereas PAWVFC stored in the uppermost 10 cm of

SOIL, 7, 563–584, 2021                                                                         https://doi.org/10.5194/soil-7-563-2021
F. Schneider et al.: Hydrological soil properties control tree regrowth after forest disturbance 573
4 Discussion
4.1 Chemical soil properties
In general, the Siberian larch has low requirements with re-
spect to chemical soil properties (Dylis, 1947). It can grow on
a wide range of soils and may colonise even rather fresh sed-
iments (Timoshok and Skorokhodov, 2014). Siberian larch
can also adapt to low nutrient availability by enhanced
soil nutrient exploitation (Lebedev, 2012; Chernyshenkî and
Vasilyev, 2019). Most importantly, it needs nitrogen (Lebe-
dev, 2010; Chernyshenkî and Vasilyev, 2019), like many
other larch species including Larix gmelinii (Schulze et al.,
1995; Liang et al., 2014), Larix kaempferi (Leyton, 1956;
Kayama et al., 2009), and hybrids such as Larix × eurolepis
(Pâques, 1994). Also, a lack of K and Mg may limit the
growth of larch species on poor, sandy soils (Leyton, 1956;
Phu, 1975), whereas growth limitation by insufficient P sup-
ply has not yet been reported. Generally, differences in the
vitality and growth of larch are more commonly caused by
climatic or hydrological differences than by nutrient limita-
tions (Fiedler et al., 1980; Stüber, 1998; Viers et al., 2013).
Because of the low nutrient requirements of Siberian larch,
and since we did not detect any significant differences in
the chemical properties of soils under disturbed forest with
regrowth of trees (DWIR) and under disturbed forest show-
ing no regrowth of trees (DNOR), we conclude that chemical
Figure 7. Hydraulic conductivities (a) and plant-available field ca- soil properties are not responsible for the differences in post-
pacities (b) of soils under near-natural forest (FOR) and hydraulic disturbance regrowth of Siberian larch in our study area. The
conductivities (c) and plant-available field capacities (d) of soils un- uppermost 10 cm of the soils under FOR had even signifi-
der disturbed forest with regrowth of trees (DWIR; left) and under cantly smaller N stocks and lower contents of exchangeable
disturbed forest showing no regrowth of trees (DNOR; right). Soil Ca, Mg, and K than the uppermost 10 cm of the soils under
horizons in light grey were not subjected to these measurements. DNOR. Nevertheless, saplings and young trees were growing
The same numbers under the profiles in panels (c) and (d) indicate in the FOR areas, which confirms that the nutrient supply of
that the profiles were located at the same site.
all analysed soils fulfilled the needs of Siberian larch. Also,
nutrient stocks were similar to, or even higher than, those
the soils is crucial for the reestablishment of seedlings after reported from other Siberian larch forests and from forests
forest disturbance. of other larch species (Kayama et al., 2009; Watanabe et al.,
There were no significant differences in PAWVFC for the 2012; Wang et al., 2014).
whole soil profiles among the four vegetation categories
(Fig. 8a). In contrast, PAWVFC in the uppermost 10 cm was 4.2 Physical soil properties and soil hydrology
significantly higher in soils under DWIR compared to soils
under all other vegetation categories (Fig. 8b). Soils under Soils under DWIR had significantly more silt and clay and,
FOR, STE, and DNOR showed no significant difference in thus, higher plant-available field capacity than soils under
PAWVFC in their uppermost 10 cm. Soils under FOR exhib- DNOR, which were considerably sandier (Fig. 4). As mean
ited a very wide range of PAWVFC in their uppermost 10 cm. annual precipitation in Tosontsengel is only 200–250 mm,
Water repellency of topsoils under different vegetation cat- lack of water represents a major limitation for tree growth
egories did not show any differences (Fig. A2; Appendix). (Dulamsuren et al., 2011; Chenlemuge et al., 2015). Under
Topsoil samples from all vegetation categories included sam- these climatic conditions, it is plausible that silt and clay
ples on which the water drop only persisted for 1 or a few content and the corresponding plant-available field capacity
seconds and samples on which the drop persisted for more are key factors controlling the post-disturbance tree regrowth
than 1000 s. pattern. The similarity in the silt and clay contents of soils
under DNOR and soils under STE (no significant difference
in Fig. 4) points to a potential risk of DNOR sites to perma-
nently shift to steppe vegetation. Such a potential shift has
https://doi.org/10.5194/soil-7-563-2021 SOIL, 7, 563–584, 2021574 F. Schneider et al.: Hydrological soil properties control tree regrowth after forest disturbance Figure 8. Calculated plant-available water volume at field capacity (PAWVFC ) per square metre stored in entire soil profiles (a) and stored in only the uppermost 10 cm of soil profiles (b) under the following four vegetation categories: near-natural forest (FOR; green), steppe close to forest (STE; grey), disturbed forest with regrowth of trees (DWIR; blue), and disturbed forest showing no regrowth of trees (DNOR; orange). n = 49, and P values were calculated for differences between the arithmetic means (ns – p>0.05; ∗ – p ≤ 0.05; ∗∗ – p ≤ 0.01; ∗∗∗ – p ≤ 0.001; ∗∗∗∗ – p ≤ 0.0001). Horizontal bars are medians, boxes are first and third quartiles, points are outliers, and violins are data distributions. already been predicted for the forest steppe in the Khentey depth. As tree roots reach deeper down into the soil, they Mountains, Mongolia (Dulamsuren and Hauck, 2008; Du- benefit from rapid water infiltration below the depth of the lamsuren et al., 2009). roots of grasses and herbs. Lange et al. (2015) carried out ir- Measured plant-available field capacities confirmed the rigation experiments on grass-dominated south-facing slopes difference between soils under DWIR and DNOR. Calcu- and forest-dominated north-facing slopes in the Mongolian lated PAWVFC further underscored the crucial role of soil forest steppe. On south-facing slopes, most of the water was water storage for post-disturbance tree regrowth under the either taken up by grass or evaporated, and the remaining wa- given climatic conditions. With respect to PAWVFC of the ter reached only 5 cm soil depth. On north-facing slopes, the whole soil profiles, the absence of any significant differences water percolated down to the permafrost table. Although the between the four vegetation categories (Fig. 8a) is in accor- contrasting exposition also affected this experiment, these re- dance with the fact that mature trees were originally able to sults confirm the competitiveness of grasses for water in the grow on all of these north-facing slopes prior to a severe dis- upper soil horizons and the relevance of soil hydraulic con- turbance. With respect to the uppermost 10 cm of the soils, ductivity for tree growth in water-limited environments. the significantly higher PAWVFC under DWIR compared to We did not detect a positive effect of permafrost on post- soils under all other vegetation categories (Fig. 8b) highlights disturbance tree regrowth, as permafrost was neither encoun- the importance of water storage in the uppermost centime- tered under DWIR nor under DNOR. This is in agreement tres for the re-establishment and survival of seedlings after with observations by Kopp et al. (2014), who reported the severe forest disturbance, which is the precondition for post- absence of permafrost 5 years after severe forest fire. The disturbance forest recovery. The very wide PAWVFC range in same authors, moreover, measured increased soil moisture in the uppermost 10 cm of soils under FOR suggests that these soils of burned sites, compared to soils under forest, which FOR sites include both sites where seedlings will be able they attributed to the absence of tree transpiration. In con- to re-establish after severe disturbance and sites where this trast, Park et al. (2009) indicated a decrease in soil mois- will not be possible, which means that, most likely, no forest ture after fire and logging, arguing that evaporation loss from regrowth will take place if once a severe forest disturbance the bare soils and deterioration of physical soil properties ex- happens to these sites. ceeds the decrease in transpiration. In our study area, we also In the site-wise comparison, hydraulic conductivity tended observed rather decreased soil moisture at sites disturbed by to be higher in the uppermost horizons of soils under DWIR fire and logging, compared to near-natural forest sites. An ad- compared to their counterparts under DNOR. Trees may ben- ditional decline in soil moisture after fire can be induced by efit from this difference for two reasons. First, rapid infil- water repellency that may increase surface runoff (DeBano, tration through the uppermost horizons reduces evaporation 2000; Mataix-Solera and Doerr, 2004). However, we did not loss. Second, grasses and herbs have a dense but shallow root observe a significant difference in water repellency between system and compete with tree roots for water at shallow soil the four vegetation categories, possibly because of the high SOIL, 7, 563–584, 2021 https://doi.org/10.5194/soil-7-563-2021
F. Schneider et al.: Hydrological soil properties control tree regrowth after forest disturbance                                    575

                                                                         tors controlling the post-disturbance tree regrowth pattern
                                                                         (Fig. 9). This is the outcome of this work, and relates to mod-
                                                                         erate and severe disturbances in our study area, which lead to
                                                                         deforested areas showing diverse tree regrowth. Differences
                                                                         in tree regrowth between moderate and severe disturbances
                                                                         were not detected. The observed low disturbances did not
                                                                         have considerable effects on the forests.
                                                                            Loss of the shading by the forest canopy, the forest mi-
                                                                         croclimate, and the insulating organic layer, in turn, leads to
                                                                         permafrost degradation. Also, the ongoing climate change
                                                                         accelerates permafrost decline in Mongolia. Thus, this es-
                                                                         sential soil water reservoir is likely to disappear (Sharkhuu
                                                                         and Sharkhuu, 2012). As the meltwater from the active layer
                                                                         above the permafrost table can support tree growth even at
                                                                         sites where soil water storage is below the threshold for tree
                                                                         growth, permafrost decline may also contribute to the de-
Figure 9. Possible development pathways of disturbed forests in the      crease in forest area in the Mongolian forest steppe. In some
Mongolian forest steppe, as controlled by soil hydrology and human       of our investigated sites, this has already happened.
impact. Soil properties listed in dark blue show the significant pos-       Klinge et al. (2020) estimated that the potential forest dis-
itive effect, light blue show the non-significant positive effect, and   tribution in the Khangai Mountains is 3 times larger than the
orange show the significant negative effect.                             actual forest area. This discrepancy indicates that forest fire
                                                                         and human activity already caused a considerable decline in
                                                                         forested areas.
frequency of fires in our study area and associated enhanced
erosion (Goldammer, 2002; Hessl et al., 2012). As water re-
                                                                         5    Conclusions
pellency occurred irregularly across the whole study area, in-
cluding DWIR and DNOR, it seemed to be irrelevant for the                This study showed that the post-disturbance regrowth pattern
post-disturbance tree recovery pattern in our study area.                of forests in the central Mongolian forest steppe, a highly
                                                                         sensitive, semi-arid landscape, is largely controlled by soil
4.3   Further relevant environmental factors                             hydrology. With respect to our hypotheses established in the
                                                                         beginning of this paper, we conclude with the following:
Other factors besides soil hydrology that influence the post-
                                                                             1. Differences in post-disturbance tree regrowth depend
disturbance tree regrowth pattern include in particular relief
                                                                                mainly on the texture of the uppermost soil horizons.
and human activity. Relief-induced water gains in concave
                                                                                Loamy soils have high plant-available field capacity and
positions may support tree growth even where soil properties
                                                                                are, thus, able to store sufficient amounts of water for
seem to be unfavourable. Similarly, water losses through di-
                                                                                post-disturbance re-establishment of seedlings as a pre-
vergence in convex positions may hamper tree growth, even
                                                                                condition for forest regrowth. In contrast, sandy soils
where soil properties seem to be suitable. Also, small tree
                                                                                cannot store enough water for the re-establishment of
patches that survived a disturbance can have a positive influ-
                                                                                seedlings and subsequent recovery of tree vegetation
ence on post-disturbance tree regrowth. In our study area, we
                                                                                under the present environmental conditions.
observed enhanced fructification of trees that had survived
forest fires, initiating tree regrowth in belts around small tree            2. Post-disturbance tree regrowth may be supported by
patches that had persisted. We explain this observation by                      higher hydraulic conductivity in the uppermost soil
the shading of the remaining adult trees that reduces evapo-                    horizons, as rapid percolation through the upper soil
ration and creates a more even microclimate on the ground                       horizons reduces evaporation loss. In addition, trees
and by the increased availability of intact seeds in the direct                 benefit from the reduced competition for water with
surrounding of mature trees (Dugarjav, 2006).                                   grasses and herbs that results from rapid water perco-
   In contrast, human activity, especially logging and pas-                     lation into the subsoil.
toral pressure, may inhibit post-disturbance forest recov-
                                                                             3. Nutrient limitation is not relevant for the uneven post-
ery (Khishigjargal et al., 2013; Dulamsuren et al., 2014;
                                                                                disturbance tree regrowth pattern in our study area, as
Khansaritoreh et al., 2017b). In particular, goats grazing in
                                                                                the dominant tree species, Siberian larch, has rather low
areas of burned forest or in forest stands that have previ-
                                                                                nutrient requirements.
ously been opened by partial logging, hamper the growth
of seedlings and damage young trees (Sankey et al., 2006).                   4. Meltwater from the active layer above the permafrost
Thus, human impact and soil hydrology are the two key fac-                      table provides additional water for near-natural forests.

https://doi.org/10.5194/soil-7-563-2021                                                                        SOIL, 7, 563–584, 2021
576 F. Schneider et al.: Hydrological soil properties control tree regrowth after forest disturbance
However, it cannot be a relevant factor for the uneven
post-disturbance regrowth pattern of Siberian larch in
our study area because permafrost was not encountered
under disturbed forests either with or without tree re-
growth.
Under the given climatic conditions, water limitation is
the predominant factor controlling tree growth in the semi-
arid Mongolian forest steppe. Therefore, even small differ-
ences in soil properties that lead to an increase in the amount
of plant-available water can be decisive for post-disturbance
tree regrowth.
Disturbances by severe fire or clear-cutting result in a loss
of permafrost and, thus, the loss of an additional water reser-
voir during summer. Such an additional water source can be
critical at sites where soil water storage alone is slightly be-
low the threshold for tree growth. Therefore, such sites are
particularly prone to an irreversible shift from forest to steppe
after a strong disturbance involving loss of permafrost. More-
over, we expect that many sites where soil hydrology allows
for post-disturbance tree regrowth under the present climatic
conditions will lose their ability for post-disturbance forest
recovery in the course of the ongoing climate change, as the
present conditions are very close to the threshold for forest
growth, and already a minor change may lead to a fall below
this threshold.
Climate projections predict that the decrease in permafrost
will continue, and drought events will become both more fre-
quent and more intensive. At the same time, it seems unlikely
that the pressure on forests in the Mongolian forest steppe by
fire, logging, and grazing will decrease, unless explicit and
effective measures are taken. The consequences of this un-
favourable interplay will most likely include a decrease in
the growth rates of trees and a further considerable and ir-
reversible decline in forested area. Therefore, the regulation
of the human impact on the forests in the Mongolian forest
steppe is mandatory if a further irreversible loss of forest area
is to be avoided.
SOIL, 7, 563–584, 2021 https://doi.org/10.5194/soil-7-563-2021F. Schneider et al.: Hydrological soil properties control tree regrowth after forest disturbance 577 Appendix A Figure A1. Scatterplots for water repellency (expressed as water drop infiltration time in seconds; n = 53) and violin plots and box plots for the elevation (n = 54), inclination (n = 54), and exposition (n = 54) of the soils under the four vegetation categories of near-natural forest (FOR; green), steppe close to forest (STE; grey), disturbed forest with regrowth of trees (DWIR; blue), and disturbed forest showing no regrowth of trees (DNOR; orange). P values were calculated for differences between the arithmetic means (NS – p = 1; ns – p>0.05; ∗ : p ≤ 0.05; ∗∗ – p ≤ 0.01; ∗∗∗ – p ≤ 0.001; ∗∗∗∗ – p ≤ 0.0001). Horizontal bars are medians, boxes are first and third quartiles, points are outliers, and violins are data distributions. https://doi.org/10.5194/soil-7-563-2021 SOIL, 7, 563–584, 2021
F. Schneider et al.: Hydrological soil properties control tree regrowth after forest disturbance
https://doi.org/10.5194/soil-7-563-2021
Table A1. General information on the soil profiles. Abbreviations are according to the Guidelines for Soil Description (Jahn et al., 2006). If permafrost∗ is present, the depth of the
permafrost table equals the profile depth.
Vegetation Profile Coordinates Coordinates Elevation Inclination Exposition Bedrock Main Pendants Profile Presence of Disturbance Disturbance Soil type
category ID N E (m a.s.l.) (%) (◦ ) sediment on rock depth permafrost∗ by fire by logging (based on WRB)
type fragments (cm)
FOR 1 48◦ 38.6810 98◦ 22.1410 1915 24.5 320 Granite Sand sheet No 165 Yes No No Eutric Cambisol (Katoarenic, Bathygelic,
Epiloamic, Nechic, Ochric, Endoraptic)
FOR 2 48◦ 38.7000 98◦ 22.0340 1907 26.5 340 Granite Sand sheet No 140 Yes No No Eutric Cambisol (Katoarenic, Bathygelic,
Amphiloamic, Nechic, Ochric)
STE 3 48◦ 38.9290 98◦ 22.1220 1882 28.5 301 Granite Bedrock No 90 No No No Skeletic Cambic Endoleptic Phaeozem (Amphiarenic,
Epiloamic, Nechic)
STE 4 48◦ 38.3770 98◦ 22.2020 1917 25.75 292 Granite Colluvium No 90 No No No Endoskeletic Phaeozem (Amphiarenic, Colluvic,
Epiloamic, Nechic, Epiraptic)
STE 5 48◦ 38.7360 98◦ 21.8530 1851 20 307 Granite Colluvium No 110 No No No Endoskeletic Chernozem (Katoarenic, Cambic,
Colluvic, Amphiloamic, Amphiraptic)
STE 6 48◦ 38.2160 98◦ 22.4080 1979 24.5 300 Granite/gneiss Slope deposit No 120 No No No Endoskeletic Endoleptic Phaeozem (Katoarenic,
Colluvic, Epiloamic, Nechic, Epiraptic)
FOR 7 48◦ 38.1810 98◦ 22.4870 2007 31 304 Granite/gneiss Sand sheet No 105 No No Low Eutric Endoskeletic Cambisol (Katoarenic, Epiloamic,
Nechic, Ochric, Epiraptic)
FOR 8 48◦ 38.2060 98◦ 22.5110 2022 32 305 Granite/gneiss Sand sheet No 120 No No Low Eutric Endoskeletic Cambisol (Katoarenic,
Amphiloamic, Nechic, Ochric, Endoraptic)
FOR 9 48◦ 38.7700 98◦ 22.0740 1868 16 301 Granite Sand sheet No 180 Yes No Moderate Cambic Phaeozem (Katoarenic, Colluvic, Katoloamic,
Nechic, Endoraptic, Bathyprotocalcic,
Bathygleyic, Bathyturbic)
FOR 10 48◦ 38.7480 98◦ 22.1690 1900 26.5 303 Granite Slope deposit No 100 No No Moderate Haplic Phaeozem (Endoarenic, Colluvic, Amphiloamic,
Nechic, Amphiraptic)
FOR 11 48◦ 37.7660 98◦ 21.2150 1938 23.5 335 Granite/gneiss Slope deposit Manganese 60 Yes No No Endoskeletic Cambic Folic Reductaquic Cryosol
(Epiarenic, Eutric, Amphiloamic, Nechic, Ochric,
Epiraptic)
FOR 12 48◦ 37.7750 98◦ 21.2770 1943 28.5 317 Granite/gneiss Slope deposit No 80 Yes No No Endoskeletic Folic Reductaquic Cryosol (Amphiarenic,
Eutric, Epiloamic, Nechic, Ochric, Amphiraptic)
FOR 13 48◦ 37.2580 98◦ 21.5170 1974 27.5 335 Granite/gneiss Slope deposit Manganese 60 Yes No No Endoskeletic Folic Reductaquic Cryosol
(Eutric, Loamic, Nechic, Ochric, Epiraptic)
FOR 14 48◦ 37.3220 98◦ 21.6240 1969 27 326 Granite/gneiss Slope deposit No 80 Yes No No Endoskeletic Folic Cryosol (Epiarenic, Eutric,
Amphiloamic, Nechic, Ochric, Epiraptic)
FOR 15 48◦ 37.7280 98◦ 21.2330 1947 25 324 Granite/gneiss Slope deposit Manganese 94 Yes No No Endoskeletic Cambic Folic Reductaquic Cryosol
(Amphiarenic, Eutric, Amphiloamic, Nechic,
Ochric, Epiraptic)
FOR 16 48◦ 37.7870 98◦ 21.2100 1913 23.5 357 Granite/gneiss Slope deposit Manganese 66 Yes No Low Cambic Folic Reductaquic Cryosol (Amphiarenic,
SOIL, 7, 563–584, 2021
Eutric, Amphiloamic, Nechic, Ochric, Epiraptic)
FOR 17 48◦ 37.8160 98◦ 21.2080 1908 22 359 Granite/gneiss Slope deposit No 80 Yes No Low Endoskeletic Cambic Reductaquic Cryosol
(Endoarenic, Eutric, Epiloamic, Nechic, Ochric,
Amphiraptic)
FOR 18 48◦ 37.7550 98◦ 21.2800 1951 34.5 351 Granite/gneiss Slope deposit Manganese 100 Yes No No Endoskeletic Cambic Reductaquic Cryosol (Epiarenic,
Eutric, Amphiloamic, Nechic, Ochric, Epiraptic)
FOR 19 48◦ 37.7990 98◦ 21.2680 1930 30 358 Granite/gneiss Slope deposit Manganese 80 Yes No No Endoskeletic Folic Reductaquic Cryosol
(Eutric, Loamic, Nechic, Ochric, Epiraptic)
578You can also read