The influence of oxygen fugacity and chlorine on amphibole-liquid trace element partitioning at upper-mantle conditions
←
→
Page content transcription
If your browser does not render page correctly, please read the page content below
Eur. J. Mineral., 34, 35–57, 2022
https://doi.org/10.5194/ejm-34-35-2022
© Author(s) 2022. This work is distributed under
the Creative Commons Attribution 4.0 License.

                   The influence of oxygen fugacity and chlorine on
                    amphibole–liquid trace element partitioning
                              at upper-mantle conditions
           Enrico Cannaò1 , Massimo Tiepolo1 , Giulio Borghini1 , Antonio Langone2 , and Patrizia Fumagalli1
       1 Dipartimento   di Scienze della Terra “A. Desio”, Università di Milano, Via S. Botticelli 23, 20133 Milano, Italy
                           2 Istituto di Geoscienze e Georisorse, CNR, Via Ferrata 1, 27100 Pavia, Italy

                                  Correspondence: Enrico Cannaò (enrico.cannao@unimi.it)
           Received: 20 July 2021 – Revised: 30 November 2021 – Accepted: 1 December 2021 – Published: 25 January 2022

       Abstract. The recycling of volatile and incompatible elements through the entire Earth’s history is one of the
       most important processes for the chemical evolution of the lithosphere. In this context, amphiboles are impor-
       tant hydrous minerals playing a key role in the chemical differentiation of the crust–mantle system. We carried
       out amphibole–liquid partitioning (Amph/L D) experiments starting from a hydrous alkali basalt with variable
       chlorine content and doped in 37 trace elements of geochemical interest. Experiments were conducted with an
       end-loaded piston cylinder apparatus at a fixed pressure of 1.4 GPa, temperature from 1015 to 1050 ◦ C, and
       at two different oxygen fugacity conditions (f O2 ; 1FMQ ≈ −2.6 (log f O2 [experiment] − log f O2 [FMQ
       buffer]) and 1FMQ ≈ + 1.7). These conditions approach those of the Earth’s upper mantle chemically metaso-
       matised by subduction-derived agents that may occur in several geological settings. All runs show Ti-pargasites
       and kaersutites, either as individual crystals or replacing former clinopyroxenes, in equilibrium with alkali-rich
       (4 wt %–6 wt %) and silica-intermediate (52 wt %–59 wt %) melts. A comprehensive trace element dataset (LLEs
       – light lithophile elements, LILEs – light ion lithophile elements, REEs – rare Earth elements, HFSEs – high
       field strength elements, actinides, transition metals, chalcophiles) has been determined in glass and amphibole
       with a laser ablation inductively coupled plasma mass spectrometer (LA-ICP-MS). Although the melt polymer-
       ization has a major influence on Amph/L Ds, we provide evidence that changes in the f O2 of both the system and
       Cl content in amphibole (up to 0.88 wt %) also affect the Amph/L Ds of several trace elements and their ratios. In
       particular, at higher f O2 conditions lower Amph/L D values for U and Mo are observed likely in relation to the
       low capability of amphibole to incorporate the more oxidized forms of these cations. The Amph/L DTh /Amph/L DU
       ratio is positively correlated with the Cl content in amphibole, while the opposite behavior is shown by Amph/L D
       ratios of other elements with the same charge and different ionic radius (e.g., Gd / Yb, Nb / Ta, and Pb / Ba). Di-
       mensional modification of the amphibole structure in relation to the incorporation of Cl in the O(3) site are at
       the origin of the observed variations. General implications of our results are discussed.

1   Introduction                                                   In the last five decades many efforts have been dedicated to
                                                                   the determination of the mineral–liquid partition coefficient
The partitioning of trace elements between minerals and sil-       (Min/L D) for most of the trace element groups (e.g., light
icate melts is a key topic in our understanding of how ele-        lithophile elements – LLEs, light ion lithophile elements –
ments redistribute during Earth’s evolution, from primordial       LILEs, rare Earth elements – REEs, high field strength ele-
times to present. The affinity of trace elements in the melt       ments – HFSEs, actinide, transition metals) mainly in major
phase compared to their storage in minerals (i.e., incompati-      mantle-derived minerals like olivine, pyroxenes, garnet, and
ble behavior) acts as a geochemical filter playing a key role in   spinel and more typically crustal phases like feldspar, amphi-
the chemical differentiation of the core–mantle–crust system.      boles, and micas, as well as accessory phases such as allanite,

Published by Copernicus Publications on behalf of the European mineralogical societies DMG, SEM, SIMP & SFMC.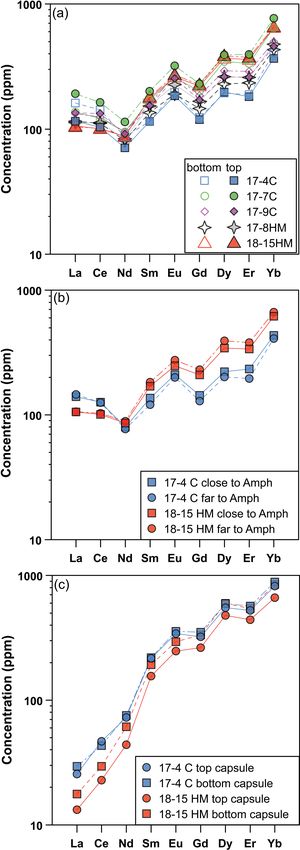
36                                                E. Cannaò et al.: The influence of oxygen fugacity and chlorine on Amph/L Ds

zircon, and rutile in more evolved petrologic systems (e.g.,           These changes could affect the ratios between Amph/L Ds of
Wood and Blundy, 2014, and references therein).                        trace elements with different ionic radii and entering in the
   The key parameters affecting Min/L D of trace elements are          same site. The Cl-rich amphiboles usually originate from
the initial composition of the system (e.g., acid vs. basic and        Cl-rich fluids rather than from Cl-rich melts (e.g., Giesting
volatile-bearing vs. anhydrous chemical systems) together              and Filiberto, 2016, and reference therein). However, a few
with its intensive parameters – i.e., pressure and temperature         experimental works have dealt with the genesis of Cl-rich
(P − T ) conditions (e.g., Adam and Green, 2003; Dalpé and             amphibole in magmatic-equivalent systems (Campanaro and
Baker, 2000; Green et al., 2014). The oxygen fugacity condi-           Jenkins, 2017; Chan et al., 2016; Jenkins, 2019), and they
tions (i.e., activity of oxygen – f O2 ) is a further factor able to   provided evidence that both Fe and K contents in amphiboles
affect the trace element incorporation within a specific min-          strongly influence the Cl incorporation.
eral during its crystallization (e.g., Dalpé and Baker, 2000).            Another parameter that can potentially affect the Amph/L Ds
Together with the H2 O contents, the f O2 also exerts a strong         of trace elements is the oxidation state, which is known to
influence on the physical behavior of magmas, the phase re-            be heterogeneous in the Earth’s mantle (Foley, 2011; Mc-
lations, and mineral chemistry (Feig et al., 2010, 2006; Foley,        Cammon, 2005). It is expected to be strongly reduced in
2011; Jenner et al., 2010; Sisson et al., 2005; Stamper et al.,        the deep lower mantle (lower than 5 log units below the
2014; Ulmer et al., 2018). How the f O2 affects the Min/L Ds           fayalite/ferrosilite–magnetite–quartz – FMQ – buffer) and
of trace elements is more evident by considering minerals              variably oxidized in the upper mantle (between −4 and +2
with complex and more versatile crystal structure, such as             log units below the FMQ buffer). The broad f O2 variability
those of amphiboles and micas (Ferraris and Ivaldi, 2002;              in the upper mantle likely reflects the deep injection of sur-
Oberti et al., 2007). This is mainly due to their greater abil-        ficial and mostly oxidized materials by recycling processes
ity to counterbalance charge imbalance imposed by the in-              active in convergent margins (e.g., Cannaò and Malaspina,
corporation of trace elements with different oxidation states          2018, and references therein). Dalpé and Baker (2000) ex-
(e.g., V, Ni, Mo, U) and to accommodate the incorporation              perimentally determined the effect of f O2 on trace element
of cations with both small (e.g., [6] Be2+ = 0.45 Å) and large         partitioning between Ca-amphibole and basaltic melt. They
(e.g., [8] Ba2+ = 1.42 Å) ionic radii.                                 demonstrate that changes in f O2 affect the Amph/L Ds of sev-
   Amphiboles are the most important hydrous minerals crys-            eral trace elements and modify the amphibole’s crystal struc-
tallizing in mafic/ultramafic systems because they can form            ture. This study was limited to Amph/L Ds of LILEs, HFSEs,
either at the expense of mantle pyroxenes or during hydrous            and REEs. Determination of Amph/L Ds of other important
magma crystallization at depths less than 100 km. Amphi-               element groups, such as LLEs, transition metals, and ac-
bole stability includes upper-mantle/lower-crust depths (e.g.,         tinides, at different f O2 is still lacking, and it represents a
Coltorti et al., 2004; Davidson et al., 2007; Müntener and Ul-         key mandatory aspect in order to fully investigate Earth’s
mer, 2006; Pirard and Hermann, 2015b; Smith, 2014) where               processes occurring at upper-mantle conditions (e.g., Nand-
they act as the main repository for several trace elements             edkar et al., 2016; Tiepolo et al., 2000a, 2007).
of geochemical interest (Tiepolo et al., 2000a). The com-                 In this contribution, we provide a new set of experimen-
plex and variable crystal chemistry of high-T magmatic am-             tally determined Amph/L Ds for a large number of trace el-
phibole is affected by several chemical mechanisms able                ements aiming to better understand the effect of f O2 and
to modify the major element distribution within the amphi-             Cl on trace element partitioning between amphibole and hy-
bole’s crystallographic sites and to exert a major control of          drous basaltic melt at lower-crust and upper-mantle con-
the amphibole’s volatile budget. The deprotonation in the              ditions. We experimentally derive a comprehensive set of
O(3) site (i.e., the loss of H+ from the hydroxyl anion OH− ),         Amph/L Ds obtained in Cl-poor and Cl-rich systems at both

the so-called oxo-component, can be balanced by crystal                low and high f O2 conditions: 1FMQ = −2.6 (log f O2 [ex-
chemical mechanisms involving either Ti4+ or Fe3+ (King                periment] − log f O2 [FMQ buffer]) and 1FMQ = +1.7,
et al., 1999; Oberti et al., 2007; Popp et al., 2006, 1995),           respectively. These conditions fit with the f O2 estimated val-
and this crystallographic process may induce variations in the         ues of the Earth’s upper mantle (1FMQ ∼ ±2) based on oxy-
Amph/L Ds. For instance, the Ti4+ incorporation in the M(1)            gen thermobarometry measurements on spinel-bearing peri-
site of the amphibole (instead of Mg2+ or Fe2+ ) influences            dotites (e.g., Frost and McCammon, 2008) and simulate hy-
the size of the M(1) octahedron and, consequently, induces             drous melt-related metasomatism of Earth’s upper mantle oc-
variation in the < M(1)-O(3)> distance, thus affecting the             curring in several geological settings (e.g., supra-subduction
Amph/L D /Amph/L D ratios (Tiepolo et al., 2000b, 2007).               and intraplate settings).
           Nb            Ta
In the O(3) site, the OH− can be substituted by Cl− with
implications for the whole crystal structure of the amphibole
itself (Makino et al., 1993; Oberti et al., 1993). The higher
ionic radii of Cl− with respect to other volatile species enter-
ing in the O(3) site affect the < M(1)-O(3)> and < M(3)-
O(3)> distances and the size of the A site of the amphiboles.

Eur. J. Mineral., 34, 35–57, 2022                                                          https://doi.org/10.5194/ejm-34-35-2022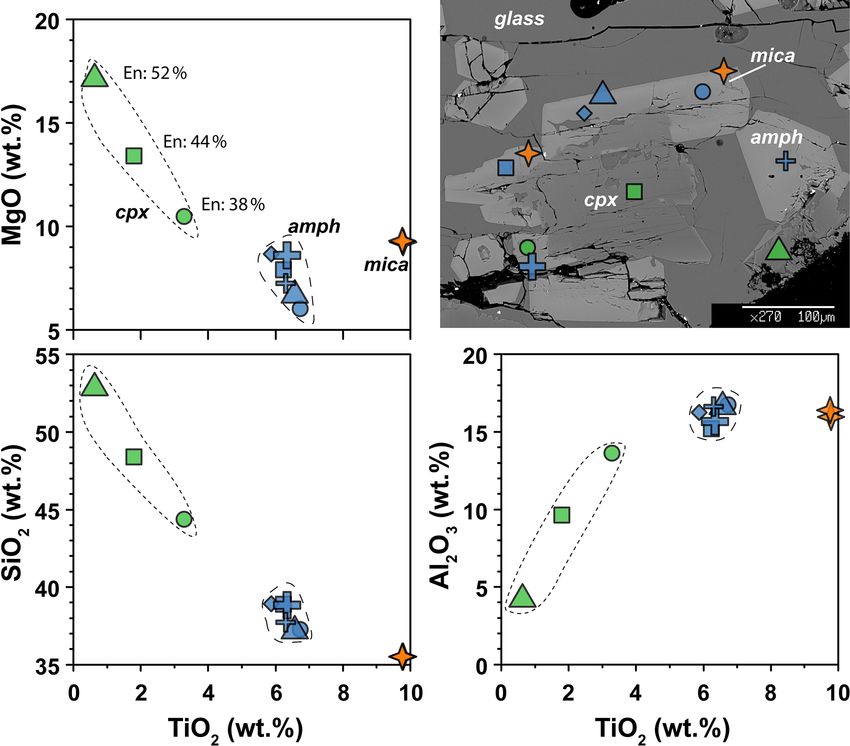
E. Cannaò et al.: The influence of oxygen fugacity and chlorine on Amph/L Ds                                                      37

2     Experimental and analytical techniques

2.1    Starting material                                          Table 1. Concentrations of major and trace elements in the starting
                                                                  glass (liquid) at 1300 ◦ C (exp 18-14C).
We reproduced the composition of the initial hydrous basalt
in the chemical system K2 O-Na2 O-CaO-MgO-FeO-Al2 O3 -
                                                                                                     n=5
TiO2 -SiO2 -H2 O starting from a mix of oxides and carbon-
ates (for more information see Tiepolo et al., 2000a). The                                         wt %     SD
carbonate component was eliminated by sintering the mix-                              SiO2        46.06    0.30
ture for 1 h at 930 ◦ C, whereas, to avoid Fe loss, iron was                          TiO2         2.16    0.07
added to the carbonate–oxide mixture after the sintering pro-                         Al2 O3      12.41    0.18
cess as Fe0 + Fe2 O3 . In order to promote the crystallization                        FeOTot       7.57    0.22
of amphibole, a different amount of distilled water (nomi-                            MgO          7.65    0.53
nally from 5.0 % to 13.2 % of the total volume) was added                             CaO          9.91    0.17
with a microliter syringe in each single experimental charge.                         Na2 O        2.20    0.17
The starting material was doped with a mixture of 33 trace                            K2 O         1.79    0.14
elements of geological relevance (REEs, LLEs, LILEs, HF-                              Cl           0.69    0.14
SEs, transition metals, and actinides) as already described                           Total       90.44
in Tiepolo et al. (2000a). A 1000 ppm ICP standard solution
                                                                                                     n=5
was used as source for As and Sb (As in 2 % HNO3 ; Sb in
2 % HCl) and added to the distilled water used to hydrate the                                      µg/g     SD
initial system. Table 1 reports the major and trace element                           Li           61.8     5.8
composition of the starting material.                                                 Be           38.9     3.5
                                                                                      B            68.4    11.9
2.2    Experimental techniques                                                        Sc          721.9    20.5
                                                                                      V           356.8    11.0
Experiments were performed at the Dipartimento di Scienze                             Cr          152.7     8.2
della Terra (University of Milan, Italy) at the fixed pressure                        Co          115.9     5.7
of 1.4 GPa and T ranging from 1015 to 1300 ◦ C (Table 2) in                           Ni           45.1     3.0
an end-loaded piston cylinder apparatus using MgO–Pyrex–                              Zn          758.0    55.3
Talc assembly. For all experimental runs, an initial pressure                         As          120.8    14.5
of 0.25 GPa was applied, and the sample was first heated to                           Rb          805.8    29.6
400 ◦ C for 20 min in order to soften the Pyrex. Then pressure                        Sr           88.5     1.6
                                                                                      Y            72.2     2.1
was raised to the experimental value before reaching the T
                                                                                      Zr          169.5    12.7
of 1300 ◦ C. After 1 h at 1300 ◦ C, when the starting basalt is
                                                                                      Nb          107.6     2.7
at super-liquidus conditions (see run 47-N 18-14C; Table 1),                          Mo          187.4     1.3
experimental runs were cooled down to the equilibrium T                               Cd          167.0    34.9
(ranging from 1050 to 1015 ◦ C), following the T -time path                           Sb          105.2     9.0
shown in Fig. 1b (with a ramp of 0.5 ◦ C/min). This procedure                         Cs          212.5     6.0
optimizes the growth of small numbers of large and (possi-                            Ba          142.0     3.9
bly) unzoned crystals of amphibole. Initial quench rates of                           La           62.9     2.0
90 ◦ C/s were attained by cutting off the power after 12 hours                        Ce           61.3     1.6
at the target T (Fig. 1b). The thermocouple tip was sepa-                             Nd           60.7     2.7
rated from the Pt capsule by a 0.6 mm thick hard alumina                              Sm          139.3     4.3
                                                                                      Eu          206.4     9.1
disk. K- and S-type thermocouples were used to measure
                                                                                      Gd          191.5     4.5
the T of the experiments and were considered to be accu-
                                                                                      Dy          343.1    11.4
rate to ±5 ◦ C. According to piston cylinder calibration, pres-                       Er          330.4    10.1
sure uncertainty is assumed to be ±3 %. Experimental cap-                             Yb          558.7    17.6
sules were then embedded in epoxy resin and polished us-                              Hf          688.9    12.6
ing non-aqueous lubricants for subsequent analytical analy-                           Ta          467.3    12.1
ses. Table 2 contains a summary of experimental conditions,                           Pb         1221.6    98.2
glass and amphibole compositions, and coexisting phases.                              Th         1541.7    38.8
                                                                                      U          1355.2    39.5

https://doi.org/10.5194/ejm-34-35-2022                                                         Eur. J. Mineral., 34, 35–57, 2022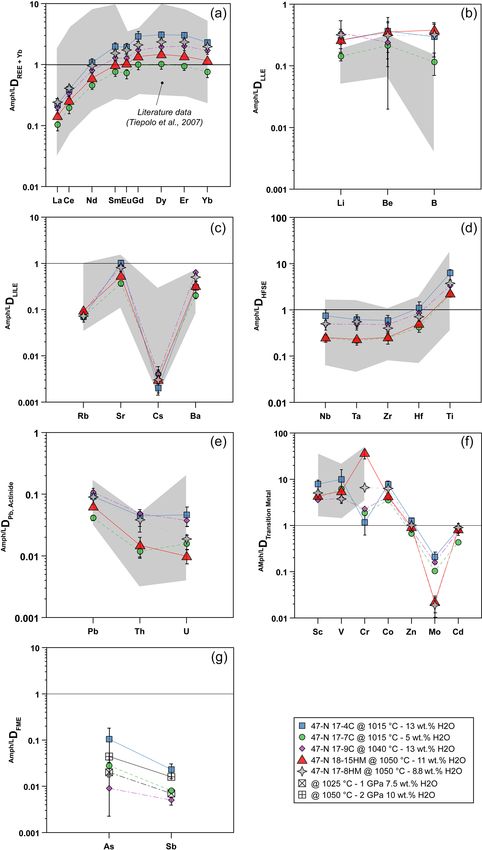
38                                                                       E. Cannaò et al.: The influence of oxygen fugacity and chlorine on Amph/L Ds

Table 2. Summary of experimental conditions and run products.

  Sample                  Temperature         Nominal H2 O          Buffer      log f O2       Capsule       Final                  Amph                                  Phase assemblages
                                (◦ C)                  (%)                      1FMQa                        glass                  composition                            and modes (%)b
                                                                                                                                                                 Glass      Cpx      Mica       Amph
  47-N 17-4C                       1015                   13.0      CCO            −2.56       Single        Andesite               Fe-Kaersutite                   30        38       incl          32
  47-N 17-7C                       1015                    5.0      CCO            −2.56       Single        Trachyandesite         Pargasite/kaersutite            34        25         1           40
  47-N 17-9C                       1040                   13.2      CCO            −2.64       Single        Trachyandesite         Kaersutite                      35        35                     30
  47-N 18-14C                      1300                    6.9      CCO            −3.46       Single        Basalt                 –                              100
  47-N 17-8HM                      1050                     6.5     HM             +1.71       Triple        Trachyandesite         Kaersutite                       40       35                     25
  47-N 18-15HM                     1050                     8.8     HM             +1.71       Double        Trachyandesite         Kaersutite                       47       28       incl          25
 a Calculated from Fig. 1. Single capsule uses the graphite sleeve. Amph: amphibole – Cpx: clinopyroxene – incl: inclusion in amphibole. b Modal amount of mineral calculated via mass balance (see Cannaò
 et al., 2022). Ilmenite is present as accessory phase in all experiments.

2.2.1      Single-capsule experiments                                                                        In the double-capsule experiment (47-N 18-15HM), a
                                                                                                          seal-welded inner (Fe-bearing) Pt capsule (OD = 2.3 mm)
For the experiments 47-N 17-7C/9C and 14C, approximately                                                  containing about 10 mg of starting material (plus As–Sb
12 mg of starting material was loaded into a graphite in-                                                 doped distilled H2 O) was placed inside an outer-welded Pt
ner capsule (outer diameter – OD – ∼ 2.8 mm) and then                                                     capsule (OD = 3.0 mm) filled with the buffering assem-
seal-welded into an outer Pt capsule (OD = 3.0 mm, length                                                 blage (hematite + ∼ 30 wt % of distilled H2 O). In the triple-
about 8–10 mm; Fig. 1a). Graphite is used to isolate the sam-                                             capsule experiment (47-N 17-8HM), a seal-welded inner (Fe-
ple from Pt capsule and avoid Fe loss (Johannes and Bode,                                                 rich) Pt capsule (OD = 2.3 mm) containing about 10 mg of
1978). The graphite–Pt assembly maintained the oxygen fu-                                                 starting material (plus As–Sb doped distilled H2 O) and a
gacity during the experimental run close to the C-CO–CO2                                                  second seal-welded inner Pt capsule (OD = 2.3 mm) with
equilibrium (CCO; Ulmer and Luth, 1991), which at our run                                                 the buffering assemblage (hematite + ∼ 30 wt % of distilled
conditions is about FMQ −2.6 (Fig. 1c; Table 2). In the ex-                                               H2 O) were placed inside an outer-welded Pt capsule (OD
periment 47-N 17-4C a similar capsule design was used even                                                = 3.0 mm) filled with a medium material (Al2 O3 + distilled
if its dimensions were bigger (OD = 5.0 mm, ID = 4.5 mm).                                                 H2 O). According to Matjuschkin et al. (2015), this capsule
In this case, about 30 mg of starting material was loaded into                                            design is more accurate in monitoring and controlling the
the graphite inner capsule.                                                                               f O2 in high-pressure piston cylinder experiments.
                                                                                                             In both experimental setups, the intrinsic fugacity of the
2.2.2      Experiments with double and triple capsule                                                     end-loaded piston cylinder apparatus coupled with the use
                                                                                                          of talc in the assembly, leads to the partial reduction of the
Experiments with the double- (Fig. 2c) and triple-capsule                                                 hematite into magnetite (HM buffer) during the run (e.g., Ul-
techniques allowed for the controlling of the oxygen fugac-                                               mer and Luth, 1991). As long as hematite + magnetite +
ity f O2 of the system during experiments (run 47-N 17-8HM                                                H2 O are present, this buffer fixes the fugacity of O2 and H2
and 18-15HM; Fig. 1a). We adopted the hematite–magnetite                                                  through the following reactions:
(HM) buffer that enforces a higher redox condition with re-
                                                                                                          4Fe3 O4 + O2 = 6Fe2 O3                                                                     (R1)
spect to the CCO experiment setting (FMQ + 1.71; Fig. 1c;
Table 2). In order to minimize the Fe loss from the starting                                              and
material, Fe preconditioning of Pt capsule (OD = 2.3 mm, ID
= 2.0 mm) has been performed by using a gas mixing vertical                                               2H2 O = 2H2 + O2 ,                                                                         (R2)
furnace at the Dipartimento di Scienze della Terra (Univer-
                                                                                                          which can be condensed to the following reaction:
sity of Milan, Italy). The Pt capsules were put in an iridium
pot and filled in- and outside with powder of natural basalt                                              2Fe3 O4 + H2 O = 3Fe2 O3 + H2 .                                                            (R3)
(with similar FeO content of the starting material). The mate-
rial was melted at 1300 ◦ C for 24 h controlling the f O2 (at a                                           Within the inner capsule, the dissociation of water at high
value close to FMQ + 2) of the furnace using a CO-CO2 gas                                                 T will produce oxygen and hydrogen according to Reac-
mix fixed by using a Tylan FC-260 flowmeters-group con-                                                   tion (R2). As the Pt capsule is partially permeable to the hy-
troller. A solution of HF and HClO4 (ratio of 3 : 1) was used                                             drogen, the fugacity of the H2 in the inner capsule is expected
to dissolve the glass product and to clean the capsules in or-                                            to be the same as the fugacity of H2 of the outer capsule
der to avoid any contamination with the pre-saturation mate-                                              (Chou et al., 1978). Indirectly, also the f O2 will be fixed by
rial. In addition to Fe, trace elements like Pb, Co, Ni, As, and                                          the HM buffer (Luth, 1989). The persistence of the buffering
Sb may form alloys with the Pt capsule (Adam and Green,                                                   assemblage (i.e., coexistence of hematite and magnetite) is
2006; see Supplement Fig. S1).                                                                            verified by means of scanning electron microscopy (Fig. 2d).

Eur. J. Mineral., 34, 35–57, 2022                                                                                                        https://doi.org/10.5194/ejm-34-35-2022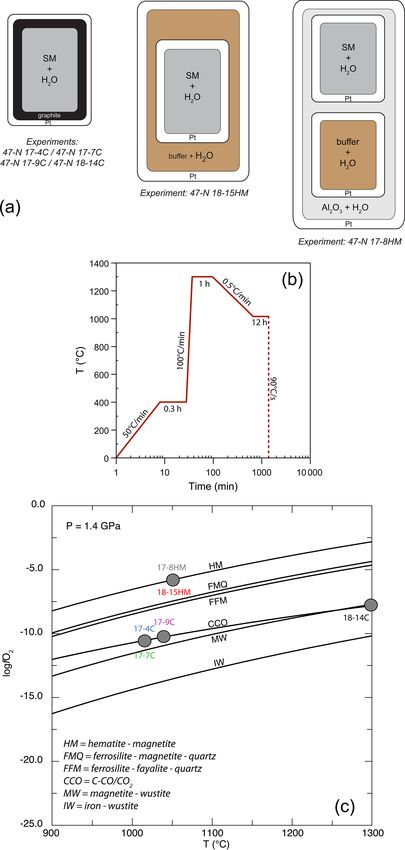
E. Cannaò et al.: The influence of oxygen fugacity and chlorine on Amph/L Ds                                                       39

                                                                       2.3    Analytical techniques

                                                                       Run products were inspected by back-scattered electron
                                                                       (BSE) images and microanalyses for the major element min-
                                                                       eral compositions performed using a JEOL JXA-8200 Super-
                                                                       Probe equipped with five wavelength-dispersive spectrome-
                                                                       ters (WDSs) and one energy-dispersive spectrometer (EDS)
                                                                       at the Dipartimento di Scienze della Terra, University of Mi-
                                                                       lan (Italy). The standards used were from natural materials:
                                                                       Mg on olivine, Fe on fayalite, Na on omphacite, Ti on il-
                                                                       menite, Mn on rhodonite, K on K-feldspar, Al and Ca on
                                                                       anorthite, Si on wollastonite, Cr on metallic/pure Cr, Cl on
                                                                       scapolite, and Ni on niccolite. Analyses on mineral phases
                                                                       were performed using 1 µm beam size (up to 3 µm for the
                                                                       glass and mica) and beam conditions of 15 kV and 5 nA.
                                                                       Counting time was 30 s for peak and 10 s for the background.
                                                                          Trace element mineral composition was determined by a
                                                                       laser ablation inductively coupled plasma mass spectrometer
                                                                       (LA-ICP-MS) at the IGG-CNR-UOS, Pavia (Italy). The in-
                                                                       strument couples a 213 nm Nd:YAG laser microprobe (New
                                                                       Wave research) to a quadrupole ICP-MS system (DRC-e
                                                                       from PerkimElmer). Beam sizes were chosen as large as pos-
                                                                       sible (up to 60 µm) to lower the limits of detection. The abla-
                                                                       tion system was operated at 10 Hz of repetition rate and with
                                                                       a fluence of ∼ 5.0 J/cm2 . The NIST SRM 612 was used as
                                                                       external standard, whereas 43 Ca or 29 Si was selected as an
                                                                       internal standard, depending on the analyzed mineral. The
                                                                       USGS reference sample BCR-2G was analyzed as unknown
                                                                       in each analytical runs for quality control. Accuracy and pre-
                                                                       cision are better than 10 % and 5 %, respectively. Data re-
                                                                       duction was carried out using the Glitter software package
                                                                       (Griffin et al., 2008).

                                                                       3     Experimental results

                                                                       3.1    Phase assemblages and texture

                                                                       Run products together with experimental details are summa-
                                                                       rized in Table 2. Isothermal run 47-N 18-14C contains only
                                                                       basaltic glass, confirming that the selected hydrous basalt
                                                                       is at super-liquidus condition at 1.4 GPa and 1300 ◦ C. Run
                                                                       products in cooled experiments are glass, clinopyroxene, am-
Figure 1. (a) Single-, double-, and triple-capsule design used in      phibole and mica (mica only in experiments 17-4C and 17-
crystallization experiments; SM is “starting material”. (b) Temper-    7C; Table 2). Ilmenite is present as accessory phase. Amphi-
ature vs. time path of the experiments. (c) Temperature vs. log f O2   bole is the only phase stable with the glass in all the cooled
diagram at fixed pressure of 1.4 GPa reporting the different exper-    runs at both CCO and HM oxygen fugacity conditions (Ta-
imental runs (see Table 2 for more information). The solid lines       ble 2). The amount of residual glass varies between 30 %
represent f O2 conditions by adopting different buffers. Calculating   and 47 %. Clinopyroxene is 100 to 300 µm in size (Fig. 2a),
f O2 was achieved using the Perple_X software (Connolly, 2005).        and it shows irregular habits and lobate, curvilinear bound-
                                                                       aries, suggesting disequilibrium with the surrounding glass
                                                                       (Fig. 2b). Amphibole occurs as single crystal with euhedral
                                                                       habitus showing sharp and straight boundaries against the
                                                                       glass (Fig. 2a, b), but it can also replace the former clinopy-
                                                                       roxene crystals and may include glass (Fig. 2b). Amphibole

https://doi.org/10.5194/ejm-34-35-2022                                                              Eur. J. Mineral., 34, 35–57, 2022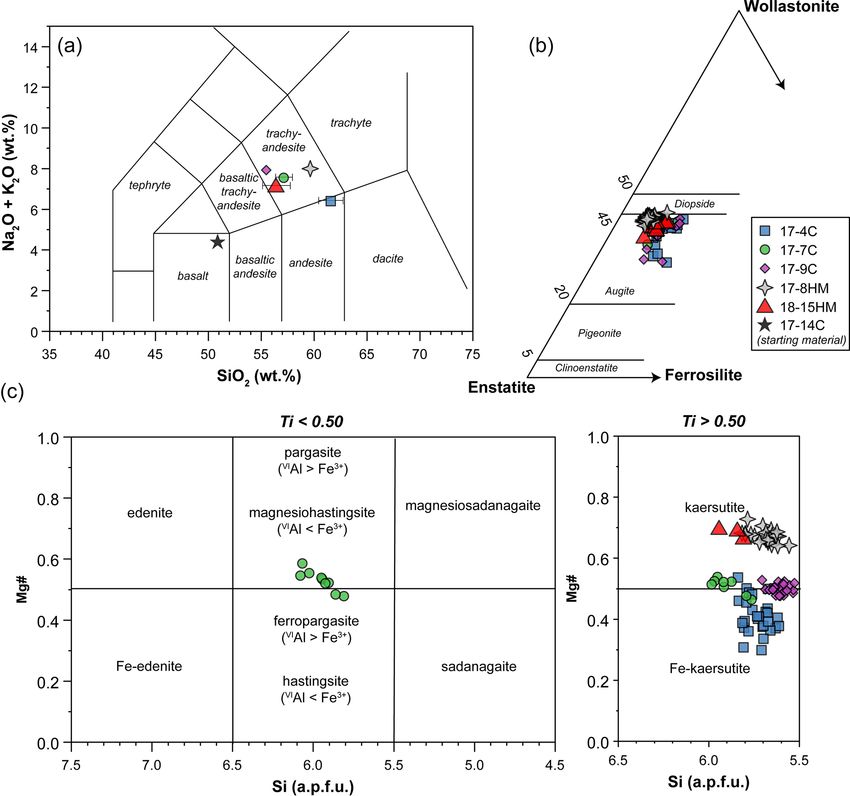
40 E. Cannaò et al.: The influence of oxygen fugacity and chlorine on Amph/L Ds
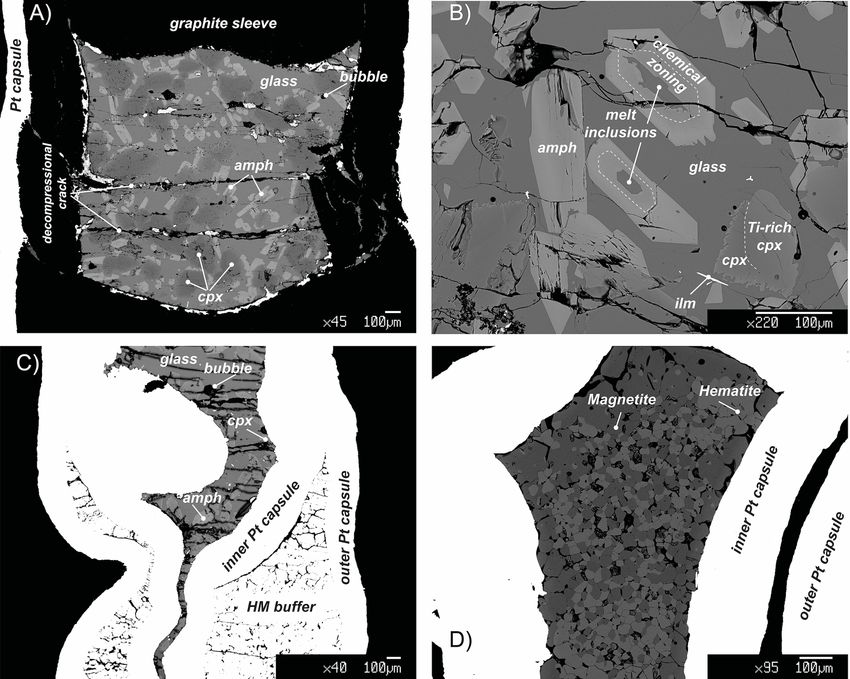
Figure 2. Representative back-scattered electron (BSE) images showing the representative textures in key experiments. (a) Panoramic view
of the capsule of the run 17-9C: amphibole (amph) shows a rather polygonal habit and is crystallized from the residual melt (glass) reacting
with the former clinopyroxene (cpx). (b) Texture of experiment 17-4C showing amphibole (amph) replacing clinopyroxene (cpx). Amphibole
includes small pockets of glass that reacts with the amphibole creating light chemical zoning. During the cooling, clinopyroxene grains react
with the surrounding melt as evidenced by the corroded grain boundaries (ilm: ilmenite). (c) BSE overview image of the run 18-15HM
(double-capsule design). (d) BSE image of the hematite–magnetite (HM) buffer of the run 17-8HM (triple-capsule design).
crystals range from 50 to 100 µm in size; in place, they are ment compositions of clinopyroxenes and micas are provided
elongated crystals and may reach up to 350 µm. In some ex- in the Supplement Table S1.
perimental runs, mica grains are included into the amphibole The glass compositions mainly fall in the trachyan-
(17-4C and 17-7C) or dispersed in the glass showing irregu- desite/andesite fields (Fig. 3a). Glass chemical variations rel-
lar boundaries (only in experiment 17-7C). ative to the initial composition reflect the crystallization of
Due to the high TiO2 content of the starting material (Ta- clinopyroxene and amphibole, as revealed by the SiO2 and
ble 1) required to stabilize amphibole crystallization at high MgO vs. CaO and TiO2 correlations (Fig. 4). Glasses show
T , small acicular grains of ilmenite form randomly along the moderate Cl contents (from 0.74 wt % to 2.40 wt %; Table 3)
entire capsule (Fig. 2). Glass is overall limpid and does not in relation to the Sb doping ICP standard solution (HCl 2 %;
show quenched crystals (Fig. 2). see Sect. 2.1). Within each single experimental charge, the
Phase assemblages and textures are similar between the trace element variations (e.g., REEs) in glasses from the top
different experimental runs with no significant difference as to the bottom of the capsule, as well as close to and far from
a function of experimental setups (i.e., single- vs. double- the amphibole crystals, are almost negligible (Fig. 5a and b).
/triple-capsule techniques) and the fixed f O2 . The clinopyroxenes have a composition in between diop-
side and augite in all experiments (Fig. 3b). The most
3.2 Glass and mineral chemistry enstatite-rich composition belongs to the clinopyroxene
showing partial reaction with the glass, suggesting that these
Major and trace element compositions of glasses and amphi- grains were the first to crystallize (see Fig. 6). Few clinopy-
boles are reported in Tables 3 and 4, respectively; major ele- roxenes show core-to-rim chemical variation due to the con-
Eur. J. Mineral., 34, 35–57, 2022 https://doi.org/10.5194/ejm-34-35-2022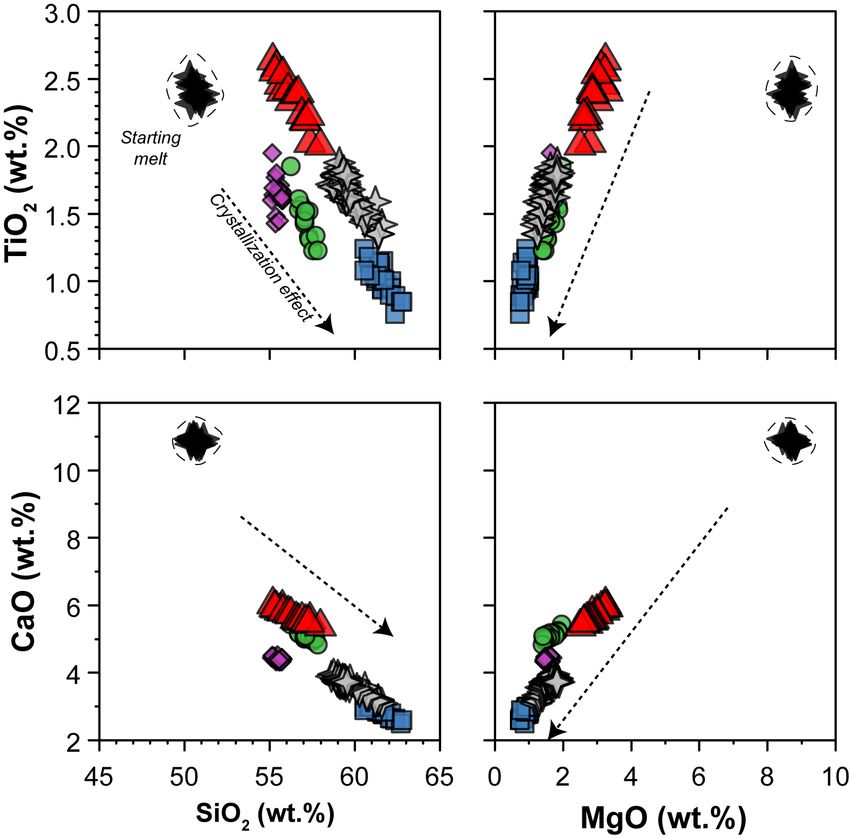
E. Cannaò et al.: The influence of oxygen fugacity and chlorine on Amph/L Ds                                                      41

Table 3. Glass compositions (major elements in wt % and trace elements in µg/g).

         Exp no.                       17-4C            17-7C              17-9C             17-8HM               18-15HM
         n (no. analyses)              15    SD∗        15       SD        20       SD        40       SD           16     SD
         SiO2                       57.94    0.61    52.35      0.57    53.77      0.22    57.09      0.67      52.40     0.88
         TiO2                        0.96    0.10     1.34      0.14     1.59      0.11     1.60      0.14       2.20     0.17
         Al2 O3                     18.14    0.19    16.46      0.29    17.91      0.16    19.74      0.25      17.53     0.23
         FeOTot                      6.17    0.41     7.14      0.25     7.74      0.19     3.62      0.31       5.32     0.47
         MgO                         0.85    0.08     1.49      0.16     1.51      0.07     1.50      0.18       2.71     0.23
         CaO                         2.66    0.12     4.67      0.12     4.28      0.06     3.50      0.22       5.34     0.18
         Na2 O                       3.31    0.08     3.46      0.14     3.69      0.09     3.77      0.14       3.22     0.10
         K2 O                        2.70    0.06     3.46      0.08     4.00      0.06     3.89      0.06       3.41     0.10
         Cl                          1.32    0.06     1.26      0.03     2.40      0.07     0.99      0.06       0.74     0.04
         Total                      90.44            91.62              96.89              95.69                92.86
         n (no. analyses)              11                7                  7                 13                     3
         Li                         115.2     9.3    143.3      8.5     108.9      8.4     119.4       3.1        85.9     2.5
         Be                           83.8   17.0      79.9    18.0       72.6      9.9      80.7      9.6        62.9     7.7
         B                          173.7    32.3    134.6     26.4     133.0     16.1     152.6      11.3       116.4      6.8
         Sc                           54.7    6.4    153.4     10.4     143.4     59.2     114.5      10.2       218.8    18.2
         Ti                          4783    408      9701     678     11 535    3804       9440     1094       12076      816
         V                             5.3    1.5     29.7      4.8       25.6    17.2     183.8      20.3       126.9    13.9
         Cr                           18.7    7.7       7.0     3.7        5.0     3.1        3.9      0.7         1.6     0.2
         Co                           30.3    3.0     62.4      3.5       72.9    25.3       26.1      2.3        33.3     2.9
         Ni                            2.7    0.1       1.7     1.1        2.5     1.9        3.1      0.6         2.9     0.3
         Zn                          1040      95     1286     140       1071       48       900        37         923    116
         As                           78.6   37.8      79.7     5.7     465.3     56.9        4.1      0.9          1.9    0.3
         Rb                          2077    153      2307     215       1944      164      2123        85       1064        15
         Sr                         136.0     9.1    182.3     16.1     151.5       3.5    160.1       8.0      129.1      3.6
         Y                            43.1    3.9     87.6      8.2       62.0     7.2      60.4       6.0        76.1     2.5
         Zr                         201.7    20.1    293.5     39.8     214.9     22.8     203.0      15.0       174.1      5.0
         Nb                         202.9    16.6    265.8     38.7     241.5       8.0    162.3      23.0       174.8      8.6
         Mo                         660.1    68.7    187.4     56.8     602.2     51.7     586.7      31.8       560.0    13.1
         Cd                         204.1    17.7    343.3     24.3     131.9       5.6    117.7       8.7      124.3     14.9
         Sb                           66.1   21.4      73.7     7.8     318.8     51.0        2.4      0.9          0.5    0.1
         Cs                         620.6    52.4    680.0     76.8     516.4     47.6     563.6      26.5       286.7    14.6
         Ba                         239.5    15.3    318.5     29.5     268.1       8.4    314.2      17.9       222.6      5.9
         La                         137.6    13.0    168.1     23.8     124.4       9.5    121.0       7.1      106.9      1.0
         Ce                         119.9    10.4    149.5     18.8     121.3       7.2    118.7       4.6      101.4      0.9
         Nd                           76.4    4.9    111.2     12.2       91.8      3.2      91.4      6.6        86.6     1.9
         Sm                         121.1     8.2    191.6     17.6     160.9     12.0     161.9      12.5       175.0      4.7
         Eu                         189.7    10.7    304.1     32.4     268.7     20.5     230.3      15.0       257.6      8.7
         Gd                         121.9    12.4       0.1     0.0     186.7     20.7     176.1      16.9       216.8      7.6
         Dy                         196.2    15.6    388.1     32.9     291.5     37.1     276.3      27.0       360.6    15.8
         Er                         191.7    18.2    384.7     34.9     286.3     35.0     280.2      29.5       354.6    15.0
         Yb                         389.8    29.5    744.8     72.9     497.2     48.4     513.4      47.9       642.6    20.6
         Hf                         943.2    66.8   1244.1    148.6    1010.0     75.8    1026.0      81.3       991.8    11.9
         Ta                         942.7    68.2   1148.5    160.8     945.0     52.3     612.6     137.6       649.3    52.6
         Pb                          3400    224      4315     357       2150      267      2678      106        2361      109
         Th                          3245    276      4415     530       1828    1829       3521      512        3041        71
         U                           2167    506      3225     351       2872      392      2808      131        2710        59
       ∗ SD – standard deviation.

https://doi.org/10.5194/ejm-34-35-2022                                                              Eur. J. Mineral., 34, 35–57, 2022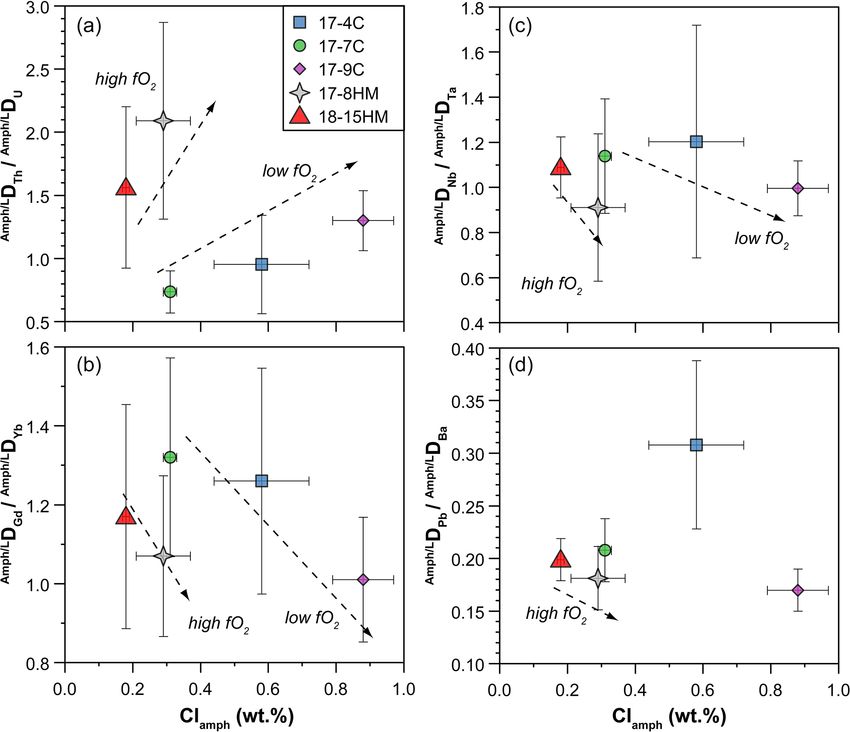
42                                                             E. Cannaò et al.: The influence of oxygen fugacity and chlorine on Amph/L Ds

Table 4. Amphibole compositions (major elements in wt % and trace elements in µg/g).

        Exp no.                        17-4C                      17-7C             17-9C             17-8HM            18-15HM
        n (no. analyses)              29       SD∗                16      SD        24       SD       22       SD         3      SD
        SiO2                      37.95        0.60            39.08    0.37     37.25   0.28       38.74    1.31      39.52    0.63
        TiO2                       5.87        0.64             4.38    0.33      6.83   0.50        6.09    0.77       4.70    0.37
        Al2 O3                    16.38        0.47            15.12    0.24     16.68   0.33       16.28    0.67      15.56    0.08
        FeOTot                    17.49        1.42            14.94    0.37     14.89   0.39       10.02    0.81      10.05    0.55
        MgO                        6.94        1.16             8.97    0.42      8.39   0.38       11.67    0.52      12.29    0.36
        CaO                        9.35        0.23            10.18    0.11      9.18   0.34        9.96    1.57      10.32    0.20
        Na2 O                      2.69        0.12             2.66    0.05      2.67   0.13        2.90    0.26       2.58    0.14
        K2 O                       1.69        0.12             1.61    0.04      1.76   0.12        1.59    0.37       1.62    0.10
        Cl                         0.58        0.14             0.31    0.02      0.88   0.09        0.29    0.08       0.18    0.01
        Total                     98.94                        97.26             98.54              97.53              96.81
        n (no. analyses)                4                          2                 3                  6                 2
        Li                          29.6         3.7             20.2     1.1     36.7      12.4     37.5     9.4       22.1      4.7
        Be                          30.1         3.3             16.8     1.7     17.0       6.6     24.7    22.4       21.8    10.1
        B                           50.7       40.2              15.3     2.3      bdl               48.2    24.8       43.7    15.6
        Sc                        431.5        80.8             607.6   68.0     512.5    83.6      580.9    79.7      964.9    16.5
        Ti                       29 566       6108             20 598    364    37 686   1004      34 934    2500     26 722     435
        V                           52.4       29.9             183.9   64.2      99.3   22.8       688.7    27.6      699.6    42.8
        Cr                          22.0         2.4             13.2     7.6     11.5     3.4       25.7     6.8       58.9     9.6
        Co                        234.5        41.4             220.1     3.9    302.3    13.9      165.2    11.6      142.6      4.0
        Ni                           9.4         1.1             15.5     2.8     13.8     2.9       52.8     9.4       54.0     7.9
        Zn                         1327         170             864.3   66.8     863.9    50.9      917.6    92.0      852.0    86.8
        As                           8.2         3.6              2.3     0.7      4.2     2.9        3.8     2.3        3.8     1.4
        Rb                        145.9        25.7             162.7     6.9    174.4     3.6      153.4    14.3      100.1      0.8
        Sr                        137.4        20.5              67.3     4.2    131.4     8.5      129.7    13.8       69.0      0.2
        Y                         127.2        18.9              82.7     5.3    121.0     5.2      141.0    10.2      104.6    15.1
        Zr                        116.8        35.3              71.2   13.1     101.4     9.8       80.0     8.5       43.5      2.4
        Nb                        148.4        44.8              64.1     4.5    116.2     7.0       80.0    13.5       43.4      2.3
        Mo                        137.7        32.6              19.6     1.8     96.2     3.9       10.9     4.5       12.4     4.4
        Cd                        171.5        19.9             149.2   11.9      98.8   31.4       106.6    27.8      102.9      1.4
        Sb                           1.5        0.1               0.6    0.1       1.6     0.1        0.6     0.1        bdl
        Cs                           1.0         0.2              2.9     0.6      1.9     0.9        1.4     0.6        0.8     0.6
        Ba                          72.4       24.4              64.4     6.2    172.0     7.0      157.6    21.7       71.6     0.3
        La                          30.5         6.5             17.7     1.2     25.1     0.7       29.8     3.7       15.5     3.2
        Ce                          47.7         9.7             29.6     2.6     41.4     1.3       49.3     4.4       26.1     4.7
        Nd                          83.7       14.5              51.4     3.3     74.8     4.8       88.8     7.8       52.6    12.3
        Sm                        241.8        40.1             148.1   10.3     209.4     6.8      253.3    22.7      174.1    25.9
        Eu                        373.4        54.2             224.2   23.1     346.8     9.2      406.5    38.1      271.2    33.2
        Gd                        359.6        50.2             228.4   21.7     325.7    14.6      375.8    35.3      298.4    49.2
        Dy                        616.0        78.6             402.5   32.8     575.7    19.9      659.2    65.5      538.1    84.8
        Er                        590.8        75.2             367.6   25.6     583.3    21.1      666.3    57.8      492.1    72.3
        Yb                        911.8       115.2             570.8   56.3     858.7    23.0     1027.6   100.8      755.1   129.0
        Hf                       1015.0       352.3             512.8   66.1     847.8    75.8      717.4   118.9      489.3    28.0
        Ta                        573.2       163.3             243.0   14.9     456.3    37.9      331.5    56.8      147.9     8.8
        Pb                        315.8        67.4             181.2     3.5    234.0    13.6      242.4    16.3      150.6    11.5
        Th                        145.0        36.4              52.9     5.5    166.7    10.5      136.3    41.5       46.9    16.0
        U                         102.0        21.4              52.7     6.5    107.8    10.7       52.1     7.9       26.7     6.0
      ∗ SD – standard deviation. bdl: below detection limit.

Eur. J. Mineral., 34, 35–57, 2022                                                                   https://doi.org/10.5194/ejm-34-35-2022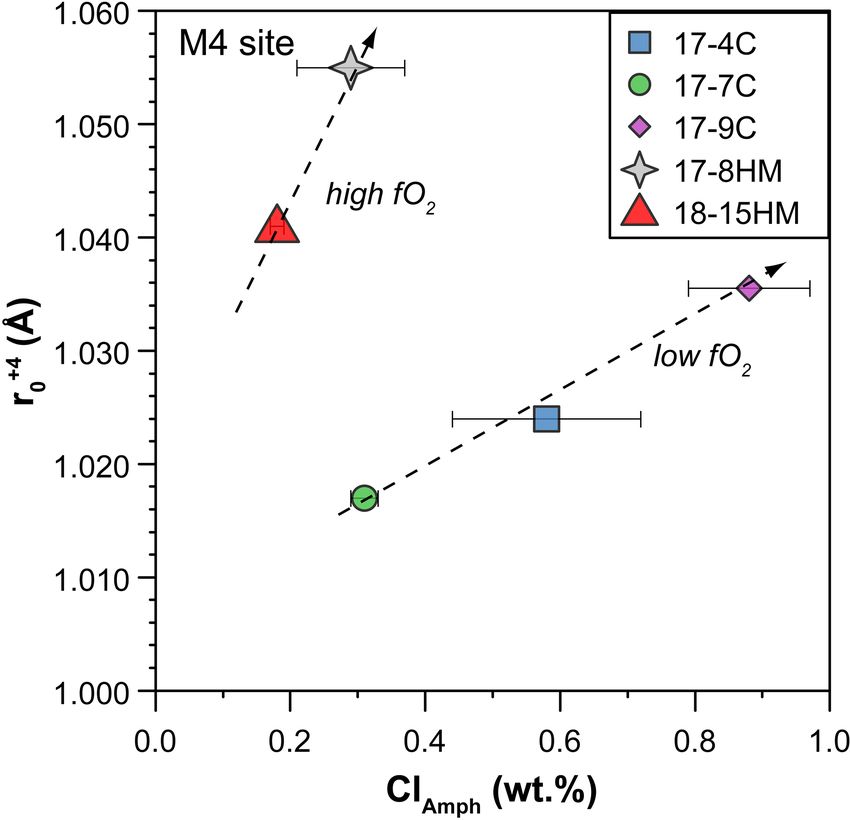
E. Cannaò et al.: The influence of oxygen fugacity and chlorine on Amph/L Ds                                                            43

Figure 3. Major element compositions of glass (a), clinopyroxene (b), and amphibole (c). In (a) glass compositions represent average values
of data normalized to 100 wt %. When not visible, the error bar is smaller than the symbol.

tinuous equilibration with the melt during cooling towards              7C having the lowest Ti (< 0.5 a.p.f.u. – atom per formula
amphibole stability (Figs. 2d and 6). With decreasing T ,               unit). Amphiboles crystallized at high f O2 are characterized
clinopyroxene records SiO2 and MgO contents decreasing                  by Mg# (0.67–0.69) higher than those crystallized at lower
coupled with TiO2 and Al2 O3 contents increasing (Fig. 6).              f O2 (Mg# = 0.41 to 0.53; Fig. 3c). This is likely related to a
Noteworthy, this chemical evolution ends with the complete              higher Fe loss during the experimental run, although the ef-
replacement of clinopyroxene by amphibole as the liquidus               fect of the increase in the f O2 of the experiment cannot be
phase of evolved melts (Fig. 6).                                        completely discharged. On average, amphiboles crystallized
   Amphiboles formulae were calculated in agreement with                at high f O2 have higher Fe3+ / Fetot (on average 0.106 to
the protocol for EMPA data proposed by Li et al. (2020).                0.161) than amphibole crystallized at low f O2 (on average
These authors developed a machine-learning algorithm, prin-             0.056 to 0.082), except for the amphibole in experiment 17-
cipal component regression, based on references datasets, to            7C that shows high Fe3+ (on average 0.116) to compensate
establish a new calculation method for amphibole formula,               for the low Ti (a.p.f.u.) content. The Cl content in our amphi-
which could solve the potential closure and multicollinearity           boles is unusually high, ranging on average from 0.31 wt %
in mineral chemical data and successfully produce a reason-             to 0.88 wt % (i.e., 0.080 to 0.232 a.p.f.u.) with no significant
able cation-/anion-assigned formula from EMPA data. This                correlation with the f O2 conditions of the experimental runs.
method allows us also to calculate the Fe3+ / Fe2+ ratio and            The complete amphibole recalculation data are presented in
H2 O content of amphibole. Amphiboles span in composi-                  the Supplement Table S2.
tion from kaersutite to Fe-kaersutite (Fig. 3c), with the ex-              All amphiboles show minor chemical variations (Fig. 3c),
ception for some pargasites and Fe-pargasite (following the             suggesting that at different experimental conditions its crys-
classification of Leake et al., 1997) from the experiment 17-           tallization occurred very close to the liquidus. Major element

https://doi.org/10.5194/ejm-34-35-2022                                                               Eur. J. Mineral., 34, 35–57, 2022
44                                                 E. Cannaò et al.: The influence of oxygen fugacity and chlorine on Amph/L Ds

Figure 4. SiO2 and MgO vs. CaO and TiO2 contents (in wt %) of
glasses (normalized anhydrous to 100 wt %) after crystallization ex-
periments. The black stars (within the dashed field) show the com-
position of the starting material. The arrows represent the effect of
clinopyroxene plus amphibole crystallization on the composition of
the evolving melts during crystallization experiments. Symbols are
as in Fig. 3.

homogeneity was checked by EMPA traverses within single
amphibole grains (rim–core–rim, e.g., Fig. 6) and by compar-
ing amphibole analyses collected in each run. Little chemical
zoning of amphibole is observed only close to melt inclu-
sions (Fig. 2b; e.g., see blue diamond and triangle in Fig. 6).
These grains were thus excluded from the in situ trace ele-
ment analyses. The REE concentrations in amphibole from
the top to the bottom of the experimental charge show very
little variation in terms of absolute concentrations (Fig. 5c).
Intragrain trace element homogeneity was not evaluated due
to the relatively small dimension of the single amphibole
crystals that did not allow multiple LA-ICP-MS spot anal-
yses. We filtered all the laser analyses on amphibole in order
to exclude any potential contamination from melt inclusions
by inspecting the concentration of highly incompatible ele-
ments such as Cs (e.g., Adam and Green, 2003).
                                                                        Figure 5. Rare Earth element (REE) concentrations (in ppm) of
    In the experimental runs 17-4C and 17-7C, few mica                  glass (a, b) and amphibole (c) in experiments as a function of their
grains occur as small crystals enclosed in amphibole crystals           location in the experimental charges (at top and bottom, a and c)
(Fig. 6), as well as single phase in disequilibrium with the            and the REE composition of the glass close and far with respect to
surrounding glass (only in experiment 17-7C). Their compo-              the amphibole grains (b). These patterns reveal rather homogeneous
sition spans from annite (17-4C) to biotite (17-7C; Supple-             REE concentrations in glass and amphibole from the experimental
ment Table S1).                                                         charges. In (b) and (c) are shown experiments 17-4C and 18-15HM
                                                                        as representative of low and high f O2 conditions, respectively.

Eur. J. Mineral., 34, 35–57, 2022                                                            https://doi.org/10.5194/ejm-34-35-2022
E. Cannaò et al.: The influence of oxygen fugacity and chlorine on Amph/L Ds 45
evidence suggests that amphibole and glass are close to equi-
librium conditions.
5 Trace element partitioning between amphibole and
glass (Amph/L D)
Partition coefficients between amphibole and glass
(Amph/L Ds) reported hereafter are average results for
each experimental run and are shown in Fig. 7. Overall,
patterns of Amph/L Ds mostly match with the range defined
by the Amph/L Ds experimentally derived in mafic and
intermediate systems (Tiepolo et al., 2007, and references
therein; Nandedkar et al., 2016; Fig. 7).
The Amph/L DREE patterns are characterized by a depletion
in light rare Earth elements (LREEs) relative to M-HREEs
(medium and heavy rare Earth elements) that is close to unity
in experiment 17-7C and becomes much more compatible
in the other experiments in which it reaches values up to 3
Figure 6. Major element compositions of amphibole, clinopyrox- (Fig. 7a). The Amph/L DLa / Amph/L DYb is between 0.09 and
ene, and mica in experiment 17-4C. BSE image shows the represen- 0.14 and reveals a LREE–HREE fractionation slightly more
tative texture and the location of the chemical analyses. En: enstatite pronounced than that observed in the literature. A slight neg-
component in clinopyroxene (expressed in vol %). ative Eu anomaly is appreciable in all the experimental runs,
although it is more pronounced in those performed at low
f O2 conditions (Fig. 7a).
4 Attainment of equilibrium The light lithophile elements (LLEs – Li, Be, B; Fig. 7b)
have similar incompatible behavior in amphibole, and their
Amph/L D varies from 0.114 to 0.375. Remarkably, our results
The attainment of the equilibrium between amphibole and
expand to higher values the upper limit of the literature data.
melt is the fundamental requisite for experimentally de-
The large ion lithophile elements (LILEs – Rb, Sr, Cs, Ba;
riving the Amph/L Ds. Due to the complex chemical sys-
Fig. 7c) are moderately (Sr and Ba) to highly (Rb and Cs) in-
tem, the demonstration of equilibrium through reversal ex-
compatible. Cesium is the most incompatible with Amph/L D
periments is difficult to achieve. The approach to equilib-
between 0.002 and 0.004. The Amph/L DRb ranges between
rium was thus carefully assessed based on the textural re-
0.070 and 0.094, whereas Amph/L DSr and Amph/L DBa range
lationship between amphibole crystals and glass (Fig. 2),
from 0.369 to 1.010 and from 0.202 to 0.642, respectively.
as well as by major and trace element chemical analyses
According to Dalpé and Baker (2000), at comparable T and
(Figs. 3, 4, and 6). The growth of amphibole crystals oc-
SiO2 in the coexisting liquid, the Amph/L DBa of experiments
curs at the expense of prior clinopyroxene or as a single
performed at high f O2 is higher compared with those deter-
crystal crystallized from the melt. In both cases, amphi-
mined in experiments performed at low f O2 (e.g., 17-4C vs.
boles display euhedral habitus, suggesting conditions close
17-8HM). Partitioning data for LILEs are comparable with
to equilibrium with the surrounding glass (Fig. 5). The at-
those reported in the literature (Fig. 7c).
tainment of equilibrium between amphibole and glass is sup-
The high-field strength elements (HFSEs – Nb, Ta, Zr, Hf,
ported by the relatively homogeneity of major element com-
Ti; Fig. 7d) are incompatible in amphibole with the excep-
position from all experimental runs (Figs. 3 and 4). Fur-
tion of Ti that is moderately compatible (Amph/L DTi = 2.1–
ther support to the attainment of equilibrium is suggested
6.2). The Amph/L Ds values range from 0.241 to 0.731 for
by consistent trends in the Fe–Mg partitioning between liq-
Nb, from 0.212 to 0.608 for Ta, from 0.243 to 0.579 for Zr,
uids and amphiboles (see Supplement Fig. S2) converging
and from 0.412 to 1.076 for Hf. The Amph/L DNb / Amph/L DTa
at the (FeO/MgO)amph / (FeO/MgO)glass ratio of ∼ 0.35, ex-
ratio ranges between 0.91 and 1.20 and is in the upper
cept for 18-15HM. The latter is slightly higher (0.42) and is
range of ratios reported in the literature (e.g., Tiepolo et al.,
interpreted as being related to a higher amount of Fe loss in
2007). Noticeably, new data confirm that in Fe-rich amphi-
the Pt capsule likely due to the different experimental tech-
boles (e.g., 17-4C vs. 17-7C) Nb can be more compatible
nique with respect to experiment 17-8HM performed at com-
than Ta as already suggested by Tiepolo et al. (2000b). The
parable conditions (see above). No significant zoning or het- Amph/L D / Amph/L D ratio is in the lower range of the lit-
Zr Hf
erogeneous REE trace element distribution is apparent in the
erature data with values from 0.51 to 0.59.
key sites of the capsule (i.e., top vs. bottom of the capsule;
close to vs. far from phase boundaries; Fig. 5). All the above
https://doi.org/10.5194/ejm-34-35-2022 Eur. J. Mineral., 34, 35–57, 202246 E. Cannaò et al.: The influence of oxygen fugacity and chlorine on Amph/L Ds Figure 7. Amphibole–liquid partition coefficients (Amph/L D) for different element groups: (a) REEs, (b) light lithophile elements (LLEs), (c) large ion lithophile elements (LILEs), (d) high field strength elements (HFSEs), (e) Pb and actinide, (f) transition metals, and (g) fluid- mobile elements (FMEs: As, Sb). Gray fields represent a compilation of data from the literature as previously documented by Tiepolo et al. (2007, and references therein) and Nandenkar et al. (2016). Black symbols in (g) refer to Amph/L D for As and Sb from Adam and Green (2006) performed at different P − T conditions (see legend) and are shown for comparison. When not visible, the error bar is smaller than the symbol. Eur. J. Mineral., 34, 35–57, 2022 https://doi.org/10.5194/ejm-34-35-2022
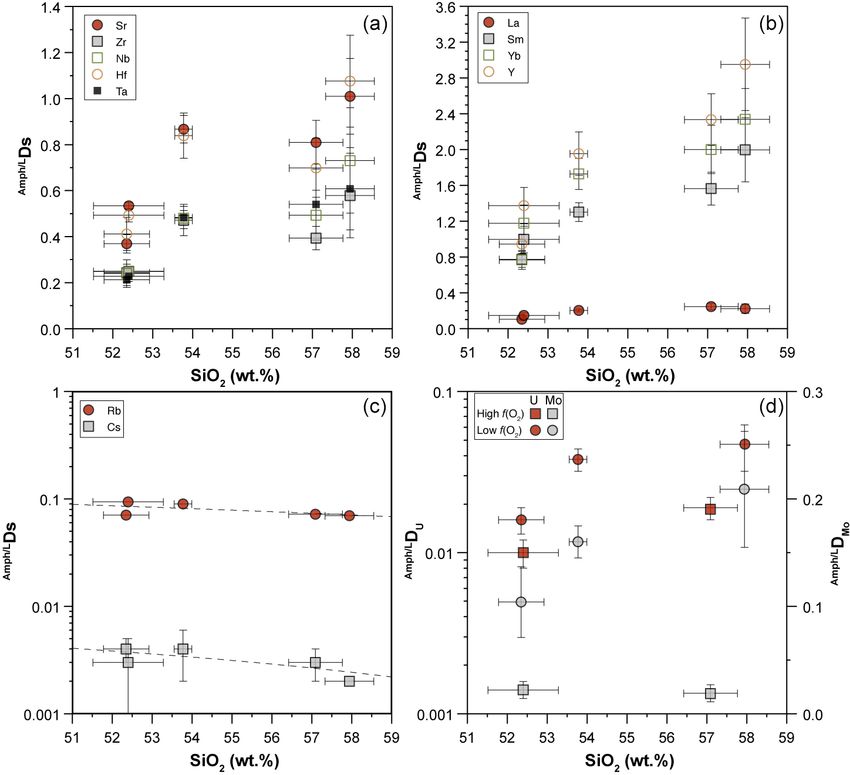
E. Cannaò et al.: The influence of oxygen fugacity and chlorine on Amph/L Ds                                                   47

   Lead and actinides (Th, U) are strongly incompatible,          al., 2017), with the new Amph/L DCl falling at the upper limit
ranging from 0.042 to 0.109 for Pb, 0.012 to 0.091 for Th,        of the literature data (ranging from 0.03 to 0.62; median at
and 0.016 to 0.047 for U (Fig. 7e). All values fall within        0.26).
the field of the literature data. The Amph/L DTh / Amph/L DU is
highly variable and spans between 0.734 and 2.086 with the
lowest values pertaining to experiments carried out at low        6     Discussion
f O2 .
   The Amph/L D of transition metals (Sc, V, Cr, Co, Zn, Mo,      Trace element partitioning between minerals and liquid is a
Cd) are reported in Fig. 7f. Scandium, V, Cr, and Co are mod-     complex function of the phase compositions, as well as the
erately to highly compatible in amphibole. The Amph/L D val-      intensive parameters of the system (i.e., P − T conditions).
ues for Zn and Cd are close to unity and range from 0.672         Melt polymerization has been shown to strongly influence
to 1.276 and from 0.435 to 0.906, respectively. When com-         Amph/L Ds (Tiepolo et al., 2000a). In addition, the crystal
pared to literature values, Amph/L D for Sc and V are in the      structure filters cations based on the affinity in charge and
middle of the range variation, whereas Amph/L DCr is signifi-     ionic radius with the major cations of each crystal site. The
cantly lower for experiments performed at low f O2 (Fig. 7f).     average dimension of the structural site, which can be consid-
The Amph/L DZn,Cd are close to 1 and comparable with data         ered equivalent to the ideal radius (r0 ) parameter of Blundy
reported by Adam and Green (2003). Molybdenum is incom-           and Wood (1994), rules the uptake of trace elements with
patible in all the experiments (from 0.209 to 0.104), espe-       the same valence. Variations in the major element site occu-
cially in those at high f O2 (close to 0.020), and these find-    pancy can induce modifications of r0 and, in turn, the relative
ing are in agreement with the previous work of Adam and           compatibility of trace elements with a different ionic radius
Green (2003) and the high-T experiments of Nanderdkar et          entering the same site (Tiepolo et al., 2000a). Modifications
al. (2016).                                                       of the formal charge of the site have consequences for the
   Amphibole–liquid partition coefficients for As and Sb are      compatibility of cations favoring the isovalent substitutions
reported in Fig. 7g. They are moderately to strongly incom-       (Blundy and Wood, 1994).
patible in experiments at low f O2 and show Amph/L D values
ranging from 0.009 to 0.105 and from 0.005 to 0.023, re-          6.1    The effect of melt composition on Amph/L Ds
spectively. The Amph/L DAs / Amph/L DSb ratio is above unity,
decreasing from a maximum of 4.62 for experiment 17-4C            Because chemistry and polymerization of melt are parame-
(performed at 1015 ◦ C) down to 1.76 for experiment 17-9C         ters that mostly influence the Amph/L Ds (e.g., Tiepolo et al.,
(performed at 1040 ◦ C; Table 5). The available data from the     2007, and references therein), the low-charge trace elements
literature are limited to the work of Adam and Green (2006)       with a relatively large ionic radius (e.g., Rb1+ ) have affinity
reporting incompatible behaviors for As and Sb, in agree-         with network-forming cations and their compatibility with
ment with our data at low f O2 . Because both As and Sb may       amphibole is expected to decrease as the melt becomes SiO2 -
form alloys with Pt (see Supplement Fig. S1), the estima-         and alkali-rich. The opposite behavior is observed for trace
tion of their Amph/L Ds at higher f O2 condition is challenging   elements with strong network modifier behavior (low ionic
and is dependent on the amount of As and Sb escaping from         radius and high charge, e.g., Nb5+ ).
the system during the experimental runs. Considering that            The compositional variations in the melt in equilibrium
As and Sb concentrations of the glass in equilibrium with the     with the experimental amphibole of this study are rather nar-
amphibole are very low (below 5 and 3 ppm, respectively;          row. The SiO2 content of the glass spans from 52.3 wt % to
see Table 3) compared to their concentrations in the starting     57.9 wt %, and Al2 O3 and alkali abundances show limited
materials (Table 1), we conclude that the formation of As–        variations (Table 3; Fig. 3a). However, we observed the most
Sb alloy with the Pt capsule during the experimental run may      significant difference in the trace element partitioning as a
have subtracted these elements from the silicate melt and in      function of SiO2 content of equilibrium melt. The Amph/L D
turn increased their partition coefficients. Therefore, the As    increases up to 3 times with the increasing of the SiO2
and Sb concentrations of both amphibole and glass from ex-        content in the melt for those elements with an affinity for
periments performed at high f O2 conditions cannot be used        network-modifying cations such as Sr and HFSEs (Fig. 8a),
to constrain their Amph/L Ds, and further experimental work       as well as Y and REEs (Fig. 8b). A decrease in compati-
is required.                                                      bility is reported for those elements having affinity with the
   Chlorine data from EMPA were used to calculate the             network forming cations such as Rb and Cs (Fig. 8c). The
Amph/L D of Cl, which results in a variation between 0.24 and     influence of melt composition on the Amph/L D is not easily
0.44 (Table 5). No apparent relation with the melt composi-       evaluable for elements with multiple valence (see next sec-
tion nor with the f O2 conditions of the experimental run is      tion). However, if we distinguish low and high f O2 exper-
appreciable. The obtained data confirm the incompatibility        iments, the dependence of Amph/L D on melt composition is
of Cl in Ca-amphibole, as reported in previous works (Dalou       more evident. This is the case, for example, of Mo and U
et al., 2014; Van Den Bleaker and Koga, 2015; Bénard et           that at low f O2 increase their compatibility for amphibole

https://doi.org/10.5194/ejm-34-35-2022                                                       Eur. J. Mineral., 34, 35–57, 2022
48                                                              E. Cannaò et al.: The influence of oxygen fugacity and chlorine on Amph/L Ds

Table 5. Amphibole–glass partition coefficients calculated from LA-ICP-MS analyses of run products.

                      17-4C                            17-7C                             17-9C                           17-8HM                 18-15HM
             Amph/glass          SD∗          Amph/glass            SD          Amph/glass           SD          Amph/glass            SD   Amph/glass     SD
     Li             0.257      0.038                  0.141      0.012                 0.337      0.117                  0.314      0.079        0.257   0.055
     Be             0.360      0.083                  0.210      0.052                 0.235      0.096                  0.306      0.280        0.347   0.167
     B              0.292      0.189                  0.114      0.028                    nd                             0.316      0.164        0.375   0.143
     Cl             0.439      0.107                  0.248      0.017                 0.368      0.040                  0.291      0.079        0.244   0.016
     Sc             7.887      1.740                  3.961      0.519                 3.575      1.588                  5.072      0.830        4.410   0.374
     Ti             6.182      1.382                  2.123      0.153                 3.267      1.081                  3.701      0.504        2.213   0.154
     V              9.935      6.352                  6.192      2.381                 3.882      2.757                  3.748      0.441        5.513   0.691
     Cr             1.174      0.498                  1.871      1.450                 2.286      1.051                  6.636      0.957       37.038   7.035
     Co             7.729      1.565                  3.527      0.207                 4.144      1.452                  6.339      0.720        4.285   0.397
     Ni             3.560      1.423                  9.383      6.302                 5.599      4.527                 16.919      4.474       18.555   3.369
     Zn             1.276      0.201                  0.672      0.090                 0.806      0.060                  1.020      0.110        0.923   0.149
     As             0.105      0.068                  0.028      0.009                 0.009      0.006                  0.932      0.603        2.039   0.723
     Rb             0.070      0.013                  0.071      0.007                 0.090      0.008                  0.072      0.007        0.094   0.002
     Sr             1.010      0.165                  0.369      0.040                 0.867      0.060                  0.810      0.095        0.534   0.015
     Y              2.953      0.516                  0.945      0.107                 1.953      0.243                  2.334      0.288        1.374   0.203
     Zr             0.579      0.184                  0.243      0.056                 0.472      0.068                  0.394      0.051        0.250   0.015
     Nb             0.731      0.229                  0.241      0.039                 0.481      0.033                  0.493      0.109        0.248   0.018
     Mo             0.209      0.054                  0.104      0.033                 0.160      0.015                  0.019      0.008        0.022   0.008
     Cd             0.841      0.122                  0.435      0.046                 0.749      0.240                  0.906      0.245        0.828   0.100
     Sb             0.023      0.007                  0.008      0.001                 0.005      0.001                  0.265      0.101           nd
     Cs             0.002      0.000                  0.004      0.001                 0.004      0.002                  0.003      0.001        0.003   0.002
     Ba             0.302      0.104                  0.202      0.027                 0.642      0.033                  0.502      0.075        0.322   0.009
     La             0.222      0.052                  0.105      0.016                 0.201      0.016                  0.246      0.034        0.145   0.030
     Ce             0.398      0.088                  0.198      0.030                 0.341      0.023                  0.415      0.040        0.258   0.047
     Nd             1.095      0.203                  0.463      0.059                 0.815      0.060                  0.971      0.110        0.607   0.143
     Sm             1.997      0.358                  0.773      0.089                 1.301      0.106                  1.564      0.185        0.995   0.150
     Eu             1.968      0.307                  0.737      0.109                 1.291      0.104                  1.765      0.202        1.053   0.134
     Gd             2.950      0.510                  1.013      0.132                 1.745      0.209                  2.135      0.287        1.376   0.232
     Dy             3.140      0.472                  1.037      0.122                 1.975      0.261                  2.386      0.333        1.492   0.244
     Er             3.081      0.489                  0.956      0.109                 2.038      0.260                  2.378      0.324        1.388   0.212
     Yb             2.339      0.345                  0.766      0.106                 1.727      0.174                  2.001      0.271        1.175   0.204
     Hf             1.076      0.381                  0.412      0.072                 0.839      0.098                  0.699      0.128        0.493   0.029
     Ta             0.608      0.179                  0.212      0.032                 0.483      0.048                  0.541      0.153        0.228   0.023
     Pb             0.093      0.021                  0.042      0.004                 0.109      0.015                  0.091      0.007        0.064   0.006
     Th             0.045      0.012                  0.012      0.002                 0.049      0.003                  0.039      0.013        0.015   0.005
     U              0.047      0.015                  0.016      0.003                 0.038      0.006                  0.019      0.003        0.010   0.002

∗ SD – standard deviation. nd – not determined. Amph/L D in italics (As and Sb in HM experiments) are not considered reliable (see text).

Table 6. Lattice parameters calculated from partition coefficient data for the M(1-3) site in amphibole for experiments with comparable SiO2
but different f O2 .

                                                        Valence          D0      r0 (Å)       E0 (Kbar)        Considered elements
                                        17-4C                 +3      38.21       0.692           21 657       V, Sc, As
                                                              +4       8.49       0.636           15 472       Ti, Hf, Zr
                                                              +5       0.79       0.657           49 802       Nb, Ta, Sb, Mo
                                        17-8HM                +3      35.00       0.696           32 145       V, Sc
                                                              +4       4.87       0.635           14 592       Ti, Hf, Zr
                                                              +5       0.54       0.637           45 493       Nb, Ta

Eur. J. Mineral., 34, 35–57, 2022                                                                                       https://doi.org/10.5194/ejm-34-35-2022
E. Cannaò et al.: The influence of oxygen fugacity and chlorine on Amph/L Ds 49
as the SiO2 content in the melt increases. At high f O2 , given involving either Ti4+ or Fe3+ :
the extremely high incompatibility of these elements (par-
ticularly for Mo), the increase in Amph/L D at the increasing
M(1)
Ti4+
1
O(3) 2− M(1)
O2 (Mg, Fe)2+
−1
O(3)
(OH)−
−2 , (1)
SiO2 is less evident (Fig. 8d). M(1,3)
(Fe, Mn)3+
1
O(3) 2− M(1,3)
O1 (Fe, Mn)2+
−1
O(3)
(OH)−
−1 . (2)
High Fe3+ / Fetot ratios will favor the second crystal chemi-
6.2 The effect of f O2 on Amph/L Ds cal mechanism with respect to that involving Ti in the M(1)
site with the consequence of a lower compatibility of Ti in the
amphibole structure. An accurate estimate of the Fe3+ / Fetot
The f O2 variation may affect trace element partitioning be- in the system is not straightforward. In particular, given the
tween minerals and melt in different ways. First, f O2 may large number of variables in the amphibole structure such
induce variations in the oxidation state of a trace element, as the effective water content or the A site occupancy, the
thus modifying the crystal chemical mechanism responsible Fe3+ / Fetot ratio cannot be inferred from the stoichiometry.
for its incorporation. Secondly, it may affect the oxidation However, amphiboles synthetized at higher f O2 possess, on
state of a major elements (e.g., Fe). This leads to a variation average, higher Fe3+ / Fetot (0.161 in experiment 18-15HM).
in the formal charge of the crystal site with implications in We thus suggest that the decrease in the Ti compatibility at
the capability to host a given trace element. high f O2 conditions is likely related to a competition with
In order to isolate, as much as possible, the effect of f O2 Fe3+ in the balance of the oxo-component with the conse-
variation, we compared in Fig. 9 the Amph/L Ds for amphi- quence that mechanism 2 is thus preferred in high-T amphi-
boles, distinguishing those equilibrated with melt at low and boles. Noticeably, the decrease in Ti compatibility is coupled
high SiO2 and different f O2 conditions (see also Fig. 8d). A with a decrease in the Amph/L D of other high charge cations
common feature is that the Amph/L D of Ni, Ti, V, Mo, and U such as Zr–Hf and Nb–Ta, which substitute for Ti in the am-
vary significantly within the range of investigated f O2 . At phibole structure (Tiepolo et al., 2011). This is in agreement
nearly constant melt composition, the compatibility of Ti, V, with the evidence that Nb and Ta contribute in the balance
Mo, and U in amphibole decreases under high f O2 , whereas of the oxo-component (Tiepolo et al., 2000b). We cannot ex-
that of Ni is enhanced (Fig. 9). clude, however, that the higher formal charge of the octahe-
In order to describe the incorporation of trace elements in dral sites related to the higher proportion of Fe3+ hampers
the amphibole structure, we follow the lattice-strain model of the incorporation of other high charge cations.
Blundy and Wood (1994). Partition coefficients of elements Many transition metals (V, Co, Ni, and Mo) are charac-
with the same charge and ionic radius entering in the same terized by multiple oxidation states, and, thus, the changes
crystal site lie on parabolas described by an equation with in f O2 conditions induced in the system may have in-
three variables – D0 , r0 , and E – that are the partition co- fluenced their partitioning. They are incorporated and dis-
efficient, the ionic radius of the ideal cation of the crystal- tributed among the three octahedral sites of amphiboles M(1-
lographic site (which does not require work for substitution), 2-3); for this reason, robust conclusions on their oxida-
and the Young’s modulus of the site, respectively. We applied tion state at the investigated conditions is not straightfor-
the calculation to amphiboles from experiments 17-4C and ward. Results show that no significant difference between
17-8HM for which the glasses in equilibrium with amphibole Amph/L D and Amph/L D
V Co at low and high f O2 conditions
show comparable SiO2 contents (Table 3). The results for occurs (Fig. 7f). Vanadium compatibility is comparable to
the M(1-3) site are reported in Table 6 and in Fig. 10. Ideal that of Sc3+ (Fig. 7f), and, thus, we suggest that V3+ is
r0 , D0 , and E were calculated by least-squares fitting of the the dominant form in all experiments (Fig. 10). However,
measured partition coefficients to the theoretical curve given a slight decrease in the Amph/L DV in the experiments per-
by the equation of Blundy and Wood (1994). Although trace formed at higher f O2 conditions is observed (Fig. 9). Our
elements are generally incorporated and distributed among experiments cannot constrain the oxidation state of Co. The
the three octahedral sites of amphiboles M(1-2-3), no at- similarity of the obtained Amph/L DCo at low f O2 with those
tempt was made to either take account for or model the split determined by Adam and Green (2006) at comparable condi-
site behavior (i.e., M(1) vs. M(2) vs. M(3)). tions suggests that Co2+ is dominant. The absence of a sig-
Titanium is assumed to be 4+ and is not expected to nificant change in Co compatibility with the increased f O2
vary the oxidation state under the investigated range of f O2 . (Fig. 7f) indicates that the transition from 2+ to 3+ has not
Variations in the Amph/L D from high to low f O2 conditions occurred. According to Dingwell et al. (1994), Ni2+ should
(Fig. 9) are thus not directly related to the Ti oxidation state be dominant in the range of log f O2 between −13.5 and
but likely to changes in the crystal chemical mechanism of −8.5. Our experiments at low f O2 conditions are within this
its charge balance. High-T amphiboles are commonly char- range (Fig. 1c), and we can, thus, reasonably assume that in
acterized by an oxo-component at the O(3) site that, accord- amphibole Ni2+ is dominant. In the experiments performed
ing to Oberti et al. (2007) and Popp et al. (1995, 2006), can at higher f O2 (up to log f O2 = −6.5; Fig. 1c), Ni compat-
be balanced by the following crystal chemical mechanisms ibility in amphibole significantly increases (up to 5 times;
https://doi.org/10.5194/ejm-34-35-2022 Eur. J. Mineral., 34, 35–57, 2022You can also read