Assessing climate change impacts on live fuel moisture and wildfire risk using a hydrodynamic vegetation model
←
→
Page content transcription
If your browser does not render page correctly, please read the page content below
Biogeosciences, 18, 4005–4020, 2021
https://doi.org/10.5194/bg-18-4005-2021
© Author(s) 2021. This work is distributed under
the Creative Commons Attribution 4.0 License.

Assessing climate change impacts on live fuel moisture and wildfire
risk using a hydrodynamic vegetation model
Wu Ma1 , Lu Zhai2 , Alexandria Pivovaroff3 , Jacquelyn Shuman4 , Polly Buotte5 , Junyan Ding6 ,
Bradley Christoffersen7 , Ryan Knox6 , Max Moritz8 , Rosie A. Fisher9 , Charles D. Koven6 , Lara Kueppers10 , and
Chonggang Xu1
1 Earthand Environmental Sciences Division, Los Alamos National Laboratory, Los Alamos, NM, United States
2 Department  of Natural Resource Ecology and Management, Oklahoma State University, Stillwater, OK, United States
3 Atmospheric Science and Global Change Division, Pacific Northwest National Laboratory, Richland, WA, United States
4 National Center for Atmospheric Research, Climate and Global Dynamics, Terrestrial Sciences Section,

Boulder, CO, United States
5 Energy and Resources Group, University of California, Berkeley, CA, United States
6 Climate and Ecosystem Sciences Division, Lawrence Berkeley National Laboratory, Berkeley, CA, United States
7 Department of Biology, University of Texas Rio Grande Valley, Edinburg, TX, United States
8 UC ANR Cooperative Extension, Bren School of Environmental Science & Management,

University of California, Santa Barbara, CA, United States
9 Centre Européen de Recherche et de Formation Avancée en Calcul Scientifique, Toulouse, France
10 Energy and Resources Group, University of California, Berkeley, and Lawrence Berkeley National Laboratory,

Berkeley, CA, United States

Correspondence: Chonggang Xu (cxu@lanl.gov)

Received: 18 November 2020 – Discussion started: 25 November 2020
Revised: 20 May 2021 – Accepted: 14 June 2021 – Published: 6 July 2021

Abstract. Live fuel moisture content (LFMC) plays a critical        14.8 % increase) with LFMC below 79 % between the histor-
role in wildfire dynamics, but little is known about responses      ical (1960–1999) and future (2080–2099) periods, implying
of LFMC to multivariate climate change, e.g., warming tem-          an increase in wildfire danger for chaparral shrubs in south-
perature, CO2 fertilization, and altered precipitation patterns,    ern California. Under the high greenhouse gas emission sce-
leading to a limited prediction ability of future wildfire risks.   nario during the dry season, we find that the future LFMC
Here, we use a hydrodynamic demographic vegetation model            reductions mainly result from a warming temperature, which
to estimate LFMC dynamics of chaparral shrubs, a dominant           leads to 9.1 %–18.6 % reduction in LFMC. Lower precipita-
vegetation type in fire-prone southern California. We param-        tion in the spring leads to a 6.3 %–8.1 % reduction in LFMC.
eterize the model based on observed shrub allometry and hy-         The combined impacts of warming and precipitation change
draulic traits and evaluate the model’s accuracy through com-       on fire season length are equal to the additive impacts of
parisons between observed and simulated LFMC of three               warming and precipitation change individually. Our results
plant functional types (PFTs) under current climate condi-          show that the CO2 fertilization will mitigate fire risk by caus-
tions. Moreover, we estimate the number of days per year of         ing a 3.5 %–4.8 % increase in LFMC. Our results suggest that
LFMC below 79 % (which is a critical threshold for wild-            multivariate climate change could cause a significant net re-
fire danger rating of southern California chaparral shrubs)         duction in LFMC and thus exacerbate future wildfire danger
from 1960 to 2099 for each PFT and compare the number               in chaparral shrub systems.
of days below the threshold for medium and high green-
house gas emission scenarios (RCP4.5 and 8.5). We find that
climate change could lead to more days per year (5.2 %–

Published by Copernicus Publications on behalf of the European Geosciences Union.
4006                                  W. Ma et al.: Assessing climate change impacts on live fuel moisture and wildfire risk

1   Introduction                                                    of different climate variables to future LFMC dynamics.
                                                                    On one hand, warming could contribute to a higher atmo-
Historical warming and changes in precipitation have already        spheric demand and higher evapotranspiration (Rind et al.,
impacted wildfires at a global scale (e.g., Stocks et al., 1998;    1990) and thus lead to a lower LFMC. On the other hand,
Gillett et al., 2004; Westerling et al., 2003, 2006) and it is      higher CO2 concentration will decrease stomatal conduc-
expected that accelerating future warming will continue to          tance (Wullschleger et al., 2002) and plant water loss and
substantially affect global wildfires (e.g., Flannigan et al.,      thus lead to a higher LFMC. The impacts of CO2 and warm-
2009; Liu et al., 2010; Moritz et al., 2012). So far, prior stud-   ing could be complicated by local changes in precipitation
ies have mainly focused on the impacts of dead fuel mois-           patterns and humidity (Mikkelsen et al., 2008).
ture, fuel loads, and weather conditions on wildfires. Limited         The sensitivity of LFMC to climate change is likely to be
studies have applied proxies of live fuel moisture in global        affected by plant hydraulic traits (the plant properties that
fire models. For example, dead fuel moisture is found to be         regulate water transport and storage within plant tissues),
related to fire ignition and fire spread potential (or potential    which affect plant water regulation (Wu et al., 2020). Vari-
area burned) (Aguado et al., 2007), specific weather condi-         ations in hydraulic traits reflect contrasting plant drought
tions such as increased vapor pressure deficit (Williams et al.,    adaptation strategies when responding to dry conditions. Two
2019) can lead to a vast increase in fire activity (Goss et al.,    contrasting overall strategies are: (1) water stress avoiders
2020), and wildfire fuel loads are projected to increase under      and (2) water stress tolerators (Tobin et al., 1999; Wei et al.,
climate change (Matthews et al., 2012; Clarke et al., 2016).        2019). The “avoiders” are generally characterized by a more
In global fire models, studies have used proxies of live fuel       conservative hydraulic strategy under water stress by closing
moisture (Bistinas et al., 2014; Kelley et al., 2019) as well       their stomata early, dropping leaves, or accessing deep water
as explicit representation of live fuels (Hantson et al., 2016;     to avoid more negative water potentials and therefore xylem
Rabin et al., 2017). While previous studies provide great in-       cavitation. Meanwhile, the “tolerators” typically build xylem
sights into fire risks with changes in climate, dead fuel mois-     and leaves that are more resistant to cavitation so that they
ture, fuel loads, and representation of live fuel moisture, there   can tolerate more negative water potential and continue to
is still limited understanding of how climate change influ-         conduct photosynthesis under water stress. Therefore, com-
ences live fuel moisture content (LFMC) and the consequent          pared with the tolerators, the avoiders normally have a lower
wildfire risks. This is particularly true for the combined im-      sapwood density and higher plant water storage capacity in
pacts of warming temperature, altered precipitation, and in-        their tissues to avoid cavitation (Meinzer et al., 2003, 2009;
creasing CO2 fertilization (Chuvieco et al., 2004; Pellizzaro       Pineda-Garcia et al., 2013). Because the avoiders rely on wa-
et al., 2007; Caccamo et al., 2012a, b; Williams et al., 2019;      ter storage capacity as one way to avoid cavitation, thereby
Goss et al., 2020).                                                 maintaining a relatively high LFMC, and because water loss
   A measure of water content within living plant tissue in         from storage should increase with warming, LFMC could be
relation to their dry weight, LFMC has been found to be             more sensitive to climate change in avoiders relative to toler-
one of the most critical factors influencing combustion, fire       ators.
spread, and fire consumption (e.g., Agee et al., 2002; Zarco-          While over half of terrestrial landscapes on Earth are con-
Tejada et al., 2003; Bilgili and Saglam, 2003; Yebra et al.,        sidered fire-prone (Krawchuk et al., 2009), Mediterranean-
2008; Dennison et al., 2008; Anderson and Anderson, 2010;           type climate regions are routinely impacted by fire, often on
Keeley et al., 2011). This is because a low LFMC leads              an annual basis. This is partly because Mediterranean cli-
to increased flammability and a higher likelihood of igni-          mate regions are characterized by winter rains followed by
tion (Dimitrakopoulos and Papaioannou, 2001). For instance,         an annual dry season, when little to no rainfall occurs for
LFMC was found to be a significant factor contributing to the       several months. Multiday periods of extreme high tempera-
occurrence of wildfires in Australia (Plucinski, 2003; Nolan        tures as well as katabatic hot, dry, and intense winds often
et al., 2016; Yebra et al., 2018; Rossa and Fernandes, 2018;        punctuate the annual drought, leading to some of the worst
Pimont et al., 2019), Spain (Chuvieco et al., 2009), and Cali-      fire weather in the world (Schroeder et al., 1964). This can
fornia (Santa Monica Mountains; Dennison et al., 2008; Den-         result in wildfires that are large, high intensity, and stand re-
nison and Moritz, 2009; Pivovaroff et al., 2019). Dennison          placing (Keeley, 1995; Keeley and Zedler, 2009; Balch et al.,
and Moritz (2009) found strong evidence of a LFMC thresh-           2017). Globally, Mediterranean climate regions are charac-
old (79 %) for southern California chaparral shrubs, which          terized by evergreen sclerophyllous-leaved shrublands. The
may determine when large fires can occur in this region.            Mediterranean climate region in California is dominated by
   Vegetation moisture content is dependent on both eco-            chaparral, which is adapted to the periodic fire regime in Cal-
physiological characteristics of the species and environmen-        ifornia (Venturas et al., 2016). Previous studies have pro-
tal conditions, including both climatic variables and soil wa-      posed a variety of relationships between chaparral LFMC
ter availability (Rothermel, 1972; Castro et al., 2003; Pel-        and fire danger in southern California (Dennison et al., 2008;
lizzaro et al., 2007; Pivovaroff et al., 2019; Nolan et al.,        Dennison and Moritz, 2009), but less is known about how cli-
2020). So far, little is known about the relative importance        mate changes could alter LFMC and fire danger. In chaparral,

Biogeosciences, 18, 4005–4020, 2021                                                    https://doi.org/10.5194/bg-18-4005-2021
W. Ma et al.: Assessing climate change impacts on live fuel moisture and wildfire risk 4007
LFMC is usually high during the winter and spring (wet sea- hydraulic strategies (“avoiders”) will be more vulnerable to
son) and then gradually declines during the dry season (sum- warming (H4 ).
mer and fall), which leads to a typical fire season approxi-
mately six months long in southern California (Pivovaroff et
al., 2019). One key risk is that severe drought conditions are 2 Materials and methods
becoming exacerbated under climate change, which might
lead to the occurrence of larger and higher-intensity fires To understand climate change impacts on LFMC for the cha-
in chaparral (Dennison et al., 2008; Dennison and Moritz, parral ecosystem, we applied the Functionally Assembled
2009). Terrestrial Simulator (FATES; Fisher et al., 2015; Massoud
There is a long history of wildfire modeling, with three et al., 2019; Koven et al., 2020) coupled with a hydrody-
types of models: (1) fine-scale fire behavior models (e.g., namic vegetation module (FATES-HYDRO; Christoffersen
FIRETEC by Linn et al., 2002), (2) landscape-scale fire dis- et al., 2016) in the Santa Monica Mountains in California. We
turbance models (e.g., LANDIS-II by Sturtevant et al., 2009), validated the model using the observed LFMC for three cha-
and (3) global-scale fire dynamics models (e.g., Hantson et parral shrub plant functional types (PFTs). Then, we applied
al., 2016; Rabin et al., 2017; SPITFIRE by Thonicke et al., FATES-HYDRO to estimate long-term dynamics of leaf wa-
2010). While these models focus on simulation at different ter content (LWC) during 1960–2099 for each PFT using
scales, fire measures of the simulation are mainly calculated downscaled Earth system model (ESM) climate scenarios.
from climate and dead fuel moisture and currently lack pre- We converted simulated LWC to LFMC within leaves and
diction of LFMC dynamics. One key limitation is that most shoots. Based on the simulated LFMC, we evaluated wild-
previous models have not yet considered plant hydrodynam- fire danger based on the number of days per year of LFMC
ics (Holm et al., 2012; Xu et al., 2013; Seiler et al., 2014), below the critical value of 79 % from 1960 to 2099 for each
which is integral to LFMC prediction. Recently, there have PFT under RCP4.5 and 8.5. Finally, we assessed the relative
been important improvements to global dynamic and demo- importance of changes in individual and combined climate
graphic vegetation models by incorporating plant hydrody- variables including CO2 , temperature, and precipitation and
namics (McDowell et al., 2013; Xu et al., 2016; Fisher et al., tested the corresponding hypotheses.
2018; Mencuccini et al., 2019). These models have been used
2.1 Study site
to study the interaction between elevated CO2 and drought
(Duursma and Medlyn, 2012), the impact of hydraulic traits The study site is located at the Stunt Ranch Santa Monica
on plant drought response (Christofferson et al., 2016), the Mountains Reserve in the Santa Monica Mountains in Cal-
role of hydraulic diversity in vegetation response to drought ifornia, USA (34◦ 050 N, 118◦ 390 W). Stunt Ranch is dom-
(Xu et al., 2016) and hydroclimate change (Powell et al., inated by chaparral vegetation with an elevation of approxi-
2018), and vegetation water stress and root water uptake mately 350 m, a west-facing slope, and a Mediterranean-type
(Kennedy et al., 2019). While the main purpose of the new climate. The study site harbors an abundance of fauna, par-
hydraulic components is to improve the vegetation response ticularly birds and reptiles. The mean annual temperature is
to drought, the fact that hydrodynamic models consider tis- 18.1 ◦ C. The mean annual precipitation is 478 mm, occurring
sue water content as a prognostic variable provides an oppor- mostly during the wet season (i.e., November–March) with
tunity to assess the climate impacts on LFMC. almost no rainfall during the dry season (i.e., April–October).
The objective of this study is to quantify LFMC dynamics Stunt Ranch last burned in 1993. We focused on PFTs repre-
and associated changes in fire season duration for a chaparral senting 11 study species (Fig. 1), including chamise (Adenos-
ecosystem in southern California under climate change using toma fasciculatum – Af), red shank (Adenostoma sparsi-
a vegetation demographic model (that resolves the size and folium – As), big berry manzanita (Arctostaphylos glauca –
age-since-disturbance structure of plant populations) (Xu et Ag), buck brush (Ceanothus cuneatus – Cc), greenbark cean-
al., 2016; Fisher et al., 2018) that incorporates plant hy- othus (Ceanothus spinosus – Cs), mountain mahogany (Cer-
draulics. We test one overarching hypothesis: future climate cocarpus betuloides – Cb), toyon (Heteromeles arbutifolia –
change will decrease LFMC and consequently result in a Ha), laurel sumac (Malosma laurina – Ml), scrub oak (Quer-
longer fire season as determined by a critical threshold of cus berberidifolia – Qb), hollyleaf redberry (Rhamnus ilici-
LFMC (H0 ). Specifically, we test the following four sub- folia – Ri), and sugar bush (Rhus ovata – Ro). Detailed in-
hypotheses: (1) warming has a stronger impact on LFMC formation about the study site and species characterizations
than CO2 fertilization (H1 ), (2) the reductions in spring and found at Stunt Ranch can be found in Venturas et al. (2016)
autumn precipitation lead to a longer fire season as deter- and Pivovaroff et al. (2019).
mined by LFMC (H2 ), (3) the combined impacts of warming
and precipitation on fire season length are equal to the addi- 2.2 FATES-HYDRO model
tive impacts of warming and precipitation change individu-
ally (H3 ), and (4) LFMC for plants with more conservative FATES is a vegetation demographic model (Fisher et al.,
2015) that uses a size-structured group of plants (cohorts)
https://doi.org/10.5194/bg-18-4005-2021 Biogeosciences, 18, 4005–4020, 20214008 W. Ma et al.: Assessing climate change impacts on live fuel moisture and wildfire risk
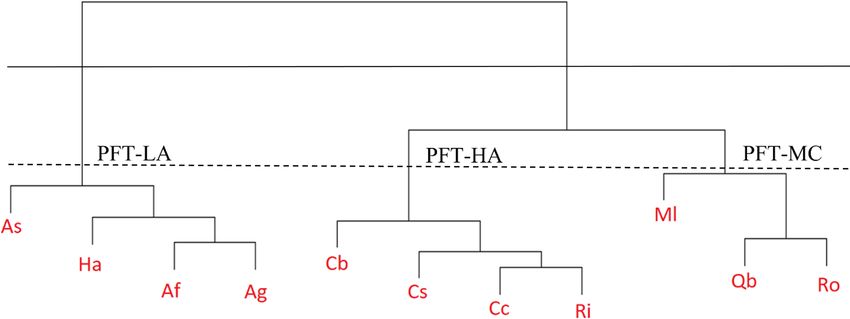
Figure 1. Hierarchical cluster analysis of allometry and hydraulic traits for 11 chaparral shrub species used to define three plant functional
types at Stunt Ranch. The plant functional types with a low productivity and an aggressive drought tolerance hydraulic strategy (PFT-LA)
were defined based on traits of red shank (Adenostoma sparsifolium – As), toyon (Heteromeles arbutifolia – Ha), chamise (Adenostoma
fasciculatum – Af), and big berry manzanita (Arctostaphylos glauca – Ag). The plant functional types with a high productivity and an
aggressive drought tolerance hydraulic strategy (PFT-HA) were defined based on traits of mountain mahogany (Cercocarpus betuloides –
Cb), greenbark ceanothus (Ceanothus spinosus – Cs), buck brush (Ceanothus cuneatus – Cc), and hollyleaf redberry (Rhamnus ilicifolia –
Ri). The plant functional types with a medium productivity and an conservative drought tolerance hydraulic strategy (PFT-MC) were defined
based on traits of laurel sumac (Malosma laurina – Ml), scrub oak (Quercus berberidifolia – Qb), and sugar bush (Rhus ovata – Ro).
and successional trajectory-based patches based on the where zi is compartment distance above (+) or below (−)
ecosystem demography approach (Moorcroft et al., 2001). the soil surface (m), ρw is the density of water (103 kg m−3 ),
FATES simulates the demographic process including seed g is acceleration due to gravity (9.8 m s−2 ), and ψi is tissue
production, seed emergence, growth, and mortality (Koven et or soil matric water potential (MPa). Ki is treated here as the
al., 2020). Because the main purpose is to assess LFMC, we product of a maximum boundary conductance between com-
controlled for variation in plant size structure that could arise partments i and i + 1 (Kmax,i ) and the fractional maximum
from plant traits or climate differences between model runs hydraulic conductance of the adjacent compartments (FMCi
by using a reduced-complexity configuration of the model or FMCi+1 ), which is a function of the tissue water content.
where growth and mortality are turned off and ecosystem A key parameter that controls FMC is the critical water po-
structure is held constant. FATES has to be hosted by a land tential (P50 ) that leads to 50 % loss of hydraulic conductivity.
surface model to simulate the soil hydrology, canopy temper- The tissue water potential is calculated based on pressure–
ature, and transpiration. These host land models include the volume (PV) theory (Tyree and Hammel, 1972; Tyree and
Exascale Energy Earth System Model (E3SM, Caldwell et Yang, 1990; Bartlett et al., 2012). For leaves, it is described
al., 2019) land model (ELM) as well as the Community Earth by three phases: (1) capillary water phase with full turgor,
System Model (Fisher et al., 2015) and the Norwegian Earth (2) elastic drainage phase before reaching turgor loss point,
System Model (NorESM, Tjiputra et al., 2013). In this study, and (3) post-turgor loss phase. For other tissues, it only has
we used the DOE-sponsored ELM as our host land model. phases 2 and 3. Compared to a non-hydrodynamic model,
The time step of FATES to calculate carbon and water fluxes this formulation allows the simulation of plant water trans-
is 30 min and it can downscale the data from 6-hourly climate port limitation on transpiration. For the non-hydrodynamic
drivers. version of FATES, the water limitation factor for transpira-
A key component of FATES, the plant hydrodynamic tion (Btran ) is calculated based on the soil moisture potential
model (HYDRO, based on Christoffersen et al., 2016), sim- (Fisher et al., 2015). For the hydrodynamic version, Btran is
ulates the water flow from soil through the roots, stem, and calculated based on the leaf water potential (ψl ) (Christof-
leaves to the atmosphere. In this model, water flow is cal- fersen et al., 2016) as follows:
culated based on water pressure gradients across different al −1
plant compartments (leaf, stem, transporting roots, absorbing ψl
Btran = 1 + (3)
roots, and rhizosphere). Specifically, flow between compart- P50_gs
ment i and i + 1 (Qi ) is given by
where P50_gs is the leaf water potential that leads to 50 % loss
Qi = −Ki 1hi , (1) of stomatal conductance and al is the shape parameter. Please
refer to Christoffersen, et al. (2016) for details of formula-
where Ki is the total conductance (kg MPa−1 s−1 ) at the
tions of FMC for different plant tissues.
boundary of compartments i and i + 1 and 1hi is the total
water potential difference between the compartments:
1hi = ρw g (zi − zi+1 ) + (ψi − ψi+1 ) , (2)
Biogeosciences, 18, 4005–4020, 2021 https://doi.org/10.5194/bg-18-4005-2021W. Ma et al.: Assessing climate change impacts on live fuel moisture and wildfire risk 4009
2.3 Allometry and trait data for model growth and hydraulic strategy. The three PFTs include a low
parameterization productivity, aggressive drought tolerance hydraulic strategy
PFT (PFT-LA) with a relatively low Vc,max25 (the maximum
FATES-HYDRO has a large number of parameters (> 80; carboxylation rate at 25 ◦ C) and a very negative P50 (the leaf
see Massoud et al., 2019 for a complete list except for hy- water potential leading to 50 % loss of hydraulic conductiv-
draulic parameters). Based on a previous sensitivity analy- ity); a medium productivity, conservative drought tolerance
sis study (Massoud et al., 2019), we focused our parameter hydraulic strategy PFT (PFT-MC) represented by a medium
estimation efforts on the most influential parameters for al- Vc,max25 and a less negative P50 , turgor loss point and water
lometry, leaf and wood traits, and hydraulic traits from ob- potential at full turgor; and a high productivity, aggressive
servations of 11 chaparral shrub species (see Table S2 in drought tolerance hydraulic strategy PFT (PFT-HA) with a
the Supplement) collected from Jacobsen et al. (2008) and relatively high Vc,max25 and a very negative P50 . The mean
Venturas et al. (2016). For this study, we assumed that the of the species-level trait data weighted by species abundance
allometry of a shrub is analogous to that of a small tree. at the site were used to parameterize FATES-HYDRO.
However, we did make several important modifications to
accommodate the allometry of a shrub as their height and 2.4 Model initialization
crown area relationships to diameter could be different from
trees. First, instead of using the diameter at breast height as Our model simulation is transient in terms of soil water
the basis for allometry to calculate the height, crown area content, leaf water content, and carbon and water fluxes.
and leaf biomass, we used the basal diameter as the basis The forest structure (plant sizes and number density) is
for shrubs. Second, in the allometry of trees, the diameter fixed and is parameterized based on a vegetation inven-
for maximum height (d1 : Fates_allom_dbh_maxheight; Ta- tory from Venturas et al. (2016). The soil texture and
ble S1) is the same as the diameter for maximum crown area depth information are parameterized based on a national
(d2 : Fates_allom_d2ca_max; Table S1). As our data showed soil survey database (https://websoilsurvey.sc.egov.usda.gov/
that d1 and d2 are different for shrubs, we have modified the App/WebSoilSurvey.aspx, last access: 28 March 2021; Ta-
codes so that d1 and d2 can be set for different values. It is ble S1). The soil moisture is initialized with 50 % of the sat-
possible that different branching and path length patterns for uration and the tissue plant water content is initialized so that
stems of chaparral species could impact the hydraulics com- it is in equilibrium with the soil water potential. We run the
pared to trees; however, FATES-HYDRO treats all the above- model for 10 years based on 1950–1960 climate so that the
ground xylem as a single pool and thus it should not affect simulated soil moisture, leaf water content, and carbon and
our model simulation results. water fluxes are not dependent on their initial conditions.
Based on a hierarchical cluster analysis (Bridges, 1966) 2.5 Live fuel moisture content for model validation
of allometry and trait data, there is a clear separation
among the shrub species. First, the dendrogram is built In this study, we used measured LFMC to validate simu-
and every data point finally merges into a single clus- lated LFMC. FATES-HYDRO does not directly simulate the
ter with the height shown on the y axis. Then we cut LFMC. Thus, we estimated the LFMC based on simulated
the dendrogram in order to create the desired number LWC. The LWC in the model is calculated as follows:
of clusters determined by a pragmatic choice based on
fw − dw
hydraulic traits of 11 chaparral shrub species (Fig. 1). LWC = × 10 (4)
R’s rect.hclust function (https://www.rdocumentation.org/ dw
packages/stats/versions/3.6.2/topics/rect.hclust, last access: where fw is the fresh weight and dw is the dry weight, which
25 April 2021) was used to see the clusters on the dendro- are both simulated within FATES-HYDRO. Then, we esti-
gram. All parameters of allometry, leaf and wood traits, and mated the LFMC within leaves and shoots (< 6 mm diame-
hydraulic traits were collected from observations shown in ter) using the empirical equation derived from shrub LFMC
Tables S2 and S3. According to the principle of model parsi- and LWC data including the three regenerative strategies
mony, we do not want to classify the species into more than (seeder (S), resprouter (R), and seeder–resprouter (SR)), in
3 PFTs. Meanwhile, we also want to differentiate the funda- summer, autumn, and winter from Figs. 4 and 5 in the study
mental plant growth and water use strategies that will deter- by Saura-Mas and Lloret (2007) as follows (Fig. S4):
mine plant transpiration rate and the corresponding LFMC.
LFMC = 31.091 + 0.491LWC. (5)
If we choose to classify the species into two PFTs (based
on the solid horizontal line in Fig. 1), then we will not be The climate in Saura-Mas and Lloret’s study is Mediter-
able to differentiate species with aggressive and conserva- ranean (northeast Iberian Peninsula), which is consistent
tive hydraulic strategies in the second group and not be able with the climate of our study area. LFMC was measured
to test H4. Therefore, the chaparral shrub species were clas- on our site approximately every three weeks, concurrently
sified into three PFTs (based on the dotted horizontal line with plant water potentials in 2015 and 2016. LFMC mea-
in Fig. 1 and Table S3) that are able to differentiate plant surement details can be found in Pivovaroff et al. (2019). For
https://doi.org/10.5194/bg-18-4005-2021 Biogeosciences, 18, 4005–4020, 20214010 W. Ma et al.: Assessing climate change impacts on live fuel moisture and wildfire risk
comparison with our model outputs, we calculated the mean mean. We then calculated p-values by comparing the simu-
LFMC within leaves and shoots for each PFT weighted by lated mean difference to the empirical distribution of differ-
the species abundance (Venturas et al., 2016). Species abun- ence estimated from these 10 000 samples (see supplemen-
dance was calculated by dividing mean density of a specific tary Sect. 5.2 within Xu et al. (2019) for details).
species by the mean density of all species. To test H1 (warming has a stronger impact on LFMC
than CO2 fertilization), we compared mean simulated LFMC
2.6 Climate drivers and fire season length for three PFTs with and without CO2
changes (fixed CO2 at 367 ppm vs. dynamic CO2 concentra-
We forced the FATES-HYDRO model with 6-hourly tem- tions from RCP4.5 or RCP8.5) and warming. To remove the
perature, precipitation, downward solar radiation, and wind future warming trend, future temperature was replaced with
components. Historical climate data during 2012–2019, historical (1986–2005) temperature data for every 20 year
which were used for FATES-HYDRO calibration, were ex- period. Similarly, to test H2 (the reductions in spring and au-
tracted from a local weather station (https://stuntranch.ucnrs. tumn precipitation lead to a longer fire season as determined
org/weather-date/, last access: 26 April 2021). Historical and by LFMC), we compared the model outputs of LFMC and
future climate data during 1950–2099, which were used for fire season length for three PFTs with and without precipita-
simulations of LFMC by the FATES-HYDRO model, were tion changes. To test H3 (the combined impacts of warming
downloaded from the Multivariate Adaptive Constructed and precipitation on fire season length are equal to the ad-
Analogs (MACA) datasets (Abatzoglou and Brown, 2012; ditive impacts of warming and precipitation change individ-
http://maca.northwestknowledge.net, last access: 25 April ually), we compared model outputs of LFMC and fire sea-
2021). The MACA datasets (1/24◦ or approximately 4 km; son length for three PFTs under three scenarios: (1) without
Abatzoglou and Brown, 2012) include 20 ESMs with his- warming, (2) without precipitation changes, and (3) with-
torical forcings during 1950–2005 and future Representa- out warming and precipitation changes. Finally, to test H4
tive Concentration Pathways (RCPs) RCP4.5 and RCP8.5 (LFMC for plants with more conservative hydraulic strate-
scenarios during 2006–2099 from the native resolution of gies will be more vulnerable to warming), we compared
the ESMs. The gridded surface meteorological dataset MET- model outputs of LFMC and fire season length across the
DATA (Abatzoglou, 2013) were used with high spatial res- three different PFTs with different hydraulic strategies.
olution (1/24◦ ) and daily timescales for near-surface min-
imum and maximum temperature, precipitation, downward
solar radiation, and wind components. Then we downscaled 3 Results
the MACA daily data to 6-hourly based on the temporal
3.1 Comparison between simulated and measured
anomaly of the observed mean daily data to the hourly data
LFMC
for each day during 2012–2019. The model is driven by
yearly CO2 data obtained from Meinshausen et al. (2011). Our results showed that FATES-HYDRO was able to cap-
ture variation in the LFMC for different PFTs and soil wa-
2.7 Hypothesis testing ter content at 5 cm depth (Figs. 2 and S3) as well as for
chamise in 2018 (Fig. S5), although we had limited observed
To test H0 (future climate change will decrease LFMC and LFMC data. Specifically, the model was able to capture 96 %,
consequently result in a longer fire season as determined by 86 %, and 80 % of the variance in observed LFMC for the
a critical threshold of LFMC), we compared the simulated 2015–2016 period for three PFTs, respectively (Fig. 2b, d,
mean LFMC, derived from modeled leaf water content, un- f). The model was also able to capture the seasonal dynamics
der the climate projections from 20 ESMs under RCP4.5 and of soil water content, LFMC, and LFMC below the thresh-
8.5. We then tested if the LFMC during the April–October old of 79 % in comparison to observed data (Figs. 2a, c, e
dry season in the historic 960–1999 period is significantly and S3). To validate that FATES-HYDRO is able to capture
higher than that in the future 2080–2099 period. For the the interannual variability of LFMC, we compared the simu-
fire season duration, we estimated the number of days per lated LFMC for PFT-LA with the long-term observations of
year below a critical threshold of LFMC (79 %). Similarly, LFMC for the chamise species (Adenostoma fasciculatum;
we tested if the number of days per year below the critical Fig. S5). Our results showed that the model is able to rea-
threshold of LFMC during the historical period are signifi- sonably capture the seasonal and interannual variability for
cantly different from that during the future period. We used the 2006–2019 period (R 2 = 0.7), although it underestimates
a bootstrapped approach (Jackson, 1993) to test if the mean peaks in LFMC in 4 of 14 years.
of LFMC or fire season duration are significantly different
between these two periods. Specifically, we randomly draw
10 000 samples from the simulated residuals of LFMC or fire
season durations estimated by 20 ESMs for these two peri-
ods under the null hypothesis that there is no difference in the
Biogeosciences, 18, 4005–4020, 2021 https://doi.org/10.5194/bg-18-4005-2021W. Ma et al.: Assessing climate change impacts on live fuel moisture and wildfire risk 4011
Figure 2. Simulated and observed monthly live fuel moisture content and related R 2 values for three PFTs (see Fig. 1 for an explanation of
the PFTs).
3.2 Changes in the LFMC and fire season length from future 2080–2099 period was projected to become signifi-
historical to future periods cantly lower than that during the historical 1960–1999 pe-
riod for all three PFTs (Fig. 3; p < 0.000001). Our results
Using the validated model driven by climate projections from also showed that the spread among models increases with
20 ESMs under greenhouse gas emission scenarios RCP4.5 time, suggesting a larger uncertainty in the future projection.
and RCP8.5, we found that the daily mean LFMC during the Specifically, the histogram of daily mean LFMC during the
https://doi.org/10.5194/bg-18-4005-2021 Biogeosciences, 18, 4005–4020, 20214012 W. Ma et al.: Assessing climate change impacts on live fuel moisture and wildfire risk
April–October dry season showed that there was a higher Our results showed that the combined impacts of warming
probability of low LFMC under future climate conditions and precipitation on fire season length were equal to the ad-
(Fig. S1). The daily mean LFMC decreased from 84.7 %, ditive impacts of warming and precipitation change individ-
101.3 %, and 78.4 % during the historical 1960–1999 period ually. This supported hypothesis H3 . Specifically, the com-
to 81.0 %–82.8 %, 96.3 %–98.8 %, and 74.8 %–76.6 % dur- bined changes in temperature and precipitation caused a 24–
ing the future 2080–2099 period under both climate scenar- 33 d yr−1 (15.6 %–26.8 %) increase in fire season length with
ios for PFT-LA, PFT-MC, and PFT-HA, respectively (Fig. 3). the critical threshold of 79 % LFMC under RCP8.5 (Fig. 5).
Based on the projected LFMC, there was a significant in- Under RCP4.5, the combined changes in temperature and
crease in the fire season length with the critical threshold of precipitation caused a 6–9 d yr−1 (4.8 %–6.1 %) change in
LFMC from the historical 1960–1999 period to the future fire season length.
2080–2099 period for three PFTs. With the critical thresh-
old of 79 % LFMC, the fire season length was projected to 3.4 Comparison of changes in fire season length among
increase by 20, 22, and 19 d under RCP8.5 (Fig. 4 and Ta- three PFTs under climate change
ble S4) and to increase by 9, 11, and 8 d under RCP4.5 (Fig. 4
and Table S4). Our results also showed that the spread among Regarding three PFTs under both climate scenarios, the fire
models increases with time, suggesting a larger uncertainty season length for PFT-HA was the longest (167–176 d yr−1 ),
in the future projection. The above results for mean LFMC while fire season length for PFT-MC was the shortest (114–
and fire season length support hypothesis H0 that future cli- 124 d yr−1 ) during 2080–2099 (Fig. 4). However, the re-
mate change will decrease LFMC and consequently result in sponse of fire season length to warming was strongest for
a longer fire season, as determined by critical thresholds for PFT-MC. Specifically, for PFT-MC, warming under RCP8.5
LFMC for all three PFTs. led to an increase of 21.6 % (22 d) in fire season length
(Fig. 5b) and warming under RCP4.5 led to an increase of
3.3 Relative effects of individual climate changes on the 10.8 % (11 d) in fire season length. For PFT-LA, warming
length of the fire season under RCP8.5 led to an increase of 14.7 % (19 d) in fire sea-
son length (Fig. 5a), while warming under RCP4.5 led to an
In order to better understand the relative contribution to fire increase of 7.4 % (9 d) in fire season length. Finally, for PFT-
season length of different climate variables, we ran FATES- HA, warming under RCP8.5 led to an increase of 10.2 %
HYDRO for three PFTs using meteorological forcings that (18 d) in fire season length (Fig. 5c) and 5.3 % (8 d) in fire
isolated and removed changes in individual specific vari- season length under RCP4.5. Because PFT-MC has a more
ables. Our results showed that the increase in fire season conservative hydraulic strategy with a less negative P50 , tur-
length mainly resulted from warming, which led to a 16–23 d gor loss point and water potential at full turgor, this result
(9.1 %–18.6 %) per year increase in fire season length for the supported hypothesis H4 that the LFMC for plants with more
critical threshold of 79 % LFMC under RCP8.5 (Fig. 5). This conservative hydraulic strategy will be more vulnerable to
is because warming is pushing vapor pressure deficit (VPD) warming.
higher, resulting in increased fire season length. For RCP4.5, To validate our classification scheme, we compared these
the warming contributed to a 5–6 d (3.8 %–4.3 %) per year PFT-level results to those obtained with single-PFT and 2-
increase in fire season length (Fig. 5). We also found that el- PFT simulations and found that using the three PFTs defined
evated CO2 concentrations decreased fire season length with by our cluster analysis gives a qualitatively different view of
a 6–7 d (3.5 %–4.8 %) per year decrease in fire season length LFMC change than a single- or 2-PFT simulation. We found
under RCP8.5 (Fig. 5). Under RCP4.5, CO2 increases led to significant differences in the percentage changes of LFMC
a 2–3 d (1.5 %–2.2 %) per year decrease in fire season length and fire season length between the future period (2080–2099)
(Fig. 5). Because the impact of warming on fire season length and historical period (1960–1999) using three distinct PFTs
was stronger than the mitigation from CO2 enrichment, our but no significant differences between PFTs in 2-PFT simu-
results support hypothesis H1 (warming has a stronger im- lations under the different climate scenarios (Fig. S6).
pact on LFMC than CO2 fertilization).
Even though total precipitation was projected to increase
in the future, lower precipitation in the spring and autumn 4 Discussion
(Fig. S2a, b) led to an 8–10 d (6.3 %–8.1 %) per year in-
crease in fire season length with the critical threshold of 79 % Low LFMC within shrub leaves and shoots increases the
LFMC under RCP8.5 (Fig. 5). Under RCP4.5, the precipita- flammability and likelihood of combustion, making it vi-
tion changes contributed to a 1–3 d (0.8 %–1.6 %) increase tally important to monitor temporal variations in LFMC,
in fire season length (Fig. 5). This result supported hypothe- especially during the dry season (Dennison et al., 2008).
sis H2 that the reductions in spring and autumn precipitation The strong relationships between observed and simulated
lead to a longer fire season as determined by LFMC. LFMC of all PFTs (Fig. 2) suggested that the plant hydro-
dynamic model, FATES-HYDRO, could accurately estimate
Biogeosciences, 18, 4005–4020, 2021 https://doi.org/10.5194/bg-18-4005-2021W. Ma et al.: Assessing climate change impacts on live fuel moisture and wildfire risk 4013 Figure 3. Temporal changes in daily mean live fuel moisture content (black solid line) and 95 % confidence interval (black dash-dot line) from 1960 to 2099 for three PFTs (see Fig. 1 for an explanation of the PFTs) under climate scenarios RCP4.5 and 8.5 with 20 Earth system models considering all climatic variables changes. The p values were calculated using bootstrap sampling to test whether the daily mean live fuel moisture content across different models during the future period (2080–2099) was significantly lower than that during the historical period (1960–1999). The gray horizontal dotted line represents the ensemble mean for 2080–2099. LFMC seasonal dynamics as a function of modeled leaf wa- tions . During both the future period (2080–2099) and his- ter content and consequently be useful to predict fire risks in torical period (1960–1999), lower values in the dry season Mediterranean-type climate regions, although only a small (April–October) were displayed, which is consistent with amount of validation data were used and the underlying as- lower LFMC during the summer–fall dry season, rather than sumption that a shrub was analogous to a small tree was the winter–spring wet season (Chuvieco et al., 2004; Pel- made. Based on the simulated monthly mean LFMC during lizzaro et al., 2007; Pivovaroff et al., 2019). Extremely low 2006–2019 for PFT-LA, which includes the chamise species, daily LFMC was more likely to occur during the future pe- we found that our model can capture the seasonal variation riod, which had higher temperature than the historical period. and interannual variability, but underestimates the highest From the historical to the future period, fire season length wet season peaks in LFMC in 4 of 14 years (Fig. S5). While could increase by 5.2 %–14.8 % under climate change for it would not highly affect the long-term trend of LFMC and chaparral shrub ecosystems (H0 ). The fire season length was fire season length, this may cause biases for future projec- https://doi.org/10.5194/bg-18-4005-2021 Biogeosciences, 18, 4005–4020, 2021
4014                                   W. Ma et al.: Assessing climate change impacts on live fuel moisture and wildfire risk

Figure 4. Temporal changes in average number of days per year of live fuel moisture content below 79 % (black solid line) and 95 %
confidence interval (black dash-dot line) from 1960 to 2099 for three PFTs (see Fig. 1 for an explanation of the PFTs) under climate scenario
RCP4.5 and 8.5 with 20 Earth system models considering all climatic variables changes. The p values were calculated using bootstrap
sampling to test whether the number of days across different models during the future period (2080–2099) was significantly higher than that
during the historical period (1960–1999). The gray horizontal dotted line represents the ensemble mean for 2080–2099.

not validated; rather, it was defined as the number of days              al., 2000) and thus could mitigate the impacts of warm-
with LFMC below 79 %.                                                    ing on LFMC. Our results illustrated that even though the
   Quantifying influences of climatic variables on LFMC is               CO2 impact did cause a 3.5 %–4.8 % reduction in fire season
crucial to predicting future fire risks (Dennison and Moritz,            length, the impact of warming on fire season length is about
2009). Our results showed that future warming was the                    5.6 %–13.8 % larger than the CO2 effect (H1 , warming has a
most important driver of LFMC. This finding suggested                    stronger impact on LFMC than CO2 fertilization). This result
that warming would substantially push vapor pressure deficit             suggests that CO2 fertilization cannot offset the LFMC im-
(VPD) higher, decrease LFMC, and strongly increase the fire              pacts from warming. The FATES-HYDRO model assumes a
season length, which may greatly increase fire risks in the              consistent stomatal sensitivity to CO2 concentration across
future (e.g., Dennison et al., 2008; Chuvieco et al., 2009;              Mediterranean shrub species. While Mediterranean shrub
Pimont et al., 2019). CO2 fertilization is expected to re-               functional types in arid and semi-arid systems would vary in
duce stomatal conductance (Pataki et al., 2000; Tognetti et              their stomatal response in the real world (Pataki et al., 2000).

Biogeosciences, 18, 4005–4020, 2021                                                          https://doi.org/10.5194/bg-18-4005-2021
W. Ma et al.: Assessing climate change impacts on live fuel moisture and wildfire risk                                            4015

                                                                       in agreement with a prior study indicating that spring pre-
                                                                       cipitation, particularly in the month of March, was found to
                                                                       be the primary driver of timing of LFMC changes (Denni-
                                                                       son and Moritz, 2009). We also found that the combined im-
                                                                       pacts of warming and precipitation on fire season length were
                                                                       equal to the linearly additive impacts of warming and precip-
                                                                       itation change individually (H3 ). Our results suggested that
                                                                       when evaluating future fire risks, it is critical that we con-
                                                                       sider the seasonal changes in precipitation and its interaction
                                                                       with the warming impact.
                                                                          Modeled vegetation responses to environmental changes is
                                                                       a function of variation in plant functional traits (Koven et al.,
                                                                       2020). The three PFTs represented in this study have simi-
                                                                       lar patterns in LFMC in response to climate change during
                                                                       1960–2099, but we did see some critical differences. Specif-
                                                                       ically, the plant functional type PFT-MC with more conser-
                                                                       vative hydraulic strategy had the strongest responses to cli-
                                                                       mate change (Fig. 5). This could be related to the fact that
                                                                       the PFT-MC is a more conservative drought tolerant PFT in
                                                                       terms of hydraulic strategy with less negative P50 , turgor loss
                                                                       point, and water potential at full turgor. The PFT-MC plants
                                                                       had a relatively high saturated water content based on ob-
                                                                       served data (Fig. 2) and the water within plant tissues thus
                                                                       changes more quickly in response to the environmental con-
                                                                       dition changes (H4 , LFMC for plants with more conservative
                                                                       hydraulic strategies will be more vulnerable to warming).
                                                                       However, the three different PFTs coexisted at the same loca-
                                                                       tion in model simulations, therefore, coexistence and hetero-
                                                                       geneity in LFMC might impact fire behavior and fire season
                                                                       length.
                                                                          Because the moisture content of live fuels (∼ 50 %–200 %)
                                                                       is much higher than that of dead fuels (∼ 7 %–30 %), leaf
                                                                       senescence induced by drought stress and subsequent mortal-
                                                                       ity are potentially vital factors to cause large wildfires (Nolan
Figure 5. Differences in number of days per year of live fuel          et al., 2016, 2020). Thus drought-induced canopy dieback
moisture content below 79 % from 2080 to 2099 for three PFTs           and mortality could largely increase surface fine fuel loads
(see Fig. 1 for an explanation of the PFTs) under climate scenario     and vegetation flammability, which can increase the proba-
RCP4.5 and 8.5 between considering all climatic variable changes
                                                                       bility of wildfires (Ruthrof et al., 2016). Since growth and
and removing the CO2 , precipitation, temperature, and precipitation
                                                                       mortality are turned off in model runs by using a reduced-
and temperature changes.
                                                                       complexity configuration, it is possible that vegetation den-
                                                                       sity might decrease and LFMC could be conserved under
                                                                       future scenarios. In addition, potential vegetation transitions
Therefore, our model may overestimate or underestimate the             (e.g., shrubs to grassland and species composition changes)
CO2 effect on stomatal conductance and its mitigating influ-           might substantially affect flammability and thus fire inten-
ence might be smaller in reality for some species.                     sity and frequency. In this study, we used the static mode of
   Previous studies implied that the timing of precipitation           FATES-HYDRO to simulate LWC dynamics under climate
may have a strong impact on subsequent LFMC (e.g., Veblen              change. If we need to assess how the leaf senescence and
et al., 2000; Westerling et al., 2006; Dennison and Moritz,            vegetation dynamics will impact the fire behavior, we can use
2009). In this study, precipitation was also a key driver of           the same model with dynamic mode to assess their impact on
LFMC under future climate conditions. Our results showed               fire behavior under future drought and warming conditions.
that even though total precipitation was projected to increase,           Application of a hydrodynamic vegetation model to es-
the reduction in spring and autumn precipitation (Fig. S2)             timate LFMC dynamics could potentially benefit wildfire
was projected to cause a longer fire season length (H2 , the re-       modeling at the fine scale, landscape scale, and global scale.
ductions in spring and autumn precipitation lead to a longer           LFMC is a potentially critical factor influencing fire spread
fire season as determined by LFMC; Fig. 5). This result was            and consumption. Many previous wildfire models focus on

https://doi.org/10.5194/bg-18-4005-2021                                                       Biogeosciences, 18, 4005–4020, 2021
4016 W. Ma et al.: Assessing climate change impacts on live fuel moisture and wildfire risk
the impacts of dead fuel moisture, weather conditions and Disclaimer. Publisher’s note: Copernicus Publications remains
fuel loads, rather than the representation of live fuel moisture neutral with regard to jurisdictional claims in published maps and
(Anderson and Anderson, 2010; Keeley et al., 2011; Jolly institutional affiliations.
and Johnson, 2018). The implications of including LFMC
are that fire potential will change with plant water potential
and uptake from soils, photosynthetic and respiratory activ- Acknowledgements. We thank the editor Martin De Kauwe and the
ity, carbon allocation, and phenology with variability across three referees for their help improving this paper.
This project is supported by the University of California Office of
species over time (Jolly and Johnson, 2018). Therefore, work
the President Lab Fees Research Program and the Next Generation
to incorporate LFMC dynamics in models could play a vi-
Ecosystem Experiment (NGEE) Tropics, which is supported by the
tally important role in projections of wildfire behavior and U.S. DOE Office of Science. Charles D. Koven and Junyan Ding
effects under current and future climate. are supported by the DOE Office of Science, Regional and Global
Model Analysis Program, Early Career Research Program.
5 Conclusions
Financial support. This research has been supported by the Uni-
A hydrodynamic vegetation model, FATES-HYDRO, was
versity of California Office of the President Lab Fees Research
used to estimate leaf water status and thus LFMC dynam- Program and the Next Generation Ecosystem Experiment (NGEE)
ics of chaparral shrub species in southern California un- Tropics, which is supported by the U.S. DOE Office of Science; the
der historical and future conditions. The FATES-HYDRO DOE Office of Science, Regional and Global Model Analysis Pro-
model was validated using monthly mean LFMC for three gram, Early Career Research Program; Los Alamos National Lab-
PFTs. The fire season length was projected to substantially oratory High Performance Computing; and the U.S.Department of
increase under both climate scenarios from 1960–1999 to Energy, Office of Science, Office of Biological and Environmental
2080–2099. This could increase wildfire risk over time for Research.
chaparral shrubs in southern California. Our results showed
that temperature was the most important driver of LFMC
among all climatic variables. The LFMC estimated by the Review statement. This paper was edited by Martin De Kauwe and
FATES-HYDRO model offered a baseline of predicting plant reviewed by Douglas I. Kelley and two anonymous referees.
hydraulic dynamics subjected to climate change and pro-
vided a critical foundation that reductions in LFMC from
climate warming may exacerbate future wildfire risk. Longer
fire seasons might have a significant impact on overall public
health and quality of life in the future. References
Abatzoglou, J. T.: Development of gridded surface meteorological
data for ecological applications and modelling, Int. J. Climatol.,
Data availability. LFMC measurement data can be found in Pivo-
33, 121–131, https://doi.org/10.1002/joc.3413, 2013.
varoff et al. (2019). Species abundance data can be found in Ven-
Abatzoglou, J. T. and Brown, T. J.: A comparison of statistical
turas et al. (2016). All other data are available within this paper and
downscaling methods suited for wildfire applications, Int. J. Cli-
in the Supplement.
matol., 32, 772–780, https://doi.org/10.1002/joc.2312, 2012.
Agee, J. K., Wright, C. S., Williamson, N., and Huff, M. H.: Fo-
liar moisture content of Pacific Northwest vegetation and its re-
Supplement. The supplement related to this article is available on- lation to wildland fire behavior, For. Ecol. Manag., 167, 57–66,
line at: https://doi.org/10.5194/bg-18-4005-2021-supplement. https://doi.org/10.1016/S0378-1127(01)00690-9, 2002.
Aguado, I., Chuvieco, E., Boren, R., and Nieto, H.: Estimation of
dead fuel moisture content from meteorological data in Mediter-
Author contributions. WM, LZ and CX were involved in designing ranean areas. Applications in fire danger assessment, Int. J. Wild-
the study. WM and CX conducted the model simulations and data land Fire, 16, 390–397, https://doi.org/10.1071/WF06136, 2007.
analysis in consultation with JS, PB, JD, MM, CDK, and LK. WM Anderson, S. A. and Anderson, W. R.: Ignition and fire spread
and CX wrote the first draft of the manuscript. LZ, AP, JS, PB, thresholds in gorse (Ulex europaeus), Int. J. Wildland Fire, 19,
JD, BC, RK, MM, RAF, CDK, and LK reviewed and improved the 589–598, https://doi.org/10.1071/WF09008, 2010.
manuscript. Balch, J. K., Bradley, B. A., Abatzoglou, J. T., Nagy, R. C., Fusco,
E. J., and Mahood, A. L.: Human-started wildfires expand the
fire niche across the United States, P. Natl. Acad. Sci. USA, 114,
Competing interests. The authors declare that they have no conflict 2946–2951, https://doi.org/10.1073/pnas.1617394114, 2017.
of interest. Bartlett, M. K., Scoffoni, C., and Sack, L.: The determinants of leaf
turgor loss point and prediction of drought tolerance of species
and biomes: a global meta-analysis, Ecol. Lett., 15, 393–405,
https://doi.org/10.1111/j.1461-0248.2012.01751.x, 2012.
Biogeosciences, 18, 4005–4020, 2021 https://doi.org/10.5194/bg-18-4005-2021W. Ma et al.: Assessing climate change impacts on live fuel moisture and wildfire risk 4017 Bilgili, E. and Saglam, B.: Fire behavior in maquis fuels in Turkey, Duursma, R. A. and Medlyn, B. E.: MAESPA: a model to study For. Ecol. Manag., 184, 201–207, https://doi.org/10.1016/S0378- interactions between water limitation, environmental drivers and 1127(03)00208-1, 2003. vegetation function at tree and stand levels, with an example ap- Bistinas, I., Harrison, S. P., Prentice, I. C., and Pereira, J. M. plication to [CO2 ] × drought interactions, Geosci. Model Dev., C.: Causal relationships versus emergent patterns in the global 5, 919–940, https://doi.org/10.5194/gmd-5-919-2012, 2012. controls of fire frequency, Biogeosciences, 11, 5087–5101, Fisher, R. A., Muszala, S., Verteinstein, M., Lawrence, P., Xu, C., https://doi.org/10.5194/bg-11-5087-2014, 2014. McDowell, N. G., Knox, R. G., Koven, C., Holm, J., Rogers, Bridges Jr., C. C.: Hierarchical cluster analysis, Psychol. Rep., 18, B. M., Spessa, A., Lawrence, D., and Bonan, G.: Taking off the 851–854, https://doi.org/10.2466/pr0.1966.18.3.851, 1966. training wheels: the properties of a dynamic vegetation model Caccamo, G., Chisholm, L. A., Bradstock, R. A., and Puotinen, M. without climate envelopes, CLM4.5(ED), Geosci. Model Dev., L.: Using remotely-sensed fuel connectivity patterns as a tool 8, 3593–3619, https://doi.org/10.5194/gmd-8-3593-2015, 2015. for fire danger monitoring, Geophys. Res. Lett., 39, L01302, Fisher, R. A., Koven, C. D., Anderegg, W. R., Christoffersen, https://doi.org/10.1029/2011GL050125, 2012a. B. O., Dietze, M. C., Farrior, C. E., Holm, J. A., Hurtt, Caccamo, G., Chisholm, L. A., Bradstock, R. A., Puotinen, M. G. C., Knox, R. G., Lawrence, P. J., and Lichstein, J. W.: L., and Pippen, B. G.: Monitoring live fuel moisture content Vegetation demographics in Earth System Models: A review of heathland, shrubland and sclerophyll forest in south-eastern of progress and priorities, Glob. Change. Biol., 24, 35–54, Australia using MODIS data, Int. J. Wildland Fire, 21, 257–269, https://doi.org/10.1111/gcb.13910, 2018. https://doi.org/10.1071/WF11024, 2012b. Flannigan, M. D., Krawchuk, M. A., de Groot, W. J., Wotton, Caldwell, P. M., Mametjanov, A., Tang, Q., Van Roekel, L. P., Go- B. M., and Gowman, L. M.: Implications of changing climate laz, J. C., Lin, W., Bader, D. C., Keen, N. D., Feng, Y., Jacob, R., for global wildland fire, Int. J. Wildland Fire, 18, 483–507, and Maltrud, M. E.: The DOE E3SM coupled model version 1: https://doi.org/10.1071/WF08187, 2009. Description and results at high resolution, J. Adv. Model. Earth Gillett, N. P., Weaver, A. J., Zwiers, F. W., and Flanni- Syst., 11, 4095–4146, https://doi.org/10.1029/2019MS001870, gan, M. D.: Detecting the effect of climate change on 2019. Canadian forest fires, Geophys. Res. Lett., 31, L18211, Castro, F. X., Tudela, A., and Sebastià, M. T.: Modeling moisture https://doi.org/10.1029/2004GL020876, 2004. content in shrubs to predict fire risk in Catalonia (Spain), Agric. Goss, M., Swain, D. L., Abatzoglou, J. T., Sarhadi, A., Kolden, For. Meteorol., 116, 49–59, https://doi.org/10.1016/S0168- C. A., Williams, A. P., and Diffenbaugh, N. S.: Climate change 1923(02)00248-4, 2003. is increasing the likelihood of extreme autumn wildfire con- Christoffersen, B. O., Gloor, M., Fauset, S., Fyllas, N. M., Gal- ditions across California, Environ. Res. Lett., 15, 094016, braith, D. R., Baker, T. R., Kruijt, B., Rowland, L., Fisher, R. https://doi.org/10.1088/1748-9326/ab83a7, 2020. A., Binks, O. J., Sevanto, S., Xu, C., Jansen, S., Choat, B., Men- Hantson, S., Arneth, A., Harrison, S. P., Kelley, D. I., Prentice, I. C., cuccini, M., McDowell, N. G., and Meir, P.: Linking hydraulic Rabin, S. S., Archibald, S., Mouillot, F., Arnold, S. R., Artaxo, traits to tropical forest function in a size-structured and trait- P., Bachelet, D., Ciais, P., Forrest, M., Friedlingstein, P., Hickler, driven model (TFS v.1-Hydro), Geosci. Model Dev., 9, 4227– T., Kaplan, J. O., Kloster, S., Knorr, W., Lasslop, G., Li, F., Man- 4255, https://doi.org/10.5194/gmd-9-4227-2016, 2016. geon, S., Melton, J. R., Meyn, A., Sitch, S., Spessa, A., van der Chuvieco, E., Cocero, D., Riano, D., Martin, P., Martınez-Vega, Werf, G. R., Voulgarakis, A., and Yue, C.: The status and chal- J., de la Riva, J., and Pérez, F.: Combining NDVI and surface lenge of global fire modelling, Biogeosciences, 13, 3359–3375, temperature for the estimation of live fuel moisture content in https://doi.org/10.5194/bg-13-3359-2016, 2016. forest fire danger rating, Remote. Sens. Environ., 92, 322–331, Holm, J. A., Shugart, H. H., Van Bloem, S. J., and https://doi.org/10.1016/j.rse.2004.01.019, 2004. Larocque, G. R.: Gap model development, validation, Chuvieco, E., González, I., Verdú, F., Aguado, I., and Yebra, M.: and application to succession of secondary subtropical Prediction of fire occurrence from live fuel moisture content dry forests of Puerto Rico, Ecol. Modell., 233, 70–82, measurements in a Mediterranean ecosystem, Int. J. Wildland https://doi.org/10.1016/j.ecolmodel.2012.03.014, 2012. Fire, 18, 430–441, https://doi.org/10.1071/WF08020, 2009. Jackson, D. A.: Stopping rules in principal components analysis: Clarke, H., Pitman, A. J., Kala, J., Carouge, C., Haverd, V., a comparison of heuristical and statistical approaches, Ecology, and Evans, J. P.: An investigation of future fuel load and 74, 2204–2214, https://doi.org/10.2307/1939574, 1993. fire weather in Australia, Clim. Change., 139, 591–605, Jacobsen, A. L., Pratt, R. B., Davis, S. D., and Ewers, F. https://doi.org/10.1007/s10584-016-1808-9, 2016. W.: Comparative community physiology: nonconvergence in Dennison, P. E. and Moritz, M. A.: Critical live fuel moisture in cha- water relations among three semi-arid shrub communities, parral ecosystems: a threshold for fire activity and its relationship New Phytol., 180, 100–113, https://doi.org/10.1111/j.1469- to antecedent precipitation, Int. J. Wildland Fire, 18, 1021–1027, 8137.2008.02554.x, 2008. https://doi.org/10.1071/WF08055, 2009. Jolly, W. M. and Johnson, D. M.: Pyro-ecophysiology: shift- Dennison, P. E., Moritz, M. A., and Taylor, R. S.: Evaluating pre- ing the paradigm of live wildland fuel research, Fire, 1, 8, dictive models of critical live fuel moisture in the Santa Mon- https://doi.org/10.3390/fire1010008, 2018. ica Mountains, California, Int. J. Wildland Fire, 17, 18–27, Keeley, J. E.: Future of California floristics and systematics: wildfire https://doi.org/10.1071/WF07017, 2008. threats to the California flora, Madrono, 42, 175–179, available Dimitrakopoulos, A. P. and Papaioannou, K. K.: Flammability as- at: https://www.jstor.org/stable/41425064 (last access: 25 March sessment of Mediterranean forest fuels, Fire Technol., 37, 143– 2021), 1995. 152, https://doi.org/10.1023/A:1011641601076, 2001. https://doi.org/10.5194/bg-18-4005-2021 Biogeosciences, 18, 4005–4020, 2021
You can also read


