PRODUCTION OF HONO FROM NO2 UPTAKE ON ILLUMINATED TIO2 AEROSOL PARTICLES AND FOLLOWING THE ILLUMINATION OF MIXED TIO2/AMMONIUM NITRATE PARTICLES ...
←
→
Page content transcription
If your browser does not render page correctly, please read the page content below
Atmos. Chem. Phys., 21, 5755–5775, 2021
https://doi.org/10.5194/acp-21-5755-2021
© Author(s) 2021. This work is distributed under
the Creative Commons Attribution 4.0 License.

Production of HONO from NO2 uptake on illuminated TiO2 aerosol
particles and following the illumination of mixed
TiO2/ammonium nitrate particles
Joanna E. Dyson1 , Graham A. Boustead1 , Lauren T. Fleming1 , Mark Blitz1,2 , Daniel Stone1 , Stephen R. Arnold3 ,
Lisa K. Whalley1,2 , and Dwayne E. Heard1
1 School of Chemistry, University of Leeds, Leeds, LS2 9JT, UK
2 NationalCentre of Atmospheric Science, University of Leeds, Leeds, LS2 9JT, UK
3 School of Earth and Environment, University of Leeds, Leeds, LS2 9JT, UK

Correspondence: Dwayne E. Heard (d.e.heard@leeds.ac.uk)

Received: 25 November 2020 – Discussion started: 1 December 2020
Revised: 13 February 2021 – Accepted: 23 February 2021 – Published: 16 April 2021

Abstract. The rate of production of HONO from illumi-           production of HONO was seen from the illumination of ni-
nated TiO2 aerosols in the presence of NO2 was measured         trate aerosols alone. The rate of production of HONO ob-
using an aerosol flow tube system coupled to a photo-           served from mixed nitrate/TiO2 aerosols was scaled to am-
fragmentation laser-induced fluorescence detection appa-        bient conditions found at the Cape Verde Atmospheric Ob-
ratus. The reactive uptake coefficient of NO2 to form           servatory (CVAO) in the remote tropical marine boundary
HONO, γNO2 →HONO , was determined for NO2 mixing ra-            layer. The rate of HONO production from aerosol particulate
tios in the range 34–400 ppb, with γNO2 →HONO spanning          nitrate photolysis containing a photocatalyst was found to be
the range (9.97 ± 3.52) × 10−6 to (1.26 ± 0.17) × 10−4 at       similar to the missing HONO production rate necessary to re-
a relative humidity of 15 ± 1 % and for a lamp photon           produce observed concentrations of HONO at CVAO. These
flux of (1.63 ± 0.09) ×1016 photons cm−2 s−1 (integrated be-    results provide evidence that particulate nitrate photolysis
tween 290 and 400 nm), which is similar to midday am-           may have a significant impact on the production of HONO
bient actinic flux values. γNO2 →HONO increased as a func-      and hence NOx in the marine boundary layer where mixed
tion of NO2 mixing ratio at low NO2 before peaking at           aerosols containing nitrate and a photocatalytic species such
(1.26 ± 0.17) ×10−4 at ∼ 51 ppb NO2 and then sharply de-        as TiO2 , as found in dust, are present.
creasing at higher NO2 mixing ratios rather than levelling
off, which would be indicative of surface saturation. The de-
pendence of HONO production on relative humidity was also
investigated, with a peak in production of HONO from TiO2       1   Introduction
aerosol surfaces found at ∼ 25 % RH. Possible mechanisms
consistent with the observed trends in both the HONO pro-       A dominant source of OH radicals in polluted environments
duction and reactive uptake coefficient were investigated us-   is the photolysis of nitrous acid (HONO) (Platt et al., 1980;
ing a zero-dimensional kinetic box model. The modelling         Winer and Biermann, 1994; Harrison et al., 1996; Alicke et
studies supported a mechanism for HONO production on            al., 2002; Whalley et al., 2018; Crilley et al., 2019; Lu et
the aerosol surface involving two molecules of NO2 , as         al., 2019; Slater et al., 2020; Whalley et al., 2021). During
well as a surface HONO loss mechanism which is depen-           a recent study in winter in central Beijing, HONO photol-
dent upon NO2 . In a separate experiment, significant pro-      ysis accounted for over 90 % of the primary production of
duction of HONO was observed from illumination of mixed         OH averaged over the day (Slater et al., 2020). Oxidation by
nitrate/TiO2 aerosols in the absence of NO2 . However, no       OH radicals is the dominant removal mechanism for many
                                                                tropospheric trace gases, such as tropospheric methane, as

Published by Copernicus Publications on behalf of the European Geosciences Union.
5756                                                           J. E. Dyson et al.: HONO production from illuminated aerosols

well as the formation of secondary species, including tropo-            In previous studies of the reaction of NO2 on TiO2 aerosol
spheric ozone (Levy, 1971), nitric and sulfuric acids which          surfaces, HONO was observed as a major gas-phase prod-
condense to form aerosols, and secondary organic aerosols.           uct (Gustafsson et al., 2006; Dupart et al., 2014). Gustafs-
Understanding the formation of HONO in highly polluted               son et al. (2006) observed a yield of gas-phase HONO of
environments is crucial to fully understand both the concen-         ∼ 75 % (for each NO2 removed) and showed the rate of the
tration and distribution of key atmospheric radical species,         photoreaction of NO2 on pure TiO2 aerosols dependent on
as well as secondary products in the gas and aerosol phases          relative humidity, emphasising the superhydrophilic nature
associated with climate change and poor air quality.                 of TiO2 surfaces under UV irradiation. Dupart et al. (2014)
   Atmospheric concentrations of HONO range from a few               also reported a relative humidity dependence of the uptake of
parts per trillion by volume (pptv) in remote clean environ-         NO2 onto Arizona test dust containing TiO2 , with the main
ments (Reed et al., 2017) to more than 10 ppb in highly              gas-phase products measured being NO and HONO, with
polluted areas such as Beijing (Crilley et al., 2019). The           a HONO yield of 30 % in experiments with 110 ppb NO2 .
main gas-phase source of HONO in the troposphere is the              Dupart et al. (2014) postulated the following mechanism of
reaction of nitric oxide (NO) with the OH radical. HONO              HONO production, which is consistent with the formation of
has also been shown to be directly emitted from vehicles             the NO− 2 anion seen in a previous study on TiO2 surfaces
(Kurtenbach et al., 2001; Li et al., 2008), for which the rate       (Nakamura et al., 2000):
of emission is often estimated as a fraction of known NOx
(NO2 +NO) emissions. Many heterogeneous HONO sources                 h+            +
                                                                      VB + H2 O → H + OH,                                     (R2)
                                                                      −
have also been postulated, including the conversion of ni-           eCB + O2 → O−
                                                                                 2,                                          (R3)
tric acid (HNO3 ) on ground or canopy surfaces (Zhou et al.,                 −    −
                                                                     NO2 + O2 or eCB  → NO−
                                                                                          2 + O2 ,                            (R4)
2003; George et al., 2005), bacterial production of nitrite             −     +
on soil surfaces (Su et al., 2011; Oswald et al., 2013), and,        NO2 + H → HONO,                                          (R5)
more recently, particulate nitrate photolysis, thought to be an      NO2 + OH → HNO3 .                                        (R6)
important source in marine environments (Ye et al., 2016;
Reed et al., 2017; Ye et al., 2017a, b). Rapid cycling of gas-          In areas with high mineral dust loading, such as desert re-
phase nitric acid to gas-phase nitrous acid via particulate ni-      gions, far from anthropogenic sources, NO2 concentrations
trate photolysis in the clean marine boundary layer has been         are typically low. However, when dust is transported to ur-
observed during the 2013 NOMADSS aircraft measurement                ban areas, this source of HONO may become significant. One
campaign over the North Atlantic Ocean (Ye et al., 2016).            study reported that TiO2 composed 0.75–1.58 µg m−3 when
Ground-based measurements of HONO made at Cabo Verde                 aerosol loadings were 250–520 µg m−3 over the same time
in the tropical Atlantic Ocean (Reed et al., 2017) provided          period in southeast Beijing, when air had been transported
evidence that a mechanism for renoxification in low-NOx ar-          from the Gobi desert (Schleicher et al., 2010).
eas is required (Reed et al., 2017; Ye et al., 2017a).                  In this study, the production of HONO on the surface of
   Recent model calculations show a missing daytime source           TiO2 particles in the presence of NO2 is investigated as a
of HONO, which is not consistent with known gas-phase pro-           function of NO2 mixing ratio, aerosol surface area density
duction mechanisms, direct emissions or dark heterogeneous           and relative humidity using an aerosol flow tube system cou-
formation (e.g. prevalent at night). It has been suggested that      pled to a photo-fragmentation laser-induced fluorescence de-
this source could be light driven and dependent on NO2 (Kl-          tector (Boustead, 2019). The uptake coefficient of NO2 to
effmann, 2007; Michoud et al., 2014; Spataro and Ianniello,          generate HONO is then determined, and a mechanistic inter-
2014; Lee et al., 2016).                                             pretation of the experimental observations is presented. The
   It is estimated that between 1604 and 1960 Tg yr−1 of             production of HONO directly in the absence of NO2 from the
dust particles are emitted into the atmosphere (Ginoux et            illumination of a mixed sample of nitrate and TiO2 aerosol
al., 2001). Titanium dioxide (TiO2 ) is a photocatalytic com-        is also presented. Using a similar apparatus, previous work
pound found in dust particles at mass mixing ratios of be-           had showed that TiO2 particles produce OH and HO2 radi-
tween 0.1 % and 10 % depending on the location where                 cals directly under UV illumination (Moon et al., 2019). The
the particles were suspended (Hanisch and Crowley, 2003).            atmospheric implications of these results and the role of pho-
When exposed to UV light (λ < 390 nm) TiO2 promotes an               tocatalysts for the formation of HONO are also discussed.
            −
electron (eCB  ) from the conduction band to the valence band,
leaving behind a positively charged hole (h+  VB ) in the valence    2     Method
band (Chen et al., 2012):
             −
TiO2 + hν → eCB + h+                                        (R1)     2.1    Overview of the experimental setup
                   VB ,
which can then lead to both reduction and oxidation reac-            The production of HONO from illuminated aerosol surfaces
tions of any surface-adsorbed gas-phase species such as NO2          is studied using an aerosol flow tube system coupled to
leading to HONO.                                                     a photo-fragmentation laser-induced fluorescence (PF-LIF)

Atmos. Chem. Phys., 21, 5755–5775, 2021                                               https://doi.org/10.5194/acp-21-5755-2021
J. E. Dyson et al.: HONO production from illuminated aerosols                                                               5757

cell which allows the highly sensitive detection of the OH         evaporation to and from the aerosol surfaces for the cho-
radical formed through photo-fragmentation of HONO into            sen RH, which was controlled within the range ∼ 10 %–70 %
OH and NO followed by laser-induced fluorescence (LIF)             RH. A portion of the aerosol flow was then passed through
detection at low pressure. The experimental setup used in          a high-efficiency particle filter (HEPA) fitted with a bypass
this investigation is described in detail in Boustead (2019), as   loop and bellows valve allowing control of the aerosol num-
well as similar systems having been used to measure HONO           ber concentration entering the aerosol flow tube. Previous
in the field (Liao et al., 2006; Wang et al., 2020), and there-    studies (George et al., 2013; Boustead, 2019) have shown
fore only a brief description of the setup is given here. A        the loss of aerosol to the walls of the flow tube to be negli-
schematic of the experimental setup is shown in Fig. 1.            gible. Aerosol size distributions were measured for aerosols
   All experiments were conducted at room temperature              exiting the flow tube using a scanning mobility particle sizer
(295 ± 3 K) using nitrogen (BOC, 99.998 %) or air (BOC,            (SMPS, TSI 3081) and a condensation particle counter (CPC,
21 ± 0.5 % O2 ) as the carrier gas. A humidified flow of           TSI 3775) which was calibrated using latex beads. Any
aerosols, ∼ 6 L min−1 (total residence time of 104 s in the        aerosol surface area not counted due to the upper diameter
flow tube), was introduced through an inlet at the rear of         range of the combined SMPS/CPC (14.6–661.2 nm, sheath
the aerosol flow tube (Quartz, 100 cm long, 11.5 cm i.d.),         flow of 3 L min−1 , instrumental particle counting error of
which was covered by a black box to eliminate the presence         10 %–20 %) was corrected for during analysis by assum-
of room light during experiments. A 15 W UV lamp (XX-              ing a log-normal distribution, which was verified for TiO2
15LW bench lamp, λpeak = 365 nm) was situated on the out-          aerosols generated in this manner (Matthews et al., 2014).
side of the flow tube to illuminate aerosols and promote the       However, the majority of aerosols, > 90 %, had diameters
production of HONO (half the length of the flow tube was il-       in the range that could be directly detected. In addition to
luminated, leading to an illumination time of 52 s). The con-      the experiments with single-component TiO2 , mixed ammo-
centration of HONO is measured by PF-LIF with sampling             nium nitrate/TiO2 and single-component ammonium nitrate
from the end of the flow tube via a protruding turret contain-     aerosols were also generated using the atomiser for inves-
ing a 1 mm diameter pinhole, through which the gas exiting         tigations of HONO production from nitrate aerosols without
the flow tube was drawn into the detection cell at 5 L min−1 .     NO2 present. An example of an aerosol size distribution from
The detection cell was kept at low pressure, ∼ 1.5 Torr, us-       this work for single-component ammonium nitrate aerosols,
ing a rotary pump (Edwards, E1M80) in combination with a           mixed ammonium nitrate/TiO2 and single-component TiO2
roots blower (Edwards, EH1200). All gas flows in the exper-        aerosols is shown in Fig. 2.
iment were controlled using mass flow controllers (MKS and
Brooks). The relative humidity (RH) and temperature of the         2.3   Detection of HONO
aerosol flow was measured using a probe (Rotronics HC2-S,
accuracy ±1 % RH) the former calibrated against the H2 O           As HONO is not directly detectable via LIF, it was nec-
vapour concentration measured by a chilled mirror hygrom-          essary to fragment the HONO produced into OH and NO
eter (General Eastern Optica) in the exhaust from the flow         (Liao et al., 2007), with detection of OH via LIF. A 355 nm
tube.                                                              photolysis laser (Spectron Laser Systems, SL803) with a
                                                                   pulse repetition frequency (PRF) of 10 Hz and pulse duration
2.2   Aerosol generation and detection                             ∼ 10 ns was used to fragment HONO into OH. This frag-
                                                                   mentation wavelength was chosen as HONO has a strong ab-
Solutions for the generation of TiO2 aerosol solutions were        sorption peak at ∼ 355 nm, leading to the breakage of the
prepared by dissolving 5 g of titanium dioxide (Aldrich            HO–NO bond to form NO and OH in their electronic ground
Chemistry 718467, 99.5 % Degussa, 80 % anatase : 20 % ru-          states (Shan et al., 1989). A Nd:YAG pumped dye probe
tile) into 500 mL of Milli-Q water. Polydisperse aerosols          laser (JDSU Q201-HD, Q series, Sirah Cobra Stretch) with
were then generated from this solution using an atomiser           a PRF of 5000 Hz was used for the detection of OH via
(TSI model 3076), creating a 1 L min−1 flow of TiO2 aerosol        the fluorescence assay by gas expansion (FAGE) technique,
particles in nitrogen hereafter referred to as the aerosol flow.   which employs the expansion of gas through a small pin-
This aerosol flow was then passed through a silica drying          hole into the detection cell. The OH radical was measured
tube (TSI 3062, capable of reducing 60 % RH incoming flow          using on-resonance detection by LIF via the excitation of the
to 20 % RH) to remove water vapour and then passed through         A2 6 + (ν 0 = 0) ← X2 5i (ν 00 = 0) Q1 (2) transition at 308 nm
a neutraliser to apply a known charge distribution and reduce      (Heard, 2006). A multi-channel plate (MCP) photomultiplier
loss of aerosols to the walls. After the neutraliser the aerosol   (Photek, MCP 325) equipped with an interference filter at
flow was mixed with both a dry and a humidified N2 flow            308 nm (Barr Associates, 308 nm, FWHM – 8 nm, ∼ 50 %
(controlled by mass flow controllers) to regulate the relative     transmission) was used to measure the fluorescence signal. A
humidity of the system by changing the ratio of dry to hu-         reference OH cell in which a large LIF signal could be gener-
mid nitrogen flows. A conditioning tube was then used to           ated was utilised to ensure the wavelength of the probe laser
allow for equilibration of water vapour adsorption and re-         remained tuned to the peak of the OH transition at 308 nm.

https://doi.org/10.5194/acp-21-5755-2021                                            Atmos. Chem. Phys., 21, 5755–5775, 2021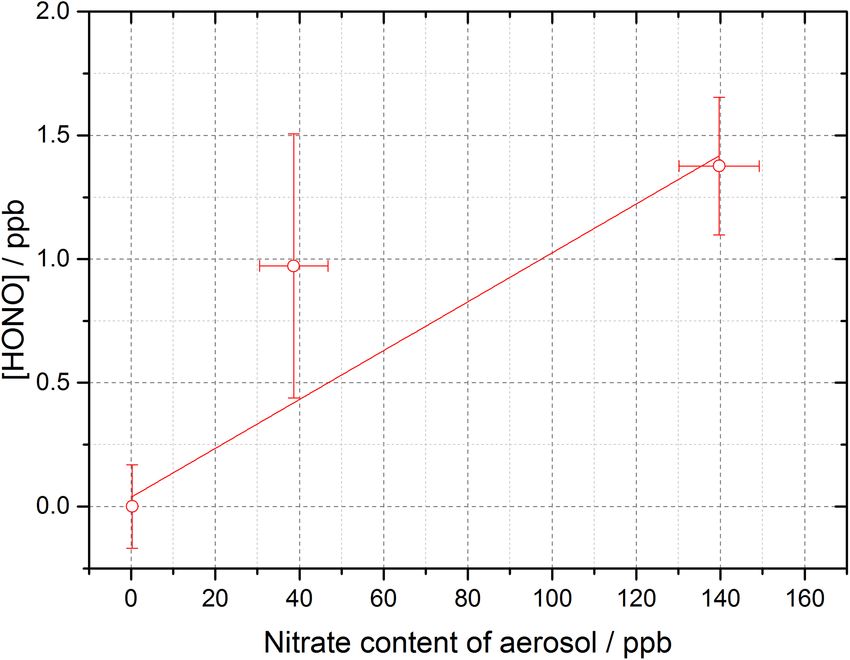
5758                                                            J. E. Dyson et al.: HONO production from illuminated aerosols

Figure 1. Schematic of the Leeds aerosol flow tube system coupled to a laser-fragmentation laser-induced fluorescence detector for HONO.
The paths of the 355 nm (blue) and 308 nm (purple, depicted as travelling out of the page perpendicular to the 355 nm light) light are also
shown. CPC: condensation particle counter; DMA: differential mobility analyser; HEPA: high-efficiency particle air filter; FAGE: fluores-
cence assay by gas expansion; MCP: microchannel plate photomultiplier; MFC: mass flow controller; RH/T : relative humidity/temperature
probe; SMPS: scanning mobility particle sizer.

                                                                        from the OH transition (by 0.02 nm), were taken to allow
                                                                        the signal generated from detector dark counts and scattered
                                                                        laser light to be measured and subtracted from the online sig-
                                                                        nal. To determine an absolute value of the HONO concentra-
                                                                        tion, [HONO], a calibration was performed, in order to con-
                                                                        vert from the HONO signal, SHONO , using SHONO = CHONO
                                                                        [HONO], as described fully in Boustead (2019). A glass cali-
                                                                        bration wand was used to produce OH and HO2 in equal con-
                                                                        centrations from the photolysis of water vapour at 185 nm:

                                                                                    λ=185 nm
                                                                        H2 O + hν     −→ OH + H,                                     (R7)
                                                                        H + O2 + M → HO2 + M.                                        (R8)

                                                                           An excess flow of NO was then added to generate HONO,
                                                                        which was then detected as OH in the cell. The excess flow of
Figure 2. Typical aerosol surface area distribution for pure am-        NO (BOC, 99.5 %) ensures rapid and complete conversion of
monium nitrate aerosols (green) and pure TiO2 aerosols (red) and        OH and HO2 to HONO. The concentration of OH and HO2
50 : 50 mixed nitrate/TiO2 aerosols (purple) measured after the
                                                                        produced, and therefore the amount of HONO produced in
flow tube.
                                                                        the wand, is calculated using

                                                                        [OH] = [HO2 ] = [H2 O] σH2 O φOH F t,                          (1)
OH measurements are taken both before and after each pho-
tolysis laser pulse, allowing measurement of any OH already             where [H2 O] is the concentration of water vapour in the
present in the gas flow to be determined as a background sig-           humidified gas flow, σH2 O is the absorption cross section
nal for subtraction. The OH generated from HONO photoly-                of H2 O at 185 nm 7.14 × 10⁻²⁰ cm2 molec.−1 (Cantrell et
sis was measured promptly (∼ 800 ns) after the 355 nm pulse             al., 1997), φOH is the quantum yield of OH for the photo-
to maximise sensitivity to OH before it was spatially diluted           dissociation of H2 O at 185 nm (= 1), F is the lamp flux and
away from the measurement region (Boustead, 2019). Offline              t is the irradiation time (the product of which is determined
measurements, with the probe laser wavelength moved away                using ozone actinometry (Boustead, 2019).

Atmos. Chem. Phys., 21, 5755–5775, 2021                                                    https://doi.org/10.5194/acp-21-5755-2021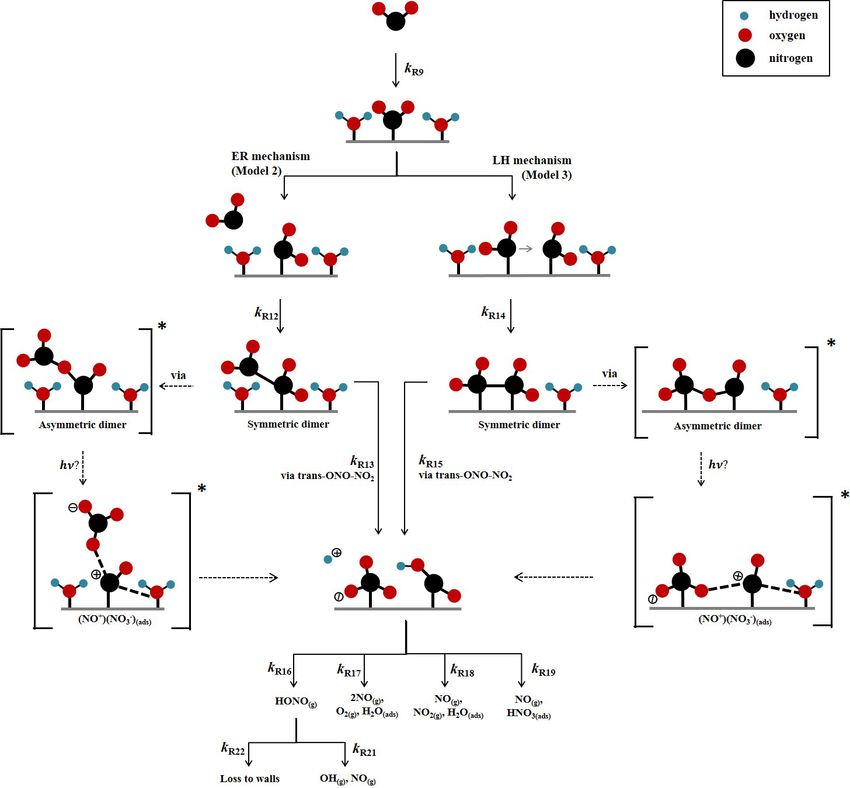
J. E. Dyson et al.: HONO production from illuminated aerosols                                                              5759

   A typical value of the calibration factor was CHONO =           surfaces. The HONO signal was averaged over 50 s (aver-
(3.63±0.51)×10−9 counts mW−1 for N2 , leading to a calcu-          age of 500 of the 355 nm photolysis laser pulses with a PRF
lated limit of detection of 12 ppt for a 50 s averaging period     of 10 Hz). Once aerosols were introduced into the flow tube
and a signal-to-noise ratio (SNR) of 1 (Boustead, 2019). The       system, a period of ∼ 30 min was allowed for equilibration
typical error in the HONO concentration was 15 % at 1σ , de-       and the measured aerosol surface area density to stabilise. In
termined by the error in the calibration.                          general, the relative humidity of the system was kept con-
                                                                   stant at RH ∼ 15 % for all experiments investigating HONO
2.4   Experimental procedure and data analysis                     production as a function of NO2 mixing ratio over the range
                                                                   34–400 ppb. In a number of experiments, however, RH was
The experiments were performed with a minimum flow of              varied in the range ∼ 12 %–37 %.
6 L min−1 through the aerosol flow tube, giving a Reynolds            The mixing ratio of NO2 entering the flow tube was cal-
number of ∼ 150, which ensured a laminar flow regime. The          culated using the concentration of the NO2 in the cylinder
HONO signal, converted to an absolute concentration using          and the degree of dilution. The NO2 mixing ratio within
a calibration factor, was measured over a range of aerosol         the cylinder was determined using a commercial instrument
surface area densities, both in the presence and absence of il-    based on UV–Vis absorption spectroscopy (Thermo Fisher
lumination, and background measurements without aerosols           42TL, limit of detection 50 pptv, precision 25 pptv). For each
present were also performed.                                       individual experiment, the mixing ratio of NO2 was kept
   The HONO signal originates from several sources: the il-        constant (within the range 34–400 ppb), and the aerosol sur-
luminated aerosol surface, the illuminated quartz flow tube        face area density was varied from zero up to a maximum of
walls, dark reactions on aerosol surfaces, dark reactions on       0.04 m2 m−3 , in order to obtain the HONO produced from
the flow tube surface, and finally from impurities in the NO2      illuminated aerosol surfaces in the flow tube for a given mix-
(Sigma Aldrich, > 99.5 %, freeze pump thawed to further re-        ing ratio of NO2 . As well as subtraction of any background
move any remaining NO or O2 ) and N2 flows (either HONO            HONO, a correction must be made for any loss of HONO
itself or a species which photolyses at 355 nm to give OH).        owing to its photolysis occurring within the flow tube.
Of interest here is the HONO production from both dark and            In order to determine the rate of photolysis of HONO, the
illuminated aerosol surfaces which is atmospherically rele-        rate of photolysis of NO2 was first determined using chem-
vant. Following transit through the flow tube, and in the pres-    ical actinometry, and the known spectral output of the lamp
ence of NO2 , the total concentration of HONO measured by          and the literature values of the absorption cross sections and
the PF-LIF detector is given by                                    photo-dissociation quantum yields for NO2 and HONO were
[HONO] = [HONO]illuminated      aerosols                           used to determine the rate of photolysis of HONO. When just
   + [HONO]illuminated walls + [HONO]dark aerosols                 flowing NO2 in the flow tube, the loss of NO2 within the illu-
                                                                   minated region is determined only by photolysis and is given
   + [HONO]dark walls + [HONO]impurities .                  (2)
                                                                   by
   Any HONO seen without the presence of aerosol was                 d [NO2 ]
therefore due to HONO impurities in the N2 or NO2 gas,             −          = j (NO2 )[NO2 ],                               (3)
                                                                        dt
the dark production of HONO from the flow tube walls or
from the production of HONO from the illuminated reac-             where j (NO2 ) is the photolysis frequency of NO2 for the
tor walls, which may include production from TiO2 aerosols         lamp used in these experiments. From the measured loss of
coating the flow tube in the presence of NO2 . This back-          NO2 in the illuminated region, and with knowledge of the
ground HONO concentration depended on the experimental             residence time, the photolysis frequency, j (NO2 ), was deter-
conditions and on how recently the flow tube and PF-LIF cell       mined to be (6.43 ± 0.30) × 10−3 s−1 for the set of experi-
had been cleaned to remove any build-up of TiO2 deposits.          ments using one lamp to illuminate the flow tube. j (NO2 ) is
However, the build-up of TiO2 on the flow tube walls was           given by
relatively slow, and back-to-back measurements were made                        Zλ2
in the presence and absence of aerosols to obtain an accu-         j (NO2 ) =         σλ φλ Fλ dλ,                            (4)
rate background. Additional experiments showed no signif-
                                                                                λ1
icant production of HONO on TiO2 aerosol surfaces with-
out the presence of NO2 . Even though the aerosol surface          where λ1 and λ2 represent the range of wavelengths over
area density (∼ 0.02 m2 m−3 ) was small compared to the sur-       which the lamp emits, and σλ and φλ are the wavelength-
face area density of the reactor walls (35 m2 m−3 ), very little   dependent absorption cross section and photo-dissociation
HONO signal was produced without the presence of aerosols          quantum yield of NO2 , respectively, and Fλ is the flux of the
and was always subtracted from the signal in the presence          lamp at a given wavelength. The flux of the lamp, the spectral
of aerosols. The HONO signal was measured both with the            intensity of which was measured using a spectral radiome-
lamp on and off for each aerosol surface area density to in-       ter (Ocean Optics QE65000) as a function of wavelength, is
vestigate the production of HONO from illuminated aerosol          shown in Fig. 3.

https://doi.org/10.5194/acp-21-5755-2021                                                Atmos. Chem. Phys., 21, 5755–5775, 2021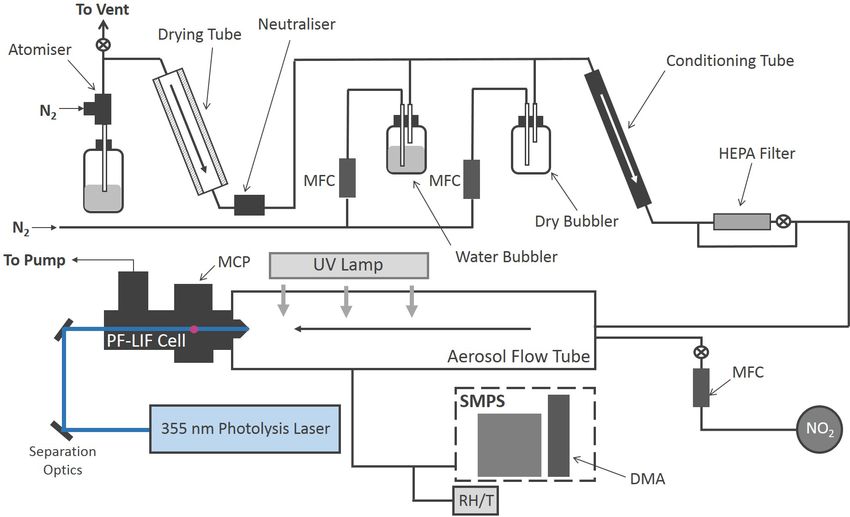
5760                                                          J. E. Dyson et al.: HONO production from illuminated aerosols

Figure 3. UVA emission spectrum for the 15 W bench lamp             Figure 4. Pseudo-first-order rate coefficient for HONO produc-
used in these experiments between 290–400 nm. The inte-             tion, k (open circles), as a function of aerosol surface area
grated photon flux over this wavelength range is (1.63 ± 0.09) ×    for [NO2 ] = 200 ppb and RH = 15 ± 1 %, T = 293 ± 3 K, and
1016 photons cm−2 s−1 determined from the measured j (NO2 ) of      a photolysis time of 52 ± 2 s. The red line is a linear-least-
(6.43 ± 0.30) × 10−3 s−1 .                                          squares fit including 1σ confidence bands (dashed lines) weighted
                                                                    to both x and y errors (1σ ), the gradient of which yields
                                                                    γNO2 →HONO = (2.17 ± 0.09) × 10−5 , with the uncertainty repre-
   From the measured j (NO2 ), and with knowledge of σλ             senting (1σ ). The non-zero y-axis intercept is due to a back-
and ϕλ for NO2 , the flux of the lamp was determined                ground HONO signal owing to the presence of a HONO im-
to be (1.63 ± 0.09) × 1016 photons cm−2 s−1 integrated over         purity in the NO2 cylinder, which is not subtracted. The total
the 290–400 nm wavelength range of the lamp. Using                  photon flux of the lamp (see Fig. 2 for its spectral output) =
this flux, and the known σλ and ϕλ for HONO over the                (1.63 ± 0.09) × 1016 photons cm−2 s−1 .
same wavelength range, j (HONO) was determined to be
(1.66 ± 0.10) × 10−3 s−1 .
   In the presence of aerosols under illuminated conditions,          The reactive uptake coefficient of NO2 to generate HONO,
the rate of heterogeneous removal of NO2 at the aerosol sur-        γNO2 →HONO , defined as the probability that upon collision
face to generate HONO is given by                                   of NO2 with the TiO2 aerosol surface a gas-phase HONO
                                                                    molecule is generated, is given by
    d [NO2 ]
−            = k[NO2 ],                                     (5)                       4×k
       dt                                                           γNO2 →HONO =            ,                                    (7)
where k is the pseudo-first-order rate coefficient for loss of                       ν × SA
NO2 at the aerosol surface, which leads to the generation           where√ ν is the mean thermal velocity of NO2 , given by
of HONO. The postulated mechanism for HONO production               ν = ((8RT )/(π M)) with R, T and M as the gas constant,
from NO2 is discussed in Sect. 3.3.2 below, but for the defi-       the absolute temperature and the molar mass of NO2 , respec-
nition of k it is assumed to be a first-order process for NO2 .     tively; SA is the aerosol surface area density (m2 m−3 ); and
Integration of Eq. (5) gives                                        k is defined as above. Rearrangement of Eq. (7) gives

       ln [NO2 ][NO
                 0 −[HONO]t
                     2 ]0
                                                                         γNO2 →HONO × SA × ν
k=−                           ,                            (6)      k=                       .                                   (8)
                   t                                                              4
where [NO2 ]0 −[HONO]t is the concentration of NO2 at time            Figure 4 shows the variation of k,determined from Eq. (6)
t, assuming that each NO2 molecule is quantitatively con-           above with t = 52 s (illumination time in the flow tube),
verted to a HONO molecule following surface uptake (see             against aerosol surface area density, SA, for [NO2 ]0 =
Sect. 3.3.2 for the proposed mechanism), and [NO2 ]0 is the         200 ppb and RH = 15 %, from which the gradient using
initial concentration of NO2 . Hence k can be determined            Eq. (8) yields γNO2 →HONO = (2.17 ± 0.09) × 10−5 .
from Eq. (6) using the measurement of the concentration of            The uncertainty in k (∼ 20 %) shown in Fig. 4 and deter-
HONO, [HONO], that has been generated from TiO2 aerosol             mined by Eq. (6) is mainly controlled by the uncertainty in
surfaces for an illumination time of t (and after subtraction       the HONO concentration (the HONO signal typically varies
of any background HONO produced from other sources and              between repeated runs for a given SA by ∼ 10 % coupled
after correction for loss via photolysis; see above) and with       with the 15 % error in the calibration factor), the initial NO2
knowledge of [NO2 ]0 .                                              mixing ratio (10 %), and the photolysis time, t (∼ 3 %). The

Atmos. Chem. Phys., 21, 5755–5775, 2021                                               https://doi.org/10.5194/acp-21-5755-2021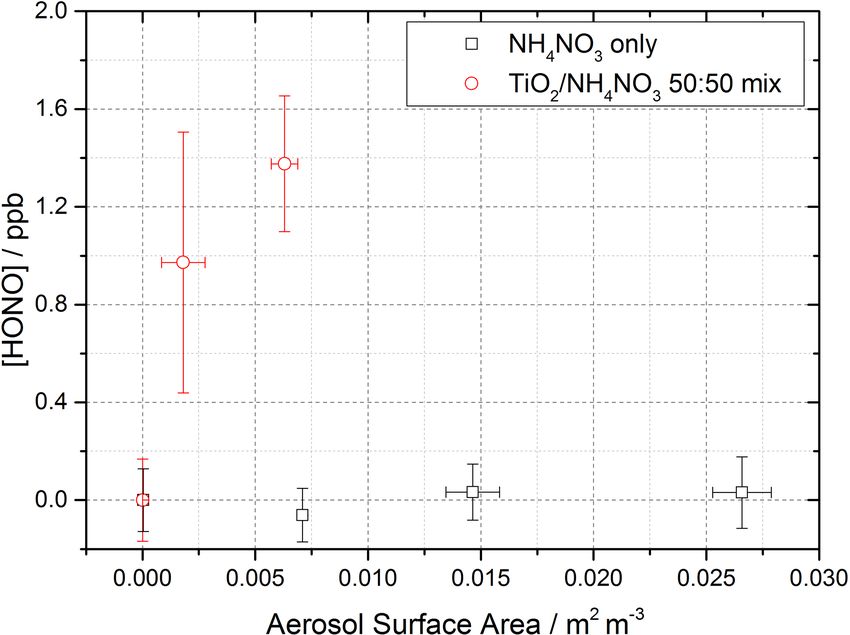
J. E. Dyson et al.: HONO production from illuminated aerosols                                                               5761

uncertainty in SA is determined by the uncertainty in the         trans-ONO-NO2 to form (NO+ )(NO−       3 ), which is represented
SMPS (15 %). The error in the value of γNO2 →HONO (typi-          by Reactions (R13) and (R15) in Model 2 and Model 3 re-
cally 20 %) is calculated from the 1σ statistical error of the    spectively. (NO+ )(NO−  3 ) can then react rapidly with surface-
weighted fit shown in Fig. 4. An experiment performed us-         adsorbed water, leading to HONO formation (Varner et al.,
ing air yielded an uptake coefficient value within 7 % of the     2014).
equivalent experiment done in N2 , which is well within the          A schematic of the proposed mechanism investigated with
experimental error.                                               Model 2 and Model 3 is shown in Fig. 5 and consists of (i) the
                                                                  adsorption of NO2 onto a surface site, (ii) the conversion of
2.5   Box model description                                       NO2 to form HONO via the formation of an NO2 dimer inter-
                                                                  mediate on the surface via either a Eley–Rideal or Langmuir–
A kinetic scheme within the framework of a box model was          Hinshelwood-type mechanism, (iii) subsequent desorption of
used together with the differential equation solver Facsimile     HONO from the surface, and finally (iv) competitive removal
4.3.53 (MCPA Software Ltd., 2020) to investigate the mech-        processes for HONO both on the surface and in the gas phase
anism of NO2 adsorption on TiO2 in the presence of light          that are either dependent or independent on the NO2 mixing
to produce HONO. The models were only semi-explicit, fo-          ratio. The model includes the gas-phase photolysis of NO2
cusing on determining the stoichiometric amounts of NO2           and HONO and the gas-phase reactions of both HONO and
needed to produce a single HONO molecule in the gas phase         NO2 with OH and O(3 P) atoms.
for comparison with the experimental dependence of HONO              To the best of our knowledge neither the enthalpy of ad-
production upon NO2 mixing ratio and to provide a pre-            sorption of NO2 onto a TiO2 surface nor the bimolecular rate
dictive framework for parameterising the HONO production          coefficients for the chemical steps on the surface shown in
rate with NO2 mixing ratio in the atmosphere. Three model         Fig. 5 have been determined. Hence, for each of the steps a
scenarios were designed. The simplest model (Model 1) con-        rate coefficient (s−1 or cm3 molec.−1 s−1 ) was assigned, as
sidered only the adsorption of a single molecule of NO2 to        given in Table 1, and with the exception of the experimen-
the TiO2 surface, the surface conversion to HONO in the           tally determined j (NO2 ) and the calculated j (HONO), and
presence of light and subsequent desorption of HONO – the         the gas-phase rate coefficients which are known, the rate co-
latter was assumed to occur rapidly. The two further model        efficients were estimated, with the aim of reproducing the
scenarios investigated the effect of a 2 : 1 stoichiometric re-   experimental NO2 dependence of the HONO production and
lationship between the NO2 adsorbed to the surface of TiO2        NO2 reactive uptake coefficient; justification of chosen val-
and the HONO produced, via the formation of an NO2 dimer.         ues is given below.
Model 2 incorporated an Eley–Rideal mechanism reliant on             The modelled Gibbs free energy barrier for the isomeri-
the adsorption of one NO2 molecule to the surface followed        sation of N2 O4 to form the asymmetric ONO-NO2 isomer
by the subsequent adsorption of a second NO2 molecule di-         (cis or trans conformation not specified) was estimated by
rectly onto the first (Fig. 5). Model 3, however, features a      Pimental et al. (2007) to be 87 kJ mol−1 with a rate coeffi-
Langmuir–Hinshelwood mechanism of adsorption in which             cient as large as 2 × 10⁻³ s−1 in the aqueous phase at 298 K,
two NO2 molecules adsorb to the surface and then diffuse          stated in the study to confirm the Finlayson-Pitts model for
to one another before colliding on the surface and form-          the hydrolysis of NO2 on surfaces via the asymmetric trans-
ing the cis-ONO-NO2 dimer (Finlayson-Pitts et al., 2003;          ONO-NO2 dimer (Finlayson-Pitts et al., 2003). Using this
de Jesus Madeiros and Pimentel, 2011; Liu and Goddard,            study as a guide, we estimated kR13 and kR15 as 5 × 10⁻³ s−1 ,
2012; Varner et al., 2014). The formation of the asymmet-         slightly larger than that estimated by Pimental et al. (2007)
ric cis-ONO-NO2 dimer followed by isomerisation to form           due to the presence of light. A study into the decomposi-
the asymmetric trans-ONO-NO2 dimer has been suggested             tion of HONO on borosilicate glass surfaces suggested a
to have an enthalpic barrier that is ∼ 170 kJ mol−1 lower than    rate coefficient for the loss HONO on the non-conditioned
for direct isomerisation to trans-ONO-NO2 from the sym-           chamber walls to be (1.0 ± 0.2) × 10−4 s−1 increasing to
metric N2 O4 dimer (Liu and Goddard, 2012). The dimeri-           (3.9 ± 1.1) × 10−4 s−1 when HNO3 was present on the walls
sation of NO2 and subsequent isomerisation to form trans-         (Syomin and Finlayson-Pitts, 2003). From this we estimated
ONO-NO2 has been suggested under dark conditions to lead          a light-accelerated loss rate coefficient of 1 × 10⁻³ s−1 for
to the formation of both HONO and HNO3 in the presence of         the loss of HONO(ads) by reaction with itself, kR18 , and
water vapour (Finlayson-Pitts et al., 2003; de Jesus Madeiros     through reaction with HNO3(ads) , kR17 . Both of these reac-
and Pimentel, 2011; Liu and Goddard, 2012; Varner et al.,         tions will occur on the surface of the aerosol. We make the
2014). Although the interaction of light with TiO2 with the       assumption that the rate of loss of HONO to the walls of
concomitant production of electron–hole pairs (Reaction R1)       the chamber for this experiment is less than that of the het-
is central to HONO formation, we do not specify here the          erogeneous loss reactions on the photocatalytic aerosol sur-
exact mechanism by which the electron–hole pairs interact         face, leading to a kR22 of 1 × 10⁻⁴ s−1 as reported by Syomin
with surface-bound species to generate HONO. We propose           and Finlayson-Pitts (2003). For kR12 -kR15 , initial values were
that the interaction with light speeds up the autoionisation of   adopted and were then adjusted to fit the shape of the trend

https://doi.org/10.5194/acp-21-5755-2021                                           Atmos. Chem. Phys., 21, 5755–5775, 2021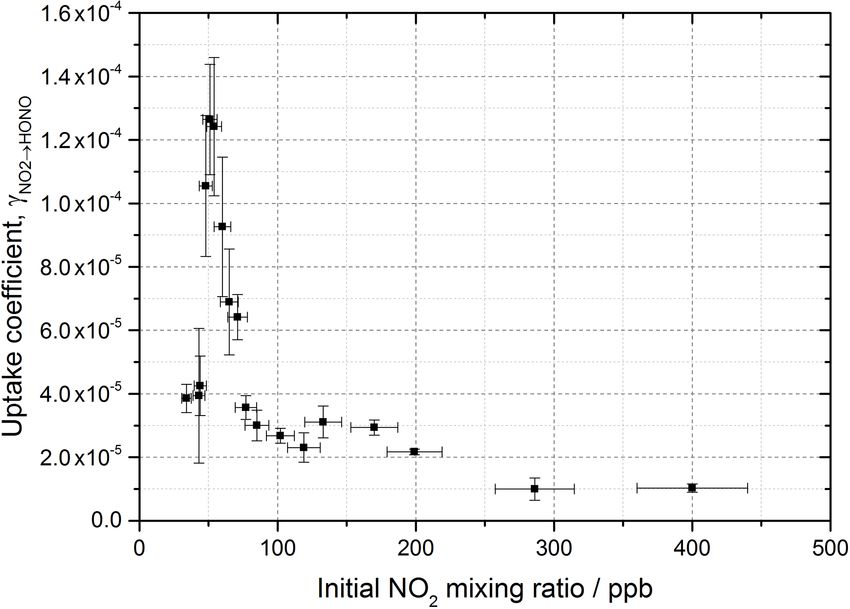
5762                                                           J. E. Dyson et al.: HONO production from illuminated aerosols

Figure 5. Schematic diagram of proposed mechanism of uptake of NO2 on an aerosol surface in the presence of water to form HONO. Both
Eley–Rideal, Model 2, and Langmuir–Hinshelwood, Model 3, mechanisms are shown with relevant estimated and calculated rate coefficients
used in the models. NO2 -dependent and independent loss reactions of HONO are also depicted. Nitrogen is shown in black, oxygen is shown
in red and hydrogen is shown in blue. ∗ denotes intermediate steps of the isomerisation of symmetric N2 O4 to trans-ONO-NO2 , which is
then predicted to form HONO.

in experimental results of [HONO] and γNO2 →HONO versus               the model to reproduce the trend in the experimental results
[NO2 ], discussed fully in Sect. 3.3.2. For completeness, gas-        of [HONO] versus [NO2 ], discussed fully in Sect. 3.3.2.
phase loss reactions of HONO and NO2 with OH and the
reactions of O(3 P) with NO, NO2 and O2 were also included
in the model, Reactions (R23)–(R27), though their inclusion           3     Results and discussion
had no effect on the HONO concentration. The rates of Re-
actions (R23)–(R27) within the model are much smaller than            3.1    HONO production from TiO2 aerosol surfaces in
HONO loss reactions on the surface, Reactions (R17)–(R19),                   the presence of NO2
and the photolysis Reaction (R21). For both Model 2 and
Model 3, the adsorption of an NO2 molecule to the surface,            The production of HONO on TiO2 aerosol surfaces was mea-
kR9 , was assumed to be rapid and not the rate-determining            sured as a function of the initial NO2 mixing ratio. Figure 6
step. Likewise, the desorption of HONO was also assumed               shows the dependence of the HONO concentration, mea-
to be rapid – faster than the loss rates of adsorbed HONO but         sured at the end of the flow tube, on the initial NO2 mixing ra-
slower than the adsorption of NO2 ; this was necessary for            tio for an aerosol surface area of (1.6 ± 0.8) × 10−2 m2 m−3 .
                                                                      A sharp increase in HONO production at a low mixing ratio
                                                                      of NO2 was seen, followed by a more gradual reduction in

Atmos. Chem. Phys., 21, 5755–5775, 2021                                                  https://doi.org/10.5194/acp-21-5755-2021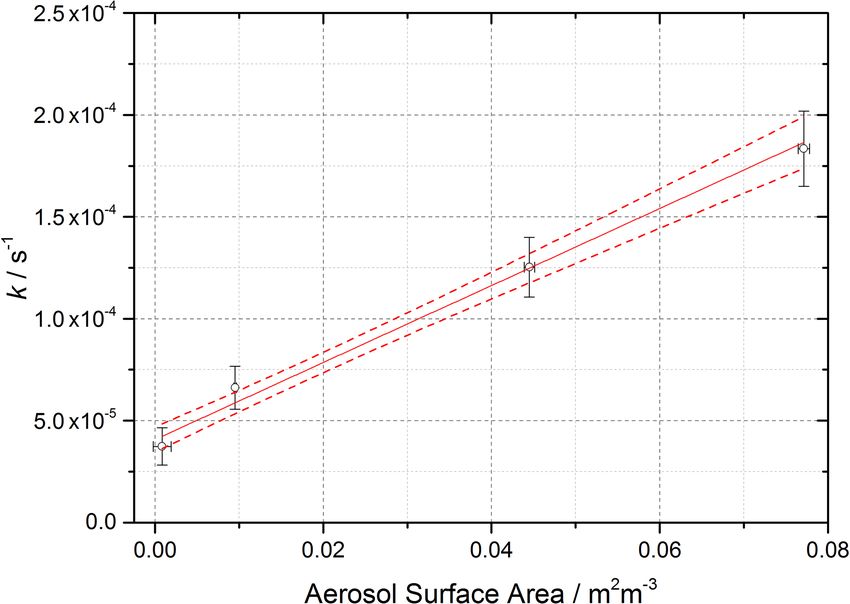
J. E. Dyson et al.: HONO production from illuminated aerosols                                                                                              5763

Table 1. Reactions included in the chemical mechanism used to model NO2 uptake onto TiO2 aerosols. All rate coefficients are estimated,
as described in Sect. 2.5, with the exception of the NO2 and HONO photolysis rate coefficient and the gas-phase rate coefficient which are
known.

                  Reactions                                                                                                     Rate coefficientd
                  Model 1
                  (R9)        NO2(g) + surface → NO2(ads)                                                                                 1 × 10⁻³
                  (R10)       NO2(ads) → HONO(ads)                                                                                        1 × 10⁻³
                  (R11)       HONO(ads) → HONO(g)                                                                                         1 × 10⁻²
                  Models 2 and 3
                  Model 2 only – Eley–Rideal mechanism
                  (R12)       NO2(g) + NO2(ads) → NO2 − NO2(ads)                                                                          1 × 10⁻²
                                                    via trans-ONO-NO2
                  (R13)       NO2 − NO2(ads)                −→             HONO(ads) + HNO3(ads)                                          5 × 10⁻³
                  Model 3 only – Langmuir–Hinshelwood mechanism
                  (R14)       NO2(ads) + NO2(ads) → NO2(ads) − NO2(ads)                                                                   1 × 10⁻³
                                                          via trans-ONO-NO2
                  (R15)       NO2(ads) − NO2(ads)                 −→             HONO(ads) + HNO3(ads)                                    5 × 10⁻³
                  Common to both Model 2 and Model 3
                  (R9)        NO2(g) + surface → NO2(ads)                                                                                 1 × 10⁻¹
                  (R16)       HONO(ads) → HONO(g)                                                                                         5 × 10⁻²
                  (R17)       HNO3(ads) + HONO(ads) → 2NO(g) + O2(g) + H2 O(ads)                                                          1 × 10⁻³
                  (R18)       HONO(ads)
                                      + HONO(ads) → NO(g) + NO2(g) + H2 O(ads)                                                          1 × 10⁻³
                  (R19)       NO2(g) or species such as NO+
                                                          2 + HONO(ads) → NO(g) + HNO3(ads)                                               5 × 10⁻³
                                                                                                                                                     a
                  (R20)       NO2(g) + hν → NO(g) + O(3 P)(g)                                                                            6 × 10⁻³
                                                                                                                                                     b
                  (R21)       HONO(g) + hν → OH(g) + NO(g)                                                                              2 × 10⁻³
                  (R22)       HONO(g) → wall loss                                                                                        1 × 10⁻⁴
                                                                                                                                                 c
                  (R23)       HONO(g) + OH(g) → NO2(g) + H2 O(g)                                                                     4.5 × 10⁻¹²
                                                     M                                                                                               c
                  (R24)       NO2(g) + OH(g) −→ HNO3(g)                                                                                1 × 10⁻¹¹
                                                                                                                                                c
                  (R25)       O(3 P)(g) + NO2(g) → O2(g) + NO(g)                                                                       1 × 10⁻¹¹
                                                      M                                                                                              c
                  (R26)       O(3 P)(g) + O2(g) −→ O3                                                                                1.5 × 10⁻¹⁴
                                                       M                                                                                             c
                  (R27)       O(3 P)(g) + NO(g) −→ NO2(g)                                                                            1.7 × 10⁻¹²
                a Measured using chemical actinometry with the knowledge of the experimentally determined spectral output of the lamp and the cross
                sections and quantum yields of NO2 and HONO; see Sect. 2.4 for more detail. b Calculated using a photon flux of
                (1.63 ± 0.09) × 1016 photons cm−2 s−1 . c Sander et al. (2003). d Rate coefficients are in the units of s−1 for first-order processes or
                cm3 molec.−1 s−1 for second-order processes. T for all k values is 298 K.

HONO production after a peak production at ∼ 54 ± 5 ppb                                in HONO production was seen for both NO2 mixing ratios
NO2 .                                                                                  studied after ∼ 30 % RH.
   Figure 7 shows the HONO concentration measured at the                                  A dependence of HONO production upon RH was ex-
end of the flow tube over a range of RH values for a fixed                             pected due to the potential role of water as a proton donor in
aerosol surface area density of (1.59 ± 0.16 × 10⁻² m2 m−3 )                           the production mechanism of HONO on TiO2 surfaces (Re-
and at two NO2 mixing ratios, displaying a peak in HONO                                actions R2 and R5, as shown in Fig. 5) (Dupart et al., 2014).
production between 25 %–30 % RH. Above ∼ 37 % RH, for                                  The fractional surface coverage of water on the TiO2 aerosol
experiments including single-component TiO2 aerosols, it                               core, V /Vm , at 15 % RH and above was calculated using the
was found that significant aerosols were lost from the system                          parameterisation below, which was determined using trans-
before entering the flow tube, speculated to be due to loss
to the walls of the Teflon lines. As such the RH dependence
was only studied up to 37 % RH; however, a clear drop-off

https://doi.org/10.5194/acp-21-5755-2021                                                                       Atmos. Chem. Phys., 21, 5755–5775, 2021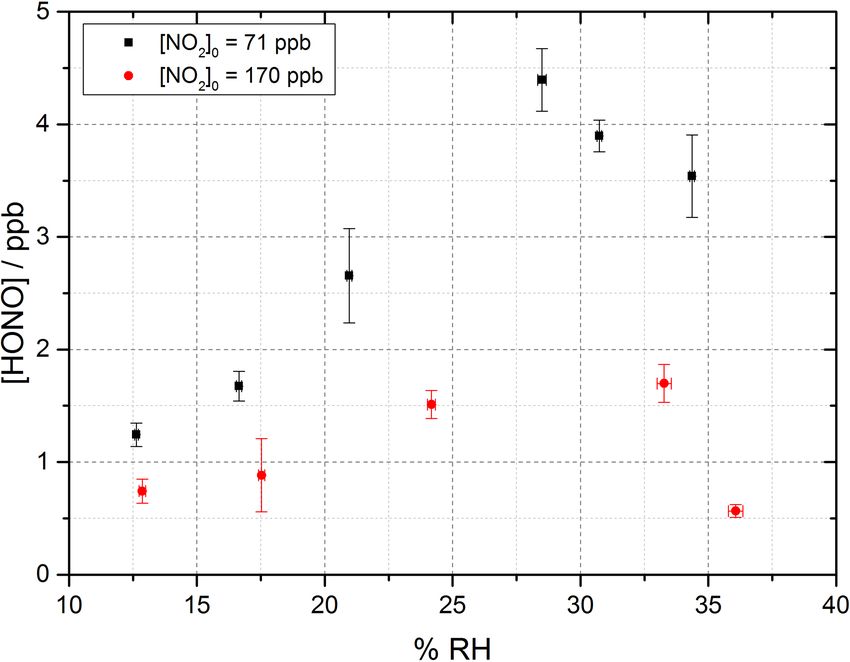
5764 J. E. Dyson et al.: HONO production from illuminated aerosols
mission IR spectroscopy (Goodman et al., 2001):
V c PP0
=
Vm 1− P P0
n
n+1
P
1 − (n + 1) + n PP0
P0
n+1 , (9)
P P
1 + (c − 1) P0 − c P0
where V is the volume of water vapour adsorbed at equilib-
rium pressure P , Vm is the volume of gas necessary to cover
the surface of TiO2 particles with a complete monolayer,
P0 is the saturation vapour pressure, c is the temperature-
dependent constant related to the enthalpies of adsorption of
the first and higher layers (taken as 74.8 kJ mol−1 for TiO2 ,
Figure 6. HONO concentration measured at the end of the flow tube
Goodman et al., 2001), and n is the asymptotic limit of mono-
as a function of the initial NO2 mixing ratio, for the aerosol sur- layers (eight for TiO2 , Goodman et al., 2001) at large values
face area density of (1.6 ± 0.8) × 10−2 m2 m−3 , relative humidity of P /P0 .
of 15 ± 1 %, photon flux of (1.63 ± 0.09) × 1016 photons cm−2 s−1 At 15 % RH, a fractional water coverage of 1.09 was cal-
(290–400 nm wavelength range), reaction time of 52 seconds and culated to be present on the surface, increasing to 1.50 at
N2 carrier gas. Each point is an average of up to 20 measurements 35 % RH. It has been shown in previous work that HONO
at the same aerosol surface area and mixing ratio of NO2. The can be displaced from a surface by water, leading to an in-
highest concentration of HONO measured was 0.90 ± 0.12 ppb at crease in gas-phase HONO with RH (Syomin and Finlayson-
[NO2 ] = 54 ± 5 ppb. The y error bars represent 1σ , while the x er- Pitts, 2003). The increase in HONO with RH to ∼ 25 %–
ror bars represent the sum in quadrature of the errors in the N2 and 30 % RH could therefore be attributed to both an increase
NO2 gas flows and the NO2 dilution. The SA varied over the exper-
in the concentration of the water reactant leading to more
iments at different NO2 mixing ratios leading to a larger error in the
quoted SA.
HONO formation and the increase in displacement of HONO
from the surface due to preferential adsorption of water. A
decrease in HONO production seems to occur above ∼ 30 %
RH, which could be due to the increased water adsorption in-
hibiting either NO2 adsorption or the electron–hole transfer
process (Gustafsson et al., 2006). H2 O vapour adsorption is
likely enhanced by the superhydrophilic properties of TiO2
surfaces under UV radiation, meaning that water monolayers
form more quickly on the surface of TiO2 owing to light-
induced changes in surface tension (Takeuchi et al., 2005;
Gustafsson et al., 2006).
At the higher initial concentration of NO2 = 170 ppb, the
RH dependence showed a similar peak in HONO produc-
tion between ∼ 25 %–30 % RH, but less HONO was pro-
duced overall, as expected from Fig. 6 given the higher NO2 .
Previous work on the production of HONO from suspended
TiO2 aerosols reported a strong RH dependence of the up-
take coefficient, γ , of NO2 to form HONO with a peak
at ∼ 15 % RH and decreasing at larger RH (Gustafsson et
al., 2006). The same trend for the NO2 uptake coefficient
Figure 7. RH dependence of HONO production from illuminated
TiO2 aerosol surfaces at 295 K in N2 at 71 (black) and 170 (red) ppb was observed by Dupart et al. (2014) on Arizona test dust
initial NO2 mixing ratio. The aerosol surface area density was (ATD) aerosols with a peak in γ at ∼ 25 % RH. This in-
kept constant at (1.59 ± 0.16) × 10−2 m2 m−3 with a photon flux crease in the RH at which the uptake coefficient for NO2
of (1.63 ± 0.09) × 1016 photons cm−2 s−1 and an illumination time in going from TiO2 to ATD aerosols was ascribed to the
of 52 ± 2 s. The error bars represent 1σ . lower concentration of TiO2 present in ATD aerosols as op-
posed to single-component TiO2 aerosols used by Gustafs-
son et al. (2006) as well as by differences in particle size dis-
tribution. Gustafsson et al. (2006) reported a larger aerosol
Atmos. Chem. Phys., 21, 5755–5775, 2021 https://doi.org/10.5194/acp-21-5755-2021J. E. Dyson et al.: HONO production from illuminated aerosols 5765
size distribution with a bimodal trend with mode diameters
of ∼ 80 and ∼ 350 nm for single-component TiO2 aerosols,
whereas Dupart et al. (2014) reported a smaller unimodal
aerosol size distribution for ATD aerosols with a mode di-
ameter of ∼ 110 nm. In this work we also see a larger aerosol
size distribution, with a lower mode diameter of ∼ 180 nm
similar to Dupart et al. (2014) but for pure TiO2 aerosols
(aerosol size distribution shown in Fig. 2). Similar to the re-
sults of Dupart et al. (2014) we observe a trend inversion in
[HONO] vs. RH at higher RH, between 25 %–30 %. An in-
crease in HONO as a function of RH has also been observed
on TiO2 -containing surfaces (Langridge et al., 2009; Gan-
dolfo et al., 2015; Gandolfo et al., 2017) with a similar profile
for the observed RH dependence of HONO being observed
by Gandolfo et al. (2015) from photocatalytic paint surfaces
with a maximum in HONO mixing ratio found at 30 % RH. Figure 8. Experimental results showing the reactive uptake coef-
In comparison, a study focusing on the products of the up- ficients of NO2 to form HONO, γNO2 →HONO , onto TiO2 aerosol
take of NO2 on TiO2 surfaces showed a maximum in the surfaces as a function of the initial NO2 mixing ratio. All exper-
gas-phase HONO yield at 5 % RH, with the yield of HONO iments were conducted in N2 at 295 K at 15 ± 1 % RH, a photon
plateauing off with further increase in humidity (Bedjanian flux of (1.63 ± 0.09) × 1016 photons cm−2 s−1 and an illumination
and El Zein, 2012). time of 52 ± 2 s. γNO2 →HONO was determined for each NO2 mix-
ing ratio from the gradient of the pseudo-first-order rate coefficient
3.2 Dependence of reactive uptake coefficient on initial for HONO production, k, versus aerosol surface area density varied
NO2 mixing ratio from 0–0.04 m2 m−3 (e.g. as shown in Fig. 4) and Eq. (8).
The reactive uptake coefficient, γNO2 →HONO for
(2.68 ± 0.23) × 10−5 ). The γNO2 →HONO we determine is 27
NO2 →HONO, on TiO2 aerosol particles was determined
times smaller than reported by Gustafsson et al. (2006). This
experimentally for 18 different initial NO2 mixing ratios and
difference is mostly due to the lower experimental photon
is shown in Fig. 8. For each initial NO2 mixing ratio, the
flux in our setup, ∼ 19 times less at λmax = 365 nm owing
gradient of the first-order rate coefficient for HONO produc-
to the use of one 15 W UV lamp to irradiate the flow tube
tion, k, as a function of aerosol surface area density (e.g.
(Boustead, 2019) compared to Gustafsson et al. (2006), who
Fig. 4) and in conjunction with Eq. (8) was used to obtain
utilised four 18 W UV lamps.
γNO2 →HONO . The uptake coefficient initially increases with
The origins of the increase in γNO2 →HONO , together with
NO2 , reaching a peak at γNO2 →HONO = (1.26±0.17)×10−4
reaching a maximum, and the subsequent decrease at larger
for an initial NO2 mixing ratio of 51 ± 5 ppb, before sharply
NO2 mixing ratios were investigated using the kinetic box
decreasing as the NO2 mixing ratio continues to increase
model and postulated mechanism for HONO production de-
above this value.
scribed in Sect. 2.5. The aim was to compare the observed
The increase in uptake coefficient with NO2 at low
production of HONO and γNO2 →HONO with the modelled
NO2 (< 51 ppb) has not been seen previously in studies of
values, as a function of NO2 mixing ratio. The skill of the
HONO production from TiO2 -containing aerosols with sim-
model to reproduce the observed behaviour enables a vali-
ilar [NO2 ] ranges (Gustafsson et al., 2006; Ndour et al.,
dation of the postulated mechanism for HONO production,
2008; Dupart et al., 2014) or with other aerosol surfaces
and variation of the kinetic parameters enables the control-
(Bröske et al., 2003; Stemmler et al., 2007) or TiO2 sur-
ling influence of different steps in the mechanism on HONO
faces (El Zein and Bedjanian, 2012b). It is worth noting that
production to be evaluated.
several of these studies reported the overall uptake of NO2
onto aerosol surfaces and not specifically the uptake to form 3.3 Modelling the HONO production mechanism on
HONO, although HONO was indirectly measured in all stud- illuminated TiO2 aerosol surfaces
ies noted here (Gustafsson et al., 2006; Ndour et al., 2008;
Dupart et al., 2014). For single-component TiO2 aerosols, The HONO production on illuminated TiO2 aerosol surfaces
Gustafsson et al. (2006) reported a uptake coefficient, γNO2 , was investigated for each of the mechanisms outlined in Ta-
of 9.6 × 10⁻⁴ at 15 % RH and 100 ppb NO2 . Taking into ble 1.
account the HONO yield of 0.75 given by Gustafsson et
al. (2006), an estimated γNO2 →HONO = 7.2 × 10⁻⁴ is de-
termined and can be compared to the value observed in
this work at 15 % RH and 100 ppb NO2 , (γNO2 →HONO =
https://doi.org/10.5194/acp-21-5755-2021 Atmos. Chem. Phys., 21, 5755–5775, 20215766 J. E. Dyson et al.: HONO production from illuminated aerosols
3.3.1 Model 1
Model 1 (see Table 1 and Fig. 5), which contains the sim-
plest mechanism, was designed to reproduce the decreas-
ing value of the NO2 uptake coefficient to form HONO,
γNO2 →HONO , with increasing NO2 and also the plateauing
at higher NO2 mixing ratios caused by NO2 reaching a max-
imum surface coverage, as seen by Stemmler et al. (2007).
A decrease in the uptake coefficient of NO2 , γNO2 , onto dust
aerosol surfaces was also seen in studies where the forma-
tion of HONO from NO2 uptake was not directly studied
(Ndour et al., 2008; Dupart et al., 2014). The mechanism for
Model 1 which is given in Table 1 describes the adsorption
of one NO2 molecule to a surface site which then undergoes
the reaction which forms HONO, followed by desorption of
HONO to the gas phase, Reactions (R9)–(R11). Any repre-
sentation of the specific chemical processes which convert
NO2 to HONO on the surface following the initial photo-
production of electron–hole pairs in the TiO2 structure (Re- Figure 9. Model 1 calculations for (a) the concentration of
HONO and (b) the reactive uptake coefficient to form HONO,
action R2) was not included here as the primary focus was to
γNO2 →HONO , as a function of NO2 mixing ratio for a model run
produce the relationship between γNO2 →HONO and the NO2
time of 52 s. The estimated rate coefficients used in this model are
mixing ratio. Gustafsson et al. (2006) reported that the mea- shown in Table 1.
sured rate of photo-induced HONO production is 75 % that
of the rate of NO2 removal, whereas the dark disproportiona-
tion reaction (Reaction R28) would predict a 50 % yield, and considered in the model in order to try to reproduce this be-
hence that the HONO observed in their studies is not simply haviour.
a photo-enhancement of
3.3.2 Model 2 and Model 3 – investigating the role of
2NO2(ads) + H2 O(ads) → HONO(g) + HNO3(ads) . (R28) NO2 dimerisation for the surface formation of
HONO, and including additional surface losses of
Gustafsson et al. (2006) suggests that an oxidant on the HONO
surface is produced following the creation of the electron–
hole pair (OH is generated in Reaction R2) and suggests As the experimental γNO2 →HONO increases with NO2 at low
H2 O2 as a possibility, which is consistent with the observa- NO2 (Fig. 8), we postulate in Model 2 and Model 3 that
tion of OH and HO2 radicals produced from the surface of the production of HONO under illuminated conditions is
illuminated TiO2 aerosols (Moon et al., 2019). For Model 1, not fully first order in NO2 and requires more than one
outputs for the predicted concentration of HONO and the re- NO2 molecule to form HONO, consistent with the formation
active uptake coefficient, γNO2 →HONO , as a function of initial of the symmetric NO2 dimer (N2 O4 ) followed by isomeri-
NO2 mixing ratio are shown in Fig. 9. sation on the surface to form the asymmetric trans-ONO-
For a run time of 52 s, equal to that of the experi- NO2 dimer, which has been suggested to be more reactive
mental illumination time, Model 1 predicts an increase in with water than the symmetric N2 O4 dimer (Finlayson-Pitts
HONO production with increasing NO2 mixing ratio un- et al., 2003; Ramazan et al., 2004; Ramazan et al., 2006;
til the HONO concentration begins to plateau, reaching Liu and Goddard, 2012) due to the autoionisation to form
∼ 0.25 ppb at [NO2 ] = 400 ppb, presumably owing to satura- (NO+ )(NO− 3 ), which we propose is accelerated by the pres-
tion on active aerosol surface sites by NO2 . This leads to the ence of light, the full mechanism for which is shown in Fig. 5.
modelled reactive uptake coefficient, γNO2 →HONO , monoton- A recent rotational spectroscopy study found that the trans-
ically decreasing with increasing NO2 mixing ratio – a vari- ONO-NO2 was better described as the ion pair (NO+ )(NO− 3)
ation in NO2 uptake coefficient similar to that seen in previ- (Seifert et al., 2017). Reaction of the (NO+ )(NO− 3 ) ion pair
ous photo-enhanced NO2 aerosol uptake studies (Bröske et with surface-adsorbed water can then lead to the formation of
al., 2003; Stemmler et al., 2007; Ndour et al., 2008; Dupart HONO and HNO3 , the feasibility of which is supported by
et al., 2014). However, the model predictions for Model 1 do molecular dynamics simulation studies (Varner et al., 2014).
not reproduce the experimental variations shown in Figs. 6 While the symmetric N2 O4 dimer is favoured as it is the most
and 8, in which there is an observed initial rise and then a fall stable conformer, the asymmetric forms have been experi-
in both the HONO concentration and γNO2 →HONO with in- mentally observed in several studies (Fateley et al., 1959; Gi-
creasing NO2 mixing ratio. Hence, additional processes were van and Loewenschuss, 1989b, a, 1991; Pinnick et al., 1992;
Atmos. Chem. Phys., 21, 5755–5775, 2021 https://doi.org/10.5194/acp-21-5755-2021J. E. Dyson et al.: HONO production from illuminated aerosols 5767
Forney et al., 1993; Wang and Koel, 1998, 1999; Beckers et
al., 2010). A more recent ab initio study of NO2 adsorption
at the air–water interface suggested an orientational prefer-
ence of NO2 on the surface, with both oxygen atoms facing
away from the interface, which may imply that the asym-
metric dimer ONO-NO2 can form directly, meaning the high
barrier between the symmetric and asymmetric forms does
not need to be overcome (Murdachaew et al., 2013).
The energy barrier to isomerisation of symmetric N2 O4
in the gas phase may be reduced due to the interaction with
water adsorbed on surfaces. We therefore rule out the dimer
in the gas phase adsorbing onto the surface first and then
reacting to form HONO (Varner et al., 2014). An interest-
ing question is whether the first NO2 molecule adsorbed to
the surface dimerises via the addition of a gaseous NO2 via
an Eley–Rideal (ER) type process or whether a Langmuir–
Hinshelwood (LH) type mechanism is operating in which Figure 10. Experimental values (open circles with 1σ error bars),
both NO2 molecules are first adsorbed and then diffuse to- Model 2 (green line) and Model 3 (pink line) calculations for
gether on the surface forming N2 O4 . Both ER and LH mech- (a) HONO concentration after 52 s illumination and (b) NO2 re-
anisms to form the NO2 dimer have been included in the active uptake coefficient, γNO2 →HONO , as a function of the ini-
model, denoted as Model 2 and Model 3, respectively. The tial NO2 mixing ratio. The mechanisms used for these model runs
outputs for Model 2 and Model 3 (see Table 1 for details included a 2 : 1 stoichiometric relationship between the NO2 ad-
of the processes included) for the HONO concentration and sorbed on the TiO2 aerosol surface and the HONO produced, as
γNO2 →HONO as a function of NO2 are shown in Fig. 10 to- well as additional HONO loss reactions which are dependent on
gether with the experimental data. The stoichiometric rela- NO2 ; see Table 1 for details. Model 2 and Model 3 use an Eley–
Rideal and Langmuir–Hinshelwood mechanism, respectively, for
tionship of the requirement of two NO2 molecules forming
the formation of the NO2 dimer on the aerosol surface. Modelled
HONO on the surface was key to reproducing the experimen-
γNO2 →HONO was calculated using Eqs. (6) and (7) with a constant
tal trend of first an increase and then a decrease in both the
surface area of 1.6 × 10⁻² m2 m−3 chosen to match the aerosol sur-
HONO concentration and the reactive uptake coefficient with face area density of (1.6 ± 0.8) × 10−2 m2 m−3 shown in the exper-
the initial NO2 mixing ratio. imental [HONO] values in panel (a).
In previous work that investigated HONO production from
humic acid aerosols, a saturation effect was seen with HONO
production plateauing with increasing NO2 mixing ratio
(Stemmler et al., 2007), with the decreasing uptake coeffi- from the heterogeneous reaction of HONO with TiO2 sur-
cient, γNO2 →HONO , with increasing NO2 being attributed to faces in both dark and illuminated conditions, suggesting the
NO2 fully saturating available surface sites. However, the ob- loss of HONO via an auto-ionisation reaction between the
served decrease in [HONO] at the high NO2 mixing ratios gas-phase and adsorbed HONO to generate NO+ and NO− 2
shown in Figs. 8 and 10a suggests that additional reactions (El Zein and Bedjanian, 2012a). Additional HONO surface
on the surface may remove HONO and result in the reduction loss pathways were assumed to occur under illuminated con-
of [HONO] that is measured. As [HONO] decreases with the ditions due to the presence of e− and h+ , leading to the oxi-
increase in the NO2 mixing ratio, the removal process should dation of HONO to NO2 and the reduction of HONO to NO
either involve NO2 directly, (El Zein et al., 2013). Transition state theory (TST) stud-
ies of the gas-phase reaction of HONO with NO2 to form
HONO + NO2 → NO + HNO3 , (R19) HNO3 calculated a large activation energy which varied de-
pending on whether the reaction occurs via O abstraction
or involve species made rapidly from NO2 on the surface,
by HONO (159 kJ mol−1 ) or via OH abstraction via NO2
such as NO+2, (∼ 133–246 kJ mol−1 ) (Lu et al., 2000). In the gas phase
HONO(ads) + NO+ + these reactions are too slow to be important, but they could
2(ads) → H + 2NO + O2 , (R19a)
be enhanced on the surface, potentially more so on a pho-
which may be present at high enough concentrations of toactive surface such as TiO2 . For Models 2 and 3 the shape
HNO3 on the surface (Syomin and Finlayson-Pitts, 2003) or of the trend in HONO concentration and uptake coefficient,
following reaction with h+
VB , or a product of the reaction γ , versus NO2 concentration depended strongly on the value
of O2 or eCB with NO2 (Reaction R4), i.e. NO−
− −
2 . Simi- of kR19 and the choice of a 2 : 1 stoichiometric ratio of the
lar results were observed in a study by El Zein and Bedja- NO2 molecules adsorbed to the HONO molecules produced.
nian (2012a), where NO2 and NO were found to be formed Without these two key processes being included, a maximum
https://doi.org/10.5194/acp-21-5755-2021 Atmos. Chem. Phys., 21, 5755–5775, 2021You can also read