Episodic subduction patches in the western North Pacific identified from BGC-Argo float data
←
→
Page content transcription
If your browser does not render page correctly, please read the page content below
Biogeosciences, 18, 5539–5554, 2021
https://doi.org/10.5194/bg-18-5539-2021
© Author(s) 2021. This work is distributed under
the Creative Commons Attribution 4.0 License.

Episodic subduction patches in the western North Pacific identified
from BGC-Argo float data
Shuangling Chen1 , Mark L. Wells1,2 , Rui Xin Huang3 , Huijie Xue4,5 , Jingyuan Xi1 , and Fei Chai1,6
1 State Key Laboratory of Satellite Ocean Environment Dynamics, Second Institute of Oceanography,
Ministry of Natural Resources, Hangzhou, China
2 School of Marine Sciences, University of Maine, Orono, ME, USA
3 Woods Hole Oceanographic Institution, Woods Hole, MA, USA
4 State Key Laboratory of Marine Environmental Science, Xiamen University, Xiamen, China
5 College of Ocean and Earth Sciences, Xiamen University, Xiamen, China
6 School of Oceanography, Shanghai Jiao Tong University, Shanghai, China

Correspondence: Fei Chai (fchai@sio.org.cn)

Received: 7 June 2021 – Discussion started: 18 June 2021
Revised: 19 September 2021 – Accepted: 22 September 2021 – Published: 13 October 2021

Abstract. Subduction associated with mesoscale eddies is          be better constrained in global climate and biogeochemical
an important but difficult-to-observe process that can effi-      models.
ciently export carbon and oxygen to the mesopelagic zone
(100–1000 dbar). Using a novel BGC-Argo dataset cover-
ing the western North Pacific (20–50◦ N, 120–180◦ E), we
identified imprints of episodic subduction using anomalies
in dissolved oxygen and spicity, a water mass marker. These       1   Introduction
subduction patches were present in 4.0 % (288) of the total
profiles (7120) between 2008 and 2019, situated mainly in         Ocean subduction is the process of transporting water from
the Kuroshio Extension region between March and August            the wind-mixed surface layer into or below the permanent
(70.6 %). Roughly 31 % and 42 % of the subduction patches         thermocline, resulting in the efficient injection of heat, car-
were identified below the annual permanent pycnocline depth       bon, and oxygen to the ocean interior (Fig. 1). Subduction
(300 m vs. 450 m) in the subpolar and subtropical regions,        therefore plays an important role in regulating global climate
respectively. Around half (52 %) of these episodic events in-     and carbon cycles (Sabine et al., 2004; Qu and Chen, 2009;
jected oxygen-enriched waters below the maximum annual            Stukel et al., 2017, 2018; Boyd et al., 2019; Martin et al.,
permanent thermocline depth (450 dbar), with > 20 % occur-        2020). Many studies focus on the subduction of mode waters
ring deeper than 600 dbar. Subduction patches were detected       driven by large-scale circulation and the seasonal cycle of
during winter and spring when mixed layers are deep. The          the mixed-layer dynamics (Williams, 2001; Qu et al., 2002;
oxygen inventory within these subductions is estimated to be      Qiu et al., 2007; Koch-Larrouy et al., 2010; Kawakami et
on the order of 64 to 152 g O2 /m2 . These mesoscale events       al., 2015; Nie et al., 2016). But recent advances have high-
would markedly increase oxygen ventilation as well as car-        lighted the importance of small-scale (1–100 km) dynamical
bon removal in the region, both processes helping to sup-         processes for vertical transport and biogeochemistry in the
port the nutritional and metabolic demands of mesopelagic         upper ocean, driven by mesoscale eddies and sub-mesoscale
organisms. Climate-driven patterns of increasing eddy ki-         processes (Lévy et al., 2001; Xu et al., 2014; Omand et al.,
netic energies in this region imply that the magnitude of these   2015; McGillicuddy, 2016; Llort et al., 2018; Resplandy et
processes will grow in the future, meaning that these unex-       al., 2019). Ocean general circulation models typically resolve
pectedly effective small-scale subduction processes need to       the large-scale subduction of mode waters (Koch-Larrouy et
                                                                  al., 2010) but cannot accurately capture small-scale, short-

Published by Copernicus Publications on behalf of the European Geosciences Union.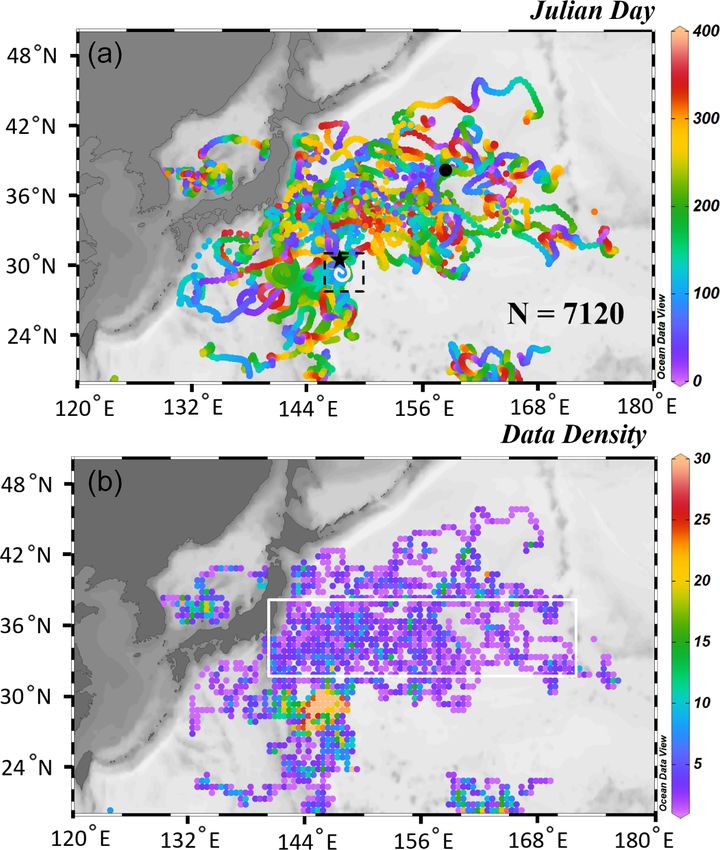
5540                                                                     S. Chen et al.: Episodic subduction from BGC-Argo

term subduction processes because of their episodic charac-       the potential to increase carbon sequestration efficiency and
teristics (Xu et al., 2014; Llort et al., 2018).                  oxygenation of the deep mesopelagic zone (Bushinsky and
   Subduction associated with mesoscale and sub-mesoscale         Emerson, 2018).
dynamics has been observed at higher latitudes in the North          Here we investigate small-scale subduction events in the
Atlantic (Omand et al., 2015) and Southern oceans (Llort et       western North Pacific region over the past decade (2008–
al., 2018), and similar processes have been shown to occur in     2019). These events were identified with a new algorithm
the Kuroshio Extension (KE) region in the western subtrop-        utilizing anomalies of apparent oxygen utilization (AOU; a
ical Pacific. Shipboard sampling techniques have been used        proxy for dissolved and particulate organic matter degrada-
there to identify small water parcels within the main thermo-     tion) and potential spicity (π ; a characteristic water mass
cline having low potential vorticity, elevated dissolved oxy-     marker) obtained from multiple biogeochemical Argo (BGC-
gen (DO), and anomalous salinity, which are signals indica-       Argo) datasets (Claustre et al., 2020; Chai et al., 2020). These
tive of small-scale subduction (Yasuda et al., 1996; Okuda        findings show the spatial and temporal distributions of sub-
et al., 2001; Oka et al., 2009). Analogous phenomena have         duction patches reflecting episodic injection processes that
been observed in mooring data from the region (Nagano et          contribute to the missing fraction of carbon and oxygen ex-
al., 2016; Inoue et al., 2016a; Kouketsu et al., 2016; Zhu et     port into the deep twilight zone (Emerson, 2014; Martin et
al., 2021), and more focused sampling of anticyclonic eddies      al., 2020) but also have the potential to become increasingly
with Argo floats (Zhang et al., 2015; Inoue et al., 2016b) and    significant under future climate scenarios.
Seagliders (Hosoda et al., 2021) confirm the existence of dis-
crete subsurface water mass exchanges. These episodic fea-
tures will contribute to both ventilation of the mesopelagic      2     Data and methods
zone and export of dissolved inorganic and organic carbon
from surface waters (i.e., the solubility pump; Sarmiento and     2.1    Data
Gruber, 2006), but their frequency, spatial extent, and life-
times remain unknown (Hosoda et al., 2021).                       After standard data quality control, 7120 profiles from 43
   Eddy-associated processes that generate vertical trans-        BGC-Argo floats in the western North Pacific (20–50◦ N,
port of productive and detrital planktonic biomass into the       120–180◦ E) between 2008 and 2019 were selected (Fig. 2).
mesopelagic zone affect not only carbon export but also           All of these profiles contained measurements of temperature,
carbon sequestration timescales (i.e., time that carbon re-       salinity, pressure, and dissolved oxygen (DO, µmol/kg). The
mains within the ocean interior). In general, sequestration       upper 1000 dbar of the ocean was sampled in each profile,
timescales are proportional to the depth of injection, but the    and the typical profiling interval was between 5–10 d, with
more important factor is whether these injections extend be-      the floats parking at 1000 dbar depth in between. The typi-
low the annual maximum mixed-layer depth (MLD), or per-           cal vertical sampling frequency was every 5, 10, and 50 dbar
manent pycnocline, which hinders its return to the atmo-          for depth intervals of 0–100, 100–500, and 500–1000 dbar,
sphere (Boyd et al., 2019). Although eddy subduction has          respectively. Some floats were set with daily profiling and
the potential to contribute significantly to global carbon ex-    higher vertical frequency (e.g., every 2 dbar) for specific pur-
port, evidence of the subsurface fate of injected carbon has      poses.
been indirect and patchy (Estapa et al., 2019), highlighting         All BGC-Argo variables were vertically smoothed with a
the challenge of detecting and quantifying carbon export as-      three-bin running average to remove sharp noises or spikes
sociated with mesoscale and sub-mesoscale processes.              (Llort et al., 2018). Two key variables, apparent oxygen uti-
   The uncertainty about the contribution of eddy subduc-         lization (AOU) and potential spicity (π), were derived from
tion to carbon and oxygen transport into the mesopelagic          the direct measurements. Specifically, AOU is defined as
and deeper ocean interior has ramifications for both biogeo-      the difference between saturated oxygen concentration (Osat )
chemical and ecological processes (Fig. 1). The transport of      and DO, and Osat is estimated from temperature and salinity
freshly produced particulate and dissolved organic carbon,        (Garcia and Gordon, 1992). AOU is a proxy for water mass
along with oxygen, from surface waters to the mesopelagic         age which reflects the microbial respiration of dissolved and
zone is critical for balancing upper-ocean carbon budgets         particulate organic matter (Sarmiento and Gruber, 2006). Po-
(Emerson, 2014) and supporting the nutritional demands of         tential spicity referenced to the surface pressure is calculated
mesopelagic organisms (Dall’Olmo et al., 2016). The knowl-        from pressure, temperature, and salinity following Huang et
edge gap in these episodic processes is particularly evident      al. (2018). Seawater is a two-component system. The water
in the mid-latitude western North Pacific, where mesoscale        mass anomaly is commonly analyzed in terms of the (poten-
eddies, recirculation gyres, fronts, and jets are amplified un-   tial) temperature and salinity anomaly, and isopycnal anal-
der the influence of the Kuroshio and Oyashio currents and        ysis is also widely used. By definition, the temperature and
their extensions (Nishikawa et al., 2010). Shoaling of the        salinity anomaly on an isopycnal surface is density compen-
maximum annual MLD in this region relative to higher lat-         sated; thus, the water mass anomaly on an isopycnal surface
itudes (Cronin et al., 2013; Palevsky and Doney, 2018) has        is commonly described in terms of another thermodynamic

Biogeosciences, 18, 5539–5554, 2021                                                  https://doi.org/10.5194/bg-18-5539-2021
S. Chen et al.: Episodic subduction from BGC-Argo                                                                                5541

Figure 1. An illustration of the Kuroshio and Oyashio Extension region depicting the different modes of carbon export below the maximum
annual mixed-layer depth; the biological gravitational pump (sinking export, zooplankton migration) and subduction in the region of the
Kuroshio and its extension (yellow line) and Oyashio and its extension (grey line). The subducted surface waters, apparently driven by
mesoscale eddy processes, travel along isopycnal surfaces transporting water containing high dissolved oxygen (DO), dissolved organic
carbon (DOC), and slowly sinking particulate organic carbon (POC) into the mesopelagic zone (low DO, DOC, and POC). The green layer
represents the euphotic zone, and the blue layer below is the mesopelagic zone.

variable, which is called spice, spiciness, or spicity. Over the      relationship between surface mesoscale circulation and the
past decades, there have been different definitions of such           float profiles.
a thermodynamic variable; however, a most desirable prop-
erty of such a thermodynamic function is that it is orthog-           2.2     Methods
onal to the density. Recently, Huang et al. (2018) proposed
a potential spicity function (π ) by the least-squares method,        2.2.1    Subduction detection
which is practically orthogonal to the potential density, with
the root mean square of the angle deviation from orthogo-             When a BGC-Argo float passes through a parcel of water in-
nality at the value of 0.0001◦ . Therefore, combining density         jected from the mixed layer, it captures coherent anomalous
and spicity gives rise to an orthogonal coordinate system. It         features in AOU and π distinct from the surrounding waters
is the thermodynamic variable we used in this study, which            (Fig. 1). These anomalies can be used to identify subduc-
allows differentiating water masses with distinct thermoha-           tion patches that are indicators of subduction events occur-
line properties but similar density. In addition, potential den-      ring in the vicinity (Omand et al., 2015; Llort et al., 2018).
sity (σ ) referenced to the surface pressure was derived from         Quantifying anomalies in AOU and π (denoted as 1AOU and
pressure, temperature, and salinity based on the thermody-            1π ) requires defining the reference values of AOU and π
namic equation (TEOS-10; McDougall and Barker, 2011);                 at the mean state of the profile without subduction. Llort
and MLD was estimated based on a threshold (0.05 kg/m3 )              et al. (2018) used the 20-bin running averages of the pro-
of the difference in density from a near-surface value (i.e., at      files as the references; however, we found that this approach
10 dbar) (Brainerd and Gregg, 1995). All these derived vari-          could dampen the subduction signal and thus miss subduc-
ables were calculated for each of the 7120 profiles.                  tion patches as well as misidentify other signals as subduc-
   In addition to the BGC-Argo float data, satellite data of          tion (see Fig. S1). To avoid misreporting these anomalies,
daily sea level anomalies (SLAs) and daily geostrophic ve-            a revised detection method was developed by trial and er-
locity anomalies (u0 and v 0 ) between 1993 and 2018 were             ror, as shown in example profiles of AOU, π, DO, and σ
also processed. The geostrophic velocity anomalies were               for Station no. 234 of float MD5904034 (Fig. 3; see Fig. 2a
used
  p to calculate the eddy kinetic energy (EKE) as EKE =               for its sampling location). Two subduction patches are vi-
1     02     02                                                       sually apparent at ∼ 230 and ∼ 300 dbar (yellow shading in
2 u + v . These data were used to identify the spatial
                                                                      Fig. 3a, b). The identification of the lower subduction patch

https://doi.org/10.5194/bg-18-5539-2021                                                       Biogeosciences, 18, 5539–5554, 2021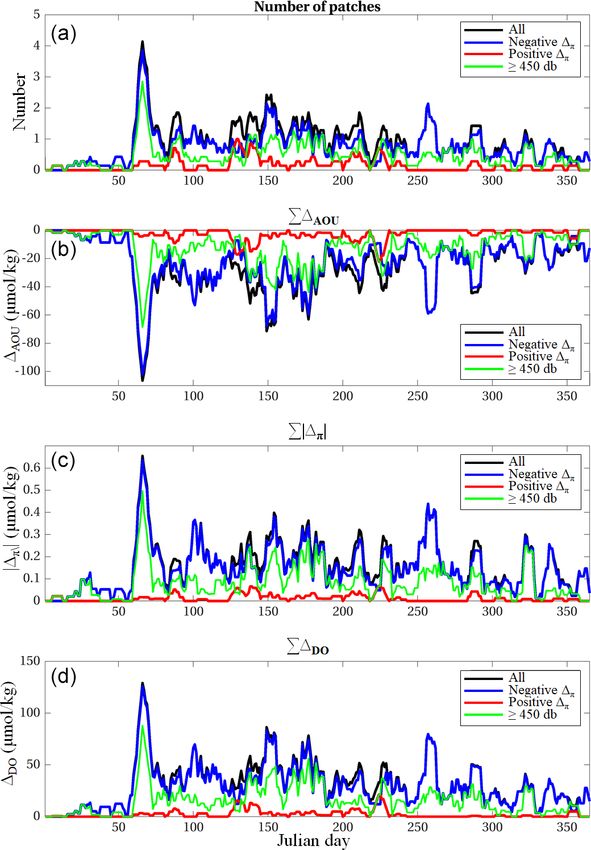
5542 S. Chen et al.: Episodic subduction from BGC-Argo
4. Calculate the peak 1π at each targeted pressure. For
the case of a negative (positive) peak, identify the maxi-
mum (minimum) values of π within the depth ranges of
[p − 1p, p] and [p, p + 1p], respectively (green trian-
gles in Fig. 3c), and the depth interval 1p = 100 dbar is
chosen, considering the general vertical scale (i.e., a few
tens of meters) of the eddy-induced subduction features
(Zhang et al., 2015; Hosoda et al., 2021); the reference
profile is defined by the straight line in between. The
anomaly 1π (red bracket in Fig. 3c) is defined as the
difference between the reference profile and the origi-
nal profile of π at pressure p (green star in Fig. 3c).
5. Calculate 1AOU using the same method, independent of
1π .
6. The thresholds used to determine whether the signals
meet the criteria of a subduction patch or not were set
to −10 µmol/kg for 1AOU and ±0.05 kg/m3 for 1π fol-
lowing Llort et al. (2018).
The refined algorithm presented here had improved perfor-
mance for detecting subduction patches in these BGC-Argo
profile data compared to that used in previous studies (Llort
et al., 2018) (see Fig. S1). The main difference in our ap-
proach is in selecting the frame of reference for identifying
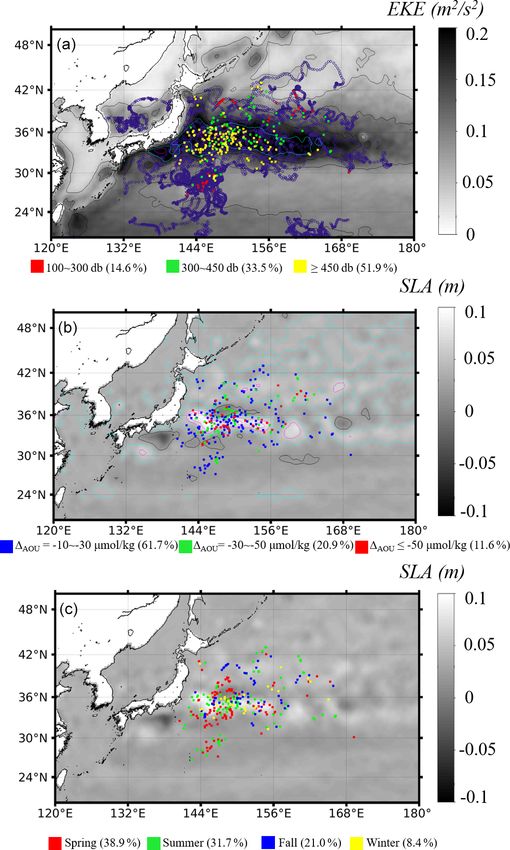
Figure 2. Horizontal distribution of the quality-controlled BGC- AOU and π anomalies from irregular features in “typical”
Argo data profiles between 2008 and 2019 in the western North vertical profiles.
Pacific. The Argo profiling tracks are color-coded by the Julian The sensitivity of the method to the interval of 1p (in
day (a) and data density (number of available profiles) for each
step 4) was investigated by varying 1p between 70 and
grid (0.5◦ × 0.5◦ ) (b). The location of Station no. 234 from float
MD5904034 is denoted by the black dot in (a) (see Fig. 3); the
130 dbar (see Table S1). For 1p of 100 ± 3 dbar (i.e., 97, 98,
white curve inside the dashed box represents the trajectory of float 99, 101, 102, and 103 dbar), fewer than seven (≤ 2 %) sub-
MR2901556 between 28 July and 18 August 2014, and the black duction patches were missed, and the resulting 1AOU and 1π
star indicates the beginning of the float trajectory during this period show a RMSD of ≤ 3.8 µmol/kg (≤ 8.3 %) and ≤ 0.03 kg/m3
(see Fig. 4). The white box in (b) denotes the region with strong (≤ 9.2 %). More details are provided in Text S1. The sensitiv-
energetic ocean processes (i.e., Kuroshio–Oyashio Extension, asso- ity analysis suggests the validity and robustness in the choice
ciated with eddy activities). of 1p of 100 dbar. After verifying that our approach better
captured subduction indicators in a subset of BGC-Argo data
from this region, the algorithm was applied to all profiles
at ∼ 300 dbar from the spicity profile is briefly described be- to identify the locations, depths, timing, and strengths (i.e.,
low and is illustrated in Fig. 3c: 1AOU , 1DO , and 1π ) of the subduction patches.
1. Calculate the slopes (i.e., first-order derivative) for pro-
2.2.2 Quantification of oxygen export
files of AOU and π against depth.
2. Locate the peaks in AOU and π profiles (e.g., the blue For all the subduction patches identified using the method
star in Fig. 3c) based on their slopes. Specifically, if at developed above, we obtain a first-order estimate of oxygen
one sampling point the slope changes from positive to export based on the DO anomalies (1DO) with the assump-
negative when moving downwards, it is called a nega- tions that (1) the surface processes initiating these subduc-
tive peak and vice versa. Only the negative or positive tion events generated similar levels of DO (i.e., surface phy-
peaks in π associated with a negative peak in AOU are toplankton production) and (2) the water parcels containing
considered, as only negative AOU anomalies indicate this DO are subducted into the ocean’s interior.
potential water transport from the surface mixed layer We estimated the average oxygen inventories within the
(Llort et al., 2018). water column based on the BGC-Argo profiles. We calcu-
lated DO inventories (per m2 ) through these features in two
3. Locate the coherent peaks in both AOU and π , and mark ways: by integration of the anomaly above the estimated
their depths as the targeted locations (represented by baseline (Eq. 1) and by using the anomaly peak height (Eq. 2)
pressure, p) for potential subduction patches. (see Fig. 3c).
Biogeosciences, 18, 5539–5554, 2021 https://doi.org/10.5194/bg-18-5539-2021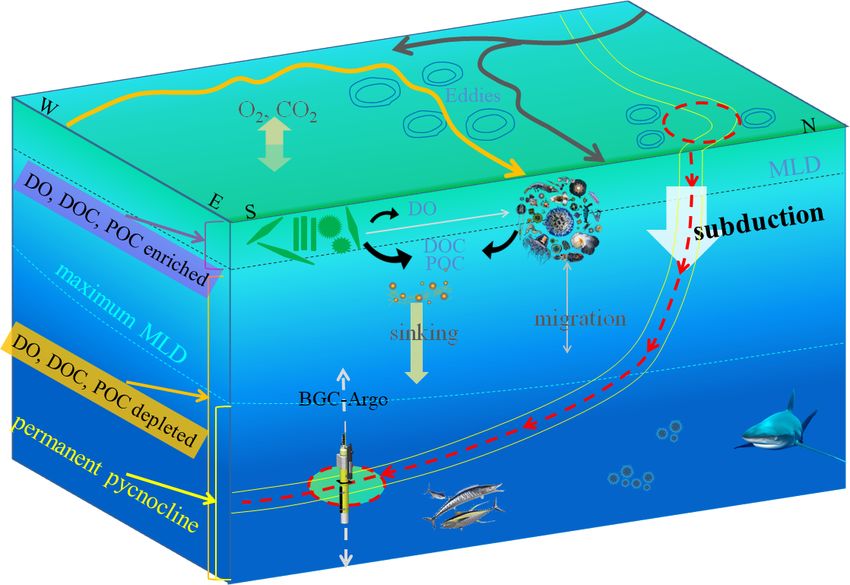
S. Chen et al.: Episodic subduction from BGC-Argo                                                                                         5543

Figure 3. Vertical property distributions of profile no. 234 (on 24 June 2016) of float MD5904034 (the black dot in Fig. 2a) demonstrate
subduction patches observed by the BGC-Argo floats. (a) The profiles of potential density (σ , blue line) and potential spicity (π , dotted red
line), (b) the profiles of DO (blue line) and AOU (red dotted line); (c) the same spicity profile as in (a), which is used to demonstrate the
steps to detect subduction signals described in Methods. Note that the red dots in each panel represent the raw field observations; the overlaid
red curves are the three-bin running averages to remove sharp noises or spikes, which are used to calculate the anomalies in AOU and π; and
the black line represents the MLD. The yellow shading in (a) and (b) highlight the subduction features identified using the detection method
in (c).

  The equation for the integrated estimates for each profile is           3     Results and discussion
                                      Xz=p2
Oxygen InventoryIA (g O2 /m2 ) =                 1DOz ,          (1)      3.1    Case study – detecting subduction in BGC-Argo
                                          z=p1
                                                                                 datasets
where 1DOz is the DO anomaly at depth z within the wa-
ter column of the subduction patch, and the integrated areas              Subduction associated with eddy pumping is a recognized
(IA) of DO anomalies are converted from µmol/kg to mg/m2                  important contributor to the transfer of carbon and other ma-
based on seawater density.                                                terials from the surface euphotic layer to the ocean interior
   The inventory calculated using the peak height (PH) ap-                (McGillicuddy, 2016; Bord et al., 2019), but investigating the
proach is                                                                 spatial distributions, physical dynamics, and biogeochemi-
                                                                          cal consequences of these episodic small-scale processes is
Oxygen InventoryPH (g O2 /m2 ) = 1DO_peak × H,                   (2)      difficult. The BGC-Argo program provides an exceptional
                                                                          data resource for this purpose (Claustre et al., 2020; Chai et
where H is the thickness (i.e., vertical height between the               al., 2020), but detecting subduction signals where differences
green triangles in Fig. 3c, in units of m) of the subduction              among water masses are small is challenging.
patch and the 1DO_peak is the maximum anomalous value                        Subduction patches below the seasonal and permanent py-
of DO converted to mg/m2 as above. The oxygen inventory                   cnoclines can be identified in vertical profiles by anomaly
using the peak height method represents the maximum po-                   matrices of temperature, salinity, and dissolved oxygen
tential of the anomalous DO inventory within the subduction               (DO). Examples of these events are illustrated in time se-
patch.                                                                    ries from the BGC-Argo profiling float (MR2901556), be-
                                                                          tween 28 July and 18 August 2014 (Fig. 4). Positioned on
                                                                          the southern perimeter of the Kuroshio Extension region, the
                                                                          surrounding ocean conditions are less energetic, with fewer
                                                                          eddy activities and small sea level anomalies. During the ob-
                                                                          servation period, the float was trapped in a warm-core eddy
                                                                          (Fig. S2) and moved from the margin of the eddy to the eddy
                                                                          core, as indicated by the gradual increase in depth of the

https://doi.org/10.5194/bg-18-5539-2021                                                             Biogeosciences, 18, 5539–5554, 2021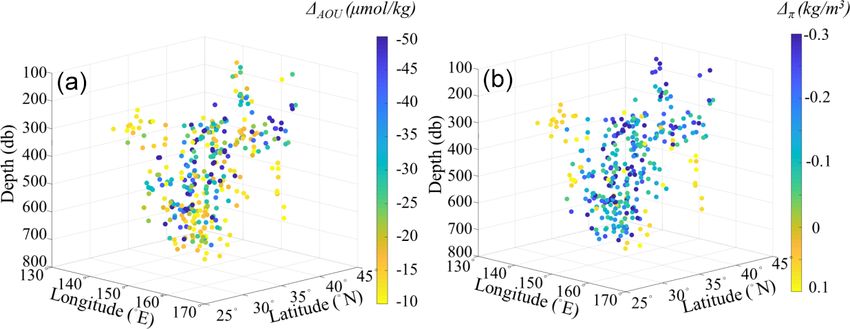
5544                                                                    S. Chen et al.: Episodic subduction from BGC-Argo

anomalous patch (right panels of Fig. 4). Due to the verti-       is a place where it is easy to observe subduction events (see
cal cruising of the Argo profiler in an environment with ve-      Sect. 3.2).
locity shear, it may sample different parts of the same sub-
duction patch, as indicated by slightly different depths, and
                                                                  3.2   Spatial and temporal distributions of subduction
anomalous spicity and oxygen concentration. Here, intermit-
tent patches of elevated spicity (π ), lower AOU, and greater
dissolved oxygen are visible in the upper 600 dbar (boxes 1–      We used our peak detection algorithm with the π and AOU
3, Fig. 4). Potential spicity (π), a parameter dependent on       data and applied it to all 7120 BGC-Argo profiles (2008–
pressure, temperature, and salinity (Huang et al., 2018), is      2019) in the western North Pacific (Fig. 5). Our algorithm re-
a sensitive indicator of water mass differences. AOU is the       solved 335 subduction patches, spread over an unexpectedly
difference between the measured dissolved oxygen concen-          large area in the western North Pacific. Overall, subduction
tration and its equilibrium saturation concentration in water     patches were identified in 288 profiles (4.0 %) (some pro-
with the same physical and chemical properties. It reflects       files have multiple patches at different depths), with approx-
the degree of progressive microbial decomposition of organic      imately 83 % of these being concentrated in the Kuroshio–
matter since the water was last at the surface in contact with    Oyashio Extension region (Fig. 5a). High (≥ 6 cm) climato-
the atmosphere (Garcia and Gordon, 1992; Sarmiento and            logic sea level anomalies (SLAs) and the corresponding dis-
Gruber, 2006). Despite this oxygen consumption, these in-         tribution of eddy kinetic energy (EKE) are evidence of the
jected waters retain excess net oxygen concentrations relative    strong energetic ocean processes in this region (Fig. 5a and
to the surrounding mesopelagic zone (Fig. 4d).                    b). By contrast, far fewer subduction patches were identified
   Llort et al. (2018) successfully identified eddy subduction    in the less energetic region to the south of 29◦ N despite a
in BGC-Argo data from the Southern Ocean using anoma-             higher BGC Argo sampling density (Fig. 2b), consistent with
lies in spiciness (Flament, 2002; Huang, 2011; McDougall          eddy-related processes being important for driving these sub-
and Krzysik, 2015), a parameter derived from a different          duction events. Even so, the true frequency of these events
function of pressure, temperature, and salinity than potential    across the entire region is certain to have been under-sampled
spicity (Huang et al., 2018). However, we found that spici-       given their small scales relative to the dispersed BGC-Argo
ness frequently missed signs of subduction while misiden-         float positions.
tifying other signals as subduction, and the 20-bin method           Discrete signals of subduction were detected throughout
used by Llort et al. (2018) significantly dampened the sub-       the mesopelagic depth range (∼ 100–1000 dbar), with the
duction signals in our data. Potential spicity (π ) (Huang et     majority detected below 300 dbar (green and yellow dots
al., 2018), on the other hand, greatly improves the ability to    in Fig. 5a). The deepest penetrations (≥ 450 dbar) occurred
distinguish among similar water masses due to its orthogo-        largely in areas experiencing the highest EKE while the shal-
nal coordination with density, a feature that spiciness lacks.    lowest (100–300 dbar) were largely restricted to areas with
This added sensitivity revealed reliable signals of subduction    lower EKE (Fig. 5a). Based on 16 years of Argo float data
in these BGC-Argo data. The algorithm based on peak detec-        (N = 1 226 177) in the global ocean, Feucher et al. (2019)
tion here shows better capabilities in capturing and quantify-    found that the depth of the permanent pycnocline differs be-
ing the subduction signals (see Methods, Fig. S1).                tween the subtropical (i.e., < 35◦ N) and subpolar (> 35◦ N)
   For the same subduction event, continuous subduction           regions, with the depth of the permanent pycnocline being
patches are expected to be identified from the Argo profiles.     300 and 450 m in the subpolar and subtropical sections of
The discrete anomalous π and AOU signals, highlighted in          the western North Pacific. Similarly, using the limited BGC-
boxes 1–3 in the example time series (Fig. 4a–d; 31 July,         Argo dataset used in this study (Fig. 2), we also found shal-
10 and 12 to 15 August), indicate that they stemmed from          lower annual maximum MLD in the subpolar section than
distinct subduction events, opportunistically captured by this    that in the subtropical section (see Fig. S3). As a result, 56
BGC-Argo float. The first two anomalies (July and early Au-       (16.7 %) and 104 (31.0 %) subduction patches were found
gust) each appeared in only a single profile, perhaps indicat-    to be above and below the depth of the permanent pycn-
ing a limited spatial scale of these subduction events. In con-   ocline (i.e., 450 m) in the subtropical section; and in the
trast, the mid-August anomaly persisted over four consecu-        subpolar section, 34 (10.1 %) and 141 (42.1 %) subduction
tive profiles. We further examined the corresponding time se-     patches were above and below the permanent pycnocline
ries of temperature, salinity, and potential density and found    (i.e., 300 m). Overall, roughly half (52 %) of the detected
salinity also showed a similar anomalous signal. As such, we      subduction signals were below 450 dbar in this region of the
suspect the consecutive subduction patches were most likely       western North Pacific, while 22 % penetrated far deeper (up
from a more sustained or a larger spatial subduction event. It    to 800 dbar; Table S2).
should be noted that the high detection chance of subduction         There is a distinct seasonality in subduction, with most
within 21 d was likely given that the float was trapped in a      (∼ 70 %) signals being observed between March (the max-
warm-core eddy (Fig. S2), which does not indicate this area       imum) and August (Figs. 6 and S4), with the peaks appear-
                                                                  ing in early March. Since these anomalous patches can be

Biogeosciences, 18, 5539–5554, 2021                                                 https://doi.org/10.5194/bg-18-5539-2021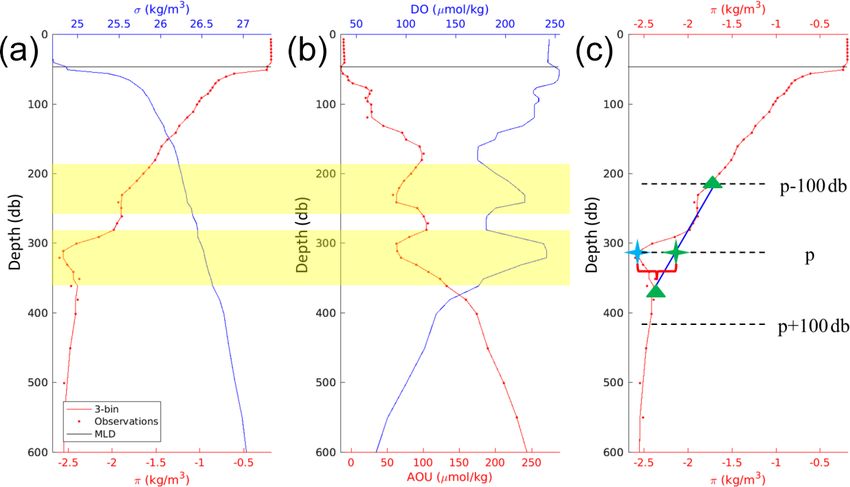
S. Chen et al.: Episodic subduction from BGC-Argo                                                                                       5545

Figure 4. Trajectory of float MR2901556 between 28 July 2014 (Station no. 123) and 18 August 2014 (Station no. 144) (a) and its time
series of π (b) AOU (c), and DO (d). Vertical lines in (b), (c), and (d) represent the BGC-Argo profiles, and the section distance along the
x axis is the path distance from Station no. 123 (the red star in a). The three boxes (Box1, Box2, and Box3) in (b, c, d) outline the coherent
anomalous features in π, AOU, and DO, which were identified as subduction patches following the detection procedure in Sect. 2.2.1. The
red lines in (b, c, d) indicate the MLD, and the horizontal black lines are the isopycnals. Anomalies of magnitude less than −10 µmol/kg for
1AOU and ±0.05 kg/m3 for 1π (e.g., at section distances of ∼ 25, 125, 175, 275, and 475 km) were below our conservative thresholds for
identifying intrusions (−10 µmol/kg for 1AOU and ±0.05 kg/m3 for 1π ).

observed after their formation, there is a delayed period be-            by the total number of profiles available) was the highest in
tween the peak of formation and the peak of observation.                 March, at ∼ 10 % (Fig. S5). In a pioneering work, Stommel
   Ocean eddies are sustained by many processes including                (1979) argued that a demon works in the ocean by selecting
small-scale mixed-layer instabilities set up by large-scale at-          the later winter (typically later March in the Northern Hemi-
mospheric forcing in winter (Sasaki1 et al., 2014); in par-              sphere) water mass properties and injecting them into the
ticular, the extreme mixed-layer deepening events are at-                subsurface ocean. This mechanism is now called the Stom-
tributable to the accumulation of excessive surface cooling              mel Demon in dynamical oceanography (Huang, 2010). The
driven by synoptic storms in connection with cold-air out-               high detection rate of episodic subduction patches in March
breaks (Yu et al., 2020). Each cooling episode brought by                was consistent with observations of large-scale subduction
the synoptic storm may lead to the formation of subduction               in this region during late winter because mesoscale and sub-
patches due to strong mixed-layer deepening. Thus, subduc-               mesoscale eddy activities are prevalent when large-scale sub-
tion patches are primarily formed during winter and spring               duction occurs (Qu et al., 2002; Qiu et al., 2007; Nishikawa
when deep mixing processes occur. Although only 8.3 % of                 et al., 2010; Liu and Huang, 2012; Zhang et al., 2014; Xu et
the total profiles were obtained in March, they accounted for            al., 2014). The March-to-August time frame also coincides
17.3 % of all observed subduction patches (Fig. S4a); cor-               with the onset and establishment of warming-induced shoal-
respondingly, the monthly subduction detection rate (i.e., the           ing of the mixed-layer depth, when winter-subducted waters
number of profiles with identified subduction patches divided            are less likely to be re-entrained into surface waters by winds

https://doi.org/10.5194/bg-18-5539-2021                                                           Biogeosciences, 18, 5539–5554, 2021
5546                                                                          S. Chen et al.: Episodic subduction from BGC-Argo

                                                                         Figure 6. Temporal distribution of the number of patches (a), inte-
                                                                         grated AOU anomaly (b), integrated π anomaly (c), and integrated
                                                                         DO anomaly (d), by the Julian day based on 7-point smoothing.
                                                                         Spicity in subducted patches can be lower or higher than the sur-
                                                                         rounding waters, resulting in negative 1π (red lines) or positive
Figure 5. Horizontal distribution of the BGC-Argo data profiles as-      1π (blue lines) anomalies, respectively (see text in Sect. 3.4). The
sociated with subduction patches (a, b) between 2008 and 2019 in         integrated anomalies indicate the significance and prevalence of the
the western North Pacific. The profiles with detected subduction         episodic subduction events over time.
patches are color-coded by different intervals of depths of the sub-
duction patches (a), AOU anomalies (b), and seasons (c), with per-
centages of detected patches in each interval annotated. The purple      tified in the time frame of April–August being slightly larger
background data in (a) represent all the analyzed profiles as shown      than those in September–December (Fig. S4a), the detection
in Fig. 2a. The greyscale background map in (a) is the annual mean       rates did not vary much between these time frames (Fig. S5).
EKE climatology, with EKE contour lines of 0.3, 0.2, and 0.1 m2 /s2
                                                                         In contrast, comparatively few (3.0 %) of the subduction
shown in magenta, cyan, and black, respectively, and the greyscale
background map in (b) is the annual mean SLA climatology, with
                                                                         patches were detected in January and February, in which time
SLA contour lines of ≥ 0.06, 0.04, and 0.02 m shown in magenta,          the detection rates were also low (< 2 %, Fig. S5). Although
cyan, and black, respectively. The seasons in (c) are divided into the   specific timelines between the observed subduction patches
spring of March–May, summer of June–August, fall of September–           and their formation could not be determined, it is reasonable
November, and winter of December–February.                               to anticipate that more energetic winds and the accumulated
                                                                         strong heat loss during mid-winter contributed to the peak
                                                                         in subduction signatures observed in March. However, there
                                                                         were no spatial patterns of the subduction patches detected in
(Dall’Olmo et al., 2016; Palevsky and Doney, 2018). Indeed,
                                                                         each season (Fig. 5c). The current BGC-Argo profiling asset
based on the entire BGC-Argo dataset in Fig. 2, we found
                                                                         is not sufficient for studying how those subduction patches
that the monthly MLD reached a maximum in February and
                                                                         change on interannual scales.
March and then decreased until August (Fig. S3). It should
be noted that, despite the number of subduction patches iden-

Biogeosciences, 18, 5539–5554, 2021                                                          https://doi.org/10.5194/bg-18-5539-2021
S. Chen et al.: Episodic subduction from BGC-Argo 5547
The Kuroshio–Oyashio Extension zone lies between the subduction patches had 1AOU values in the range of −30 to
subtropical and subpolar gyres in the North Pacific, and it is a −10 µmol/kg with the remainder having greater oxygen de-
recognized hot spot for water mass exchange via eddy trans- pletions (i.e., ≤ −30 µmol/kg) (Fig. 5b). Water masses sub-
port (Yasuda et al., 1996; Talley, 1997; Joyce et al., 2001; ducted below 450 dbar (i.e., the permanent pycnocline) had
Zhang et al., 2014; Xu et al., 2016) and substantial ocean-to- an average AOU anomaly of −25.7 ± 15.3 µmol/kg.
atmosphere heat flux (Jing et al., 2020). It is not surprising There was no clear relationship between the depth of sub-
then that the majority of subduction signals were observed duction and 1AOU (Fig. 7a), suggesting either surface con-
in this region in spite of less float coverage (Fig. 5). In the ditions (e.g., water temperature, primary productivity) were
southern area of the Kuroshio Extension, where the subtrop- substantially different when the seawater parcels were sub-
ical mode water is formed, the MLD could reach 300–400 m ducted or these signatures stem from non-systematic differ-
between January and March (Fig. S3). Subduction patches ences in the time since subducted waters were last at the sur-
are formed after the water parcels are detached from the base face. On the other hand, it is noted in Fig. 7 that the depth
of the mixed layer, and they could be identified below the positions of the subduction patches appear to somewhat ex-
base of the winter mixing layer (Fig. 5c). Large-scale circu- tend from northeast to southwest and are deeper along the
lation and seasonal variability in the mixed-layer depth here isopycnal surface as illustrated in Fig. 1. This phenomenon
typically result in late-winter subduction of subtropical mode is clearly shown when averaging the depth of subduction
waters (Qiu et al., 2007; Oka et al., 2009; Oka and Qiu, 2012; patches both latitudinally and longitudinally (Fig. S6). Along
Xu et al., 2014, 2016), and sharp horizontal density gradients the latitude, despite a few deep subduction patches identified
can enhance strong vertical exchanges (Marshall et al., 1993; at 42–43◦ N (at around 550 m), the mean depths of the sub-
Hurlburt et al., 1996; Liu et al., 2012; Ma et al., 2017). Rapid duction patches show a clear increasing pattern from latitude
heat loss to the wintertime cool, dry continental air masses 37–42◦ N to a latitude of 32–37◦ N, i.e., 300 m vs. 500 m.
flowing across the Kuroshio–Oyashio Extension erodes the However, the depth positions tend to become shallower and
seasonal thermocline to its maximum depth in February– shallower south of 32◦ N. Along the longitude, the depth po-
March (Cronin et al., 2013), the latter portion in which the sitions generally appear to be deeper from east to west. As
subduction patches were most frequently observed (Fig. 6). such, it is most likely that the subduction that occurred in
Ascertaining the frequency and spatial extent of these the northern KE (37–42◦ N) could travel southwestward from
lower-latitude episodic events will be important for establish- shallow to deep depth, and these waters could reach 32◦ N.
ing their overall contribution to the transport of surface wa- The increasing depth positions of subduction patches from
ters into the mesopelagic zone, but this goal is challenged by 26 to 32◦ N tend to suggest the gradually downward move-
the presently limited distribution of BGC-Argo floats. It may ments of the subducted water masses carried by the general
be possible to obtain a first-order estimate of their frequency trend of the anticyclonic gyre-scale circulation, yet further
by linking the subduction signals here to surface-expressed investigation is needed.
indicators of mesoscale circulation processes. Moreover, our In the subpolar region, for the subduction patches iden-
findings suggest that spicity should be adopted more gen- tified above and below the depth of the permanent pycno-
erally in probing BGC-Argo datasets to improve our under- cline (i.e., 300 m), respectively, the averaged 1AOU values
standing of the spatial and temporal distribution of subduc- are −32.9 and −25.8 µmol/kg, averaged 1DO values are 42.5
tion processes. and 32.5 µmol/kg, and averaged thicknesses (i.e., vertical ex-
tension of the subduction patch) are 127.5 and 126.6 m (Ta-
3.3 Properties of subduction patch ble 1). In the subtropical region, the depth of the perma-
nent pycnocline was deeper (i.e., 450 m) and the subduction
Beyond being a water mass indicator, AOU is a proxy for cu- patches above and below this layer were associated with a
mulative net community respiration and a sensitive indicator mean 1AOU of −27.2 and −28.5 µmol/kg, mean 1DO of 31.2
of carbon export in the upper mesopelagic zone (Emerson et and 36.4 µmol/kg, and mean thickness of 128.7 and 128.1 m
al., 2001; Pan et al., 2014; Catala et al., 2018; Bushinsky and (Table 1). In general, the vertical extension (i.e., thickness)
Emerson, 2018). This export comprises remineralized car- of the subduction patches identified in each layer and in each
bon as well as dissolved and slowly sinking particulate or- region did not vary much between 126.6 and 128.7 m. The
ganic matter carried by the subducting waters (Stukel et al., mean 1AOU and 1DO were stronger above the depth of the
2017). The magnitude of AOU may be used as an indicator of permanent pycnocline than those below the depth of the per-
the time since subduction, with the first-order assumption be- manent pycnocline in the subpolar region, yet the opposite
ing that the larger-scale processes initiating these subduction case is shown for the subtropical region, where the mean
events generated similar surface production. Values of 1AOU 1AOU and 1DO were weaker above the depth of the per-
at the anomalous peak depth ranged between −10 (the min- manent pycnocline than those below the depth of the perma-
imal threshold used) and −81 µmol/kg (Fig. 7a). This proxy nent pycnocline. Interestingly, it is noted that the mean 1AOU
was highly variable over the space–time domain, similarly and 1DO values in the subtropical region below 450 m were
to the variations in 1π (Fig. 7b). In general, 61.7 % of the also weaker than those in the subpolar region above 300 m,
https://doi.org/10.5194/bg-18-5539-2021 Biogeosciences, 18, 5539–5554, 20215548 S. Chen et al.: Episodic subduction from BGC-Argo
Figure 7. Vertical spatial distribution of the detected subduction patches in the western North Pacific, color-coded by the magnitudes of the
subduction strengths in terms of the AOU anomaly (a) and π anomaly (b).
which further supports the potential northeast-to-southwest ries below the permanent pycnocline in the subtropical and
pathway of subducted waters shown in Fig. 7. subpolar regions were on the order of 64.3–161.5 and 61.2–
Most subduction patches with strong AOU anomalies were 142.1 g O2 /m2 , respectively (Table 1). Note that the DO in-
observed between March and August (particularly March; ventories here are the average values of the amount of oxy-
see Fig. S4), after the seasonal mixed layer began to shoal, gen injected into the ocean interior by an episodic subduction
consistent with expected higher levels of phytoplankton pro- event. These oxygen inventories may represent a significant
duction, which results in a greater degree of respiration in source of ventilation to our study region.
the subducted waters. More respiration means a great degree Co-injection of oxygen below the permanent pycnocline
of oxygen consumption and thus a more negative offset from by eddy pumping has not been given close consideration in
the surface-saturated concentrations before subduction. Only previous studies, largely because it is less relevant for high-
0.6 % of the total subduction patches had 1AOU values of latitude, oxygen-rich waters. However, weak ocean ventila-
≤ −30 µmol/kg in January and February (Fig. S4b). It should tion in the tropical and subtropical mesopelagic zone is lead-
be noted that 1AOU also strongly depends on the surface wa- ing to declining oxygen concentrations (Karstensen et al.,
ter temperature (which determines the solubility of oxygen) 2008; Oschlies et al., 2018; Robinson, 2019) and expansion
when it is subducted. The π anomalies show similar varia- of oxygen minimum zones in many regions of the oceans
tion patterns with months (peaked in March), with stronger (Stramma et al., 2008; Breitburg et al., 2018). These episodic,
1π coupled with stronger 1AOU (Fig. S4c). dispersed subduction events likely represent a significant
source of ventilation to help offset the de-oxygenation phe-
3.4 Oxygen injections into the twilight zone nomenon and to support the expected climate-driven ef-
fects of increasing temperature on the metabolic oxygen de-
mand of mesopelagic organisms (Wohlers et al., 2009). En-
Global ocean inventories of oxygen have been decreasing,
riched oxygen supplies into the mesopelagic zone will also
and current climate models predict this trend is likely to ac-
influence remineralization rates of sinking particulate or-
celerate over the next century (Oschlies et al., 2018). How-
ganic carbon in the ocean’s twilight zone (Buesseler et al.,
ever, these models suffer from considerable gaps in under-
2007; Steinberg et al., 2008), affecting carbon sequestration
standing, one of which is the absence of small-scale trans-
timescales. Current global-scale biogeochemical models are
port processes such as the events captured here (Oschlies et
too coarse to capture the effect that these sub-mesoscale pro-
al., 2018). The average residual DO enrichment in the sub-
cesses may have on mesoscale oxygen variability (Takano
duction patches, defined as the difference in DO concentra-
et al., 2018) or to account for this additional oxygen supply.
tions within and adjacent to the subducted waters, was 34.5±
Overall, the intensity of these export events below the perma-
19.8 µmol O2 /kg, with levels as high as ∼ 88 µmol O2 /kg
nent pycnocline is remarkable, and they should be adequately
below 450 dbar during March. These differences reflected
considered in biogeochemical models.
∼ 20 % higher oxygen concentrations than in the surrounding
Eddy-associated pumping is also one of several pro-
mesopelagic waters. The integrated DO enrichment reached
cesses contributing to net global ocean carbon export
a maximum in March (Fig. 6d). Based on these residual
(McGillicuddy, 2016; Boyd et al., 2019), but its impor-
excess oxygen concentrations, the oxygen inventory within
tance is generally thought to be comparatively small be-
these features was estimated to be on the order of 64 to
cause the relatively shallow penetration leads to shorter car-
152 g O2 /m2 (Eqs. 1 and 2). Specifically, the DO invento-
Biogeosciences, 18, 5539–5554, 2021 https://doi.org/10.5194/bg-18-5539-2021S. Chen et al.: Episodic subduction from BGC-Argo 5549
Table 1. Statistics of the subduction patches and the associated oxygen exports into the ocean’s interior. See Sect. 2.2.2 for details on the
calculation of the DO inventory. Note that these statistics are based on the subduction patches identified, without considering their episodic
characteristics and spatial and temporal inhomogeneity. Note that the DO inventories are the average values of the amount of oxygen injected
into the ocean interior by an episodic subduction event.
Region Layer Number of Mean 1AOU Mean 1DO Mean thickness DO inventoryIA DO inventoryPH
patches (µmol/kg) (µmol/kg) (m) (g O2 /m2 ) (g O2 /m2 )
Subtropical < 450 m 56 −27.2 ± 17.7 31.2 ± 20.4 128.7 ± 27.1 51.7 ± 45.9 132.1 ± 106.2
≥ 450 m 104 −28.5 ± 15.3 36.4 ± 18.0 128.1 ± 25.8 64.3 ± 50.6 161.5 ± 103.0
Subpolar < 300 m 34 −32.9 ± 15.5 42.5 ± 17.7 127.5 ± 35.0 92.6 ± 59.7 197.5 ± 115.3
≥ 300 m 141 −25.8 ± 15.9 32.5 ± 20.9 126.6 ± 23.2 61.2 ± 53.1 142.1 ± 108.1
Whole area < 450 m 161 −29.7 ± 16.7 36.7 ± 19.7 126.8 ± 26.8 68.5 ± 52.8 160.5 ± 108.0
≥ 450 m 174 −25.6 ± 15.2 32.5 ± 19.8 128.2 ± 25.1 59.4 ± 52.5 144.3 ± 108.0
Table 2. Summary of the subduction patches associated with positive and negative π anomalies; bold numbers indicate statistics of the sum
and mean based on absolute values of π anomalies.
Statistics Number of 1AOU (µmol/kg) 1DO (µmol/kg) 1π (kg/m3 )
P P P
patches 1AOU mean(1AOU ) 1DO mean(1DO ) 1π mean(1π )
Total 335 −9248.43 −27.61 11 560.79 34.51 58.57 0.17
1π < 0 279 −8303.75 −29.76 10 743.84 38.51 −54.16 −0.19
1π > 0 56 −944.68 −16.87 816.95 14.59 4.41 0.08
Ratio (1π < 0/1π > 0) 4.98 8.79 1.76 13.15 2.64 12.28 2.47
bon sequestration times (Lévy et al., 2001; Karleskind et al., infer subduction rates, yet due to the dynamics and episodic
2011a, b; Omand et al., 2015; Nagai et al., 2015; Boyd et characteristics of eddy subduction, there are currently no es-
al., 2019). That is, much of the carbon “exported” to the up- timates of how much time these water masses maintain dif-
per mesopelagic zone over spring and summer is returned ferentiated properties in the mesopelagic zone for, and there
to the atmosphere by deep winter mixing. At higher lati- are numerous physical and biogeochemical processes influ-
tudes, where eddy pumping has been most studied, subduc- encing them.
tion must extend up to > ∼ 1000 m to reach below the per-
manent pycnocline (Palevsky and Doney, 2018; Boyd et al., 3.5 Surface forcing of subduction
2019). However, the permanent pycnocline in the western
North Pacific is much shallower – on the order of ∼ 300– The AOU, DO, and π anomalies were integrated within the
450 dbar (Qiu and Huang, 1995; Feucher et al., 2019) – and study domain over the year to assess the extent of subduc-
most of the observed subduction signals here extended far tion in the western North Pacific (Fig. 6, Table 2). π anoma-
below this depth (Tables 1 and S2). Thus although the sub- lies were divided into negative or positive 1π – i.e., π be-
duction depths shown here are similar to those observed at ing greater or less than that in surrounding waters – which
higher latitudes, they represent much longer carbon seques- can suggest their modes of formation. Negative 1π would
tration timescales than those previously associated with eddy correspond with the subduction of colder and less saline wa-
pumping (Boyd et al., 2019). As such, in addition to oxygen ters, such as along the edges of cyclonic eddies, while pos-
exports, the observed subduction patches seem to also trans- itive 1π would be associated with the eddy pumping of
port large amounts of carbon into the ocean interior partic- warmer-core, anticyclonic eddies. The subduction patches
ularly below the permanent pycnocline. However, the lack were clearly dominated by negative 1π , and more nega-
of carbon measurements on the BGC-Argo floats used in tive 1π values corresponded with much larger 1AOU and
this study impeded us from quantifying the carbon inventory 1DO values (Fig. 6, Table 2), suggesting they were associ-
within the subduction patches. ated with cyclonic, cold-core, upwelling-dominated eddies
Because the BGC-Argo profiler only captures snapshots that have higher oxygen solubilities, higher nutrient flux to
of subduction events, it is impossible to quantify the vertical the surface, and thus higher plankton production. Conversely,
transporting rate, which is needed to quantify export fluxes, the association of lower 1AOU and 1DO values with posi-
of subduction from the BGC-Argo float data alone. Alterna- tive 1π values would align with the lower oxygen solubility,
tively, the lifetime of subduction patches could be used to nutrient flux, and plankton production expected for warmer-
https://doi.org/10.5194/bg-18-5539-2021 Biogeosciences, 18, 5539–5554, 20215550 S. Chen et al.: Episodic subduction from BGC-Argo
core, downwelling, anticyclonic eddies. Moreover, the ma- ments are needed to quantify the carbon export associated
jority of deep intrusions had negative 1π values (Fig. 6, Ta- with the subduction patches. These two factors – carbon ex-
ble 2) consistent with colder waters following deeper iso- port and re-oxygenation – would help to offset the apparent
clines. In contrast, anticyclonic eddies would push warm, budget imbalance between the biological gravitational pump
lower-oxygen, and less-biomass-containing waters to shal- and mesopelagic carbon demand and would support the in-
lower depths. These findings suggest that tracking the activ- creasing metabolic oxygen demand of mesopelagic organ-
ity of cyclonic eddies in regions with shoaling permanent py- isms as ocean warming continues.
cnoclines (Chelton et al., 2011; McGillicuddy, 2016) may be
particularly important for quantifying these deeper subduc-
tion processes. Data availability. The BGC-Argo data used in this study were col-
The findings here indicate that eddy-associated subduction lected and made freely available by the International Argo Program
is an important mechanism driving oxygen enrichment be- and the national programs that contribute to it (http://www.argo.
low the permanent pycnocline across the western subtropi- ucsd.edu, last access: 5 October 2019, http://argo.jcommops.org),
archived in the Argo Global Data Assembly Centre (http://doi.
cal Pacific region, particularly near the Kuroshio Extension
org/10.17882/42182, Argo, 2021) and quality-controlled and made
(KE). Moreover, the abundance of these discrete, small-scale
available by the China Argo Real-time Data Center (http://www.
subduction events is almost certainly under-sampled in the argo.org.cn, last access: 5 October 2019). The satellite SLA and
BGC-Argo dataset. The frequency of this subduction is ex- geostrophic velocity data are from the Archiving, Validation and
pected to vary as the KE oscillates between two dynamic Interpretation of Satellite Oceanographic data (AVISO) and can be
states – quasi-stable and unstable – linked to the Pacific downloaded from the Copernicus Marine Environment Monitoring
Decadal Oscillation (PDO) or North Pacific Gyre Oscilla- Service (https://marine.copernicus.eu/, last access: 5 October 2019).
tion (NPGO) (Di Lorenzo et al., 2008). When quasi-stable,
the KE jet shifts north and generates less eddy activity than
the unstable, highly meandering, southward KE jet, which re- Supplement. The supplement related to this article is available on-
duces eastward transport and sharply increases eddy kinetic line at: https://doi.org/10.5194/bg-18-5539-2021-supplement.
energy (Qiu and Chen, 2010; Lin et al., 2014). Superimposed
on these KE oscillations has been an increase in the ratio
of cyclonic to anticyclonic eddies associated with a climate- Author contributions. SC was responsible for data processing and
driven intensification of tropical storms in the western Pa- drafting the manuscript. RXH and HX took the lead in data anal-
ysis from the perspective of physical oceanography. MLW and FC
cific and the multidecadal trend of acceleration in Kuroshio
contributed to the biogeochemical analysis, and FC designed and
flow (Zhang et al., 2020), suggesting that the importance of coordinated the overall research project. All authors contributed to
eddy-associated subduction processes in this region has been the ideas and writing of this paper.
increasing and may continue to increase in the future. This
linkage needs to be considered in designing future ocean ob-
servation programs and the modeling of global biogeochem- Competing interests. The contact author has declared that neither
ical cycles to adequately capture the damping effects that they nor their co-authors have any competing interests.
eddy-associated subduction may exert on increasing atmo-
spheric CO2 and de-oxygenation in the tropical and subtrop-
ical ocean. Disclaimer. Publisher’s note: Copernicus Publications remains
neutral with regard to jurisdictional claims in published maps and
institutional affiliations.
4 Conclusions
Biogeochemical measurements obtained from the BGC- Acknowledgements. The authors thank NSFC, Second Institute of
Argo float data provide new insights into the small-scale ver- Oceanography MNR, and the Pilot National Laboratory for Marine
tical water mass exchange in the ocean. In particular, spicity Science and Technology (Qingdao) for the financial support. The
authors also thank Argo Global Data Assembly Centre, the China
and AOU are key parameters in capturing the episodic sub-
Argo Real time Data Center, and the Copernicus Marine Environ-
duction events and their significance. Although these floats ment Monitoring Service for providing the data used in this study.
cannot capture the full pathways of subduction, they provide The authors thank Joan Llort and the two anonymous reviewers for
first-hand data on the locations, depths, timing, and strengths helping us improve the paper.
of episodic subduction patches. Here we analyze float data
in the western North Pacific and show significant subduction
export of dissolved oxygen to the mesopelagic zone particu- Financial support. This work was supported by the National
larly below the permanent pycnocline; thus, the BGC-Argo Natural Science Foundation of China (NSFC) projects (grant
data available over the global oceans can be used to extend nos. 41906159, 42030708, and 41730536), the Scientific Re-
the current study to other oceanic regions. Carbon measure- search Fund of the Second Institute of Oceanography MNR (grant
Biogeosciences, 18, 5539–5554, 2021 https://doi.org/10.5194/bg-18-5539-2021S. Chen et al.: Episodic subduction from BGC-Argo 5551
no. 14283), and the Marine S&T Fund of Shandong Province for Extension Recirculation Gyre, Deep.-Sea. Res. Pt. II., 85, 62–74,
the Pilot National Laboratory for Marine Science and Technology https://doi.org/10.1016/j.dsr2.2012.07.018, 2013.
(Qingdao) (grant no. 2018SDKJ0206). Dall’Olmo, G., Dingle, J., Polimene, L., Brewin, R. J., and Claus-
tre, H.: Substantial energy input to the mesopelagic ecosystem
from the seasonal mixed-layer pump, Nat. Geosci., 9, 820–823,
Review statement. This paper was edited by Emilio Marañón and https://doi.org/10.1038/ngeo2818, 2016.
reviewed by Joan Llort and two anonymous referees. Di Lorenzo, E., Schneider, N., Cobb, K. M., Franks, P. J. S., Chhak,
K., Miller, A. J., McWilliams, J. C., Bograd, S. J., Arango, H.,
Curchitser, E., Powell, T. M., and Riviere, P.: North Pacific Gyre
Oscillation links ocean climate and ecosystem change, Geophys.
References Res. Lett., 35, 1–6, https://doi.org/10.1029/2007GL032838,
2008.
Argo: Argo float data and metadata from Global Data As- Emerson, S., Mecking, S., and Abell, J.: The biological pump in
sembly Centre (Argo GDAC), SEANOE [data set], the subtropical North Pacific Ocean: Nutrient sources, Redfield
https://doi.org/10.17882/42182, 2021. ratios, and recent changes, Global. Biogeochem. Cy., 15, 535–
Boyd, P. W., Claustre, H., Levy, M., Siegel, D. A., and Weber, T.: 554, https://doi.org/10.1029/2000GB001320, 2001.
Multi-faceted particle pumps drive carbon sequestration in the Emerson, S.: Annual net community production and the biological
ocean, Nature, 568, 327–335, https://doi.org/10.1038/s41586- carbon flux in the ocean, Global. Biogeochem. Cy., 28, 14–28,
019-1098-2, 2019. https://doi.org/10.1002/2013GB004680, 2014.
Brainerd, K. E. and Gregg, M. C.: Surface mixed and mix- Estapa, M. L., Feen, M. L., and Breves, E.: Direct observations
ing layer depths, Deep.-Sea. Res. Pt. I., 42, 1521-1543, of biological carbon export from profiling floats in the sub-
https://doi.org/10.1016/0967-0637(95)00068-h, 1995. tropical North Atlantic, Global. Biogeochem. Cy., 33, 282–300,
Breitburg, D., Levin, L. A., Oschlies, A., Grégoire, M., Chavez, F. https://doi.org/10.1029/2018GB006098, 2019.
P., Conley, D. J., Garcon, V., Gilbert, D., Gutiérrez, D., Isensee, Feucher, C., Maze, G., and Mercier, H.: Subtropical mode water and
K., Jacinto, G.S., Limburg, K. E., Montes, I., Naqvi, S. W. A., permanent pycnocline properties in the world ocean, J. Geophys.
Pitcher, G. C., Rabalais, N. N., Roman, M. R., Rose, K. A., Res., 124, 1139–1154, https://doi.org/10.1029/2018JC014526,
Seibel, B. A., Telszewski, M., Yasuhara, M., and Zhang, J.: De- 2019.
clining oxygen in the global ocean and coastal waters, Science, Flament, P.: A state variable for characterizing water masses and
359, eaam7240, https://doi.org/10.1126/science.aam7240, 2018. their diffusive stability: spiciness, Prog. Oceanogr., 54, 493–501,
Buesseler, K. O., Lamborg, C. H., Boyd, P. W., Lam, P. J., Trull, T. https://doi.org/10.1016/S0079-6611(02)00065-4, 2002.
W., Bidigare, R. R., Bishop, J. K. B., Casciotti, K. L., Dehairs, F., Garcia, H. E. and Gordon, L. I.: Oxygen solubility in seawa-
Elskens, M., Honda, M., Karl, D. M., Siegel, D. A., Silver, M. W., ter: Better fitting equations, Limnol. Oceanogr., 37, 1307–1312,
Steinberg, D. K., Valdes, J., Mooy, B. V., and Wilson, S.: Revis- https://doi.org/10.4319/lo.1992.37.6.1307, 1992.
iting Carbon Flux Through the Ocean’s Twilight Zone. Science, Hosoda, S., Inoue, R., Nonaka, M., Sasaki, H., Sasai, Y., and
316, 567–570, https://doi.org/10.1126/science.1137959, 2007. Hirano, M.: Rapid water parcel transport across the Kuroshio
Bushinsky, S. M. and Emerson, S. R.: Biological and physical Extension in the lower thermocline from dissolved oxygen
controls on the oxygen cycle in the Kuroshio Extension from measurements by Seaglider, Prog. Earth Planet. Sci., 8, 1–19,
an array of profiling floats, Deep.-Sea. Res. Pt. I., 141, 51–70, https://doi.org/10.1186/s40645-021-00406-x, 2021.
https://doi.org/10.1016/j.dsr.2018.09.005, 2018. Huang, R. X.: Ocean Circulation, wind-driven and thermohaline
Catala, T. S., Martinez-Perez, A. M., Nieto-Cid, M., Alvarez, processes, Cambridge Press, Cambridge, 810 pp., 2010.
M., Otero, J., Emelianov, M., Reche, I., Aristegui, J., and Huang, R. X.: Defining the spicity, J. Mar. Res., 69, 545–559,
Alvarez-Salgado, X. A.: Dissolved Organic Matter (DOM) in https://doi.org/10.1357/002224011799849390, 2011.
the open Mediterranean Sea. I. Basin-wide distribution and Huang, R. X., Yu, L. S., and Zhou, S. Q.: New definition of poten-
drivers of chromophoric DOM, Prog. Oceanogr., 165, 35–51, tial spicity by the least square method, J. Geophys. Res.-Oceans.,
https://doi.org/10.1016/j.pocean.2018.05.002, 2018. 123, 7351–7365, https://doi.org/10.1029/2018JC014306, 2018.
Chai, F., Johnson, K. S., Claustre, H., Xing, X., Wang, Y., Boss, Hurlburt, H. E., Wallcraft, A. J., Schmitz Jr, W. J., Hogan, P.
E., Riser, S., Fennel, K., Schofield, O., and Sutton, A.: Moni- J., and Metzger, E. J.: Dynamics of the Kuroshio/Oyashio
toring ocean biogeochemistry with autonomous platforms, Nat. current system using eddy-resolving models of the North
Rev. Earth Environ., 1, 315–326, https://doi.org/10.1038/s43017- Pacific Ocean, J. Geophys. Res.-Oceans., 101, 941–976,
020-0053-y, 2020. https://doi.org/10.1029/95JC01674, 1996.
Chelton, D. B., Schlax, M. G., and Samelson, R. M.: Global ob- Inoue, R., Honda, M. C., Fujiki, T., Matsumoto, K., Kouketsu,
servations of nonlinear mesoscale eddies, Prog. Oceanogr., 91, S., Suga, T., and Saino, T.: Western North Pacific inte-
167–216, https://doi.org/10.1016/j.pocean.2011.01.002, 2011. grated physical-biogeochemical ocean observation ex-
Claustre, H., Johnson, K. S., and Takeshita, Y.: Observing the periment (INBOX): Part 2. Biogeochemical responses
Global Ocean with Biogeochemical-Argo, Annu. Rev. Mar. to eddies and typhoons revealed from the S1 mooring
Sci., 12, 1–26, https://doi.org/10.1146/annurev-marine-010419- and shipboard measurements, J. Mar. Res., 74, 71–99,
010956, 2020. https://doi.org/10.1357/002224016819257335, 2016a.
Cronin, M. F., Bond, N. A., Farrar, J. T., Ichikawa, H., Jayne, S. R., Inoue, R., Suga, T., Kouketsu, S., Kita, T., Hosoda, S., Kobayashi,
Kawai, Y., Konda, M., Qiu, B., Rainville, L., and Tomita, H.: For- T., Sato, K., Nakajima, H., and Kawano, T.: Western north
mation and erosion of the seasonal thermocline in the Kuroshio
https://doi.org/10.5194/bg-18-5539-2021 Biogeosciences, 18, 5539–5554, 2021You can also read