U.S. Consumer Spending Report - Soaring gas prices are reshaping how households allocate spending - Morning ...

 
CONTINUE READING
U.S. Consumer Spending Report - Soaring gas prices are reshaping how households allocate spending - Morning ...
ANALYST REPORT

  U.S. Consumer
  Spending Report
  Soaring gas prices are reshaping how
  households allocate spending

             MARCH 2022

© 2022 Morning Consult, All Rights Reserved.
U.S. Consumer Spending Report - Soaring gas prices are reshaping how households allocate spending - Morning ...
ABOUT THIS REPORT

Morning Consult’s monthly U.S. Consumer Spending Report provides a detailed assessment of
purchasing patterns reported by consumers across a variety of categories of goods and services.

Businesses and investors rely on this report to understand emerging trends in consumer demand
and shopping patterns across demographics.

The report draws on Morning Consult Economic Intelligence, a high-frequency, global economic
dataset reflecting more than 11,000 daily economic surveys across the 15 largest global economies.

                                                                                                     2
U.S. Consumer Spending Report - Soaring gas prices are reshaping how households allocate spending - Morning ...
TABLE OF CONTENTS

4      February Spending Summary

16     Housing

25     Groceries & Restaurants

37     Transportation

46     Leisure Travel

53     Recreation & Entertainment

59     Alcohol

65     Methodology

                                    3
U.S. Consumer Spending Report - Soaring gas prices are reshaping how households allocate spending - Morning ...
SECTION 1

FEBRUARY SPENDING
SUMMARY
U.S. Consumer Spending Report - Soaring gas prices are reshaping how households allocate spending - Morning ...
SUMMARY

Spending increased for most    Spending increased overall as rising prices      increased in February as many adults who
                               drove up the cost of everyday purchases.         deferred purchases during the latest case
categories in February as      The annual rate of inflation climbed to 7.9      surge unleashed pent-up demand. However,
rising incomes helped          percent in February, with costs of essential     “revenge spending” is only an option for
                               goods and services — including housing,          those who can afford it: Groups that are
support purchases of
                               groceries and gas — growing more                 more impacted by or concerned about
increasingly expensive goods   expensive. Certain groups are                    inflation cut back on discretionary spending

and services. However,         disproportionately bearing the cost of those     last month.
                               price increases: Rural adults are more
many households are            vulnerable to gas prices, and renters were
                                                                                Tax refunds may help support spending in
                                                                                the near term, but with income growth
struggling to keep pace with   more likely to report substantial increases in
                                                                                lagging inflation, current spending levels
                               housing costs compared with adults making
costs as inflation continues   mortgage payments.
                                                                                may be unsustainable. U.S. adults said they
                                                                                spent 8.4% more in February 2022 than in
to escalate.
                               Discretionary spending increased in the          the same month a year ago — a substantially
                               wake of the omicron surge, but only for          bigger jump than the year-over-year 4.9%
                               those who could afford it. Intent to travel,     increase in incomes.
                               dining out and spending on entertainment

                                                                                                                               5
U.S. Consumer Spending Report - Soaring gas prices are reshaping how households allocate spending - Morning ...
SUMMARY

      Housing                                                Grocery & Restaurants                                       Transportation
      Rising home values are starting to entice more         U.S. households are increasingly worried about their        Soaring gas prices are pressuring budgets, but they
      sellers into the market. Meanwhile, homeownership      ability to pay for groceries as prices continue to climb.   have yet to push consumers toward wider adoption of
      is becoming increasingly unaffordable due to higher    At the same time, affordability challenges are              public transit. Persistent supply disruptions and elevated
      borrowing costs and elevated inflation, which make     weighing on restaurant demand, especially among             prices for new and used vehicles aren’t diminishing
      it more difficult for potential buyers to put aside    lower-income adults, who are disproportionately             demand, but more consumers are deferring purchases,
      savings for down payments.                             impacted by rising gas and grocery prices.                  likely in the hope that prices will fall.

      Travel                                                 Recreation & Entertainment                                  Alcohol
      A higher share of adults plan to purchase trips and    Spending on recreation increased in February as             Alcohol purchases were muted in February, though a
      vacations than said the same in February 2021, as      consumers embraced experiences that they’d forgone          higher frequency of bar visits and in-person shopping
      consumers emerge from the omicron surge with           during the omicron surge. However, spending was             offered further evidence that consumer shopping
      renewed enthusiasm for travel. As the cost of living   highly concentrated among specific demographics,            behaviors have fully recovered from the latest
      climbs, however, many don’t feel they can afford the   such as younger adults and higher earners — groups          pandemic setback.
      luxury of a vacation: Lower-income adults reported     that either tend to worry less about inflation or are in
      a monthly drop in travel plans.                        a better financial position to withstand its impacts.

U.S. Spending Report | March 2022                                                                                                                                                     6
U.S. Consumer Spending Report - Soaring gas prices are reshaping how households allocate spending - Morning ...
Assessing the impact of rising gas prices on U.S. consumer spending
      Gas prices are on a tear in the wake of the war in Ukraine and the ensuing                 Monthly percent change in spending and prices, all U.S. adults
      sanctions on the Russian economy, eating up a growing share of consumers’                              Average monthly               Retail gas price
      monthly budgets. Through the end of February, consumer spending on                                     gas expenditure               m/m (month end)
      gasoline kept pace with and even exceeded price increases. The average              15%
      U.S. adult increased his or her total spend on gas by 13% in February 2022
      compared to the previous month, with the gasoline CPI up a more modest
      5.4% in February.                                                                   10%

      The rapid rise in gas prices calls into question the sustainability of consumers’
      spending patterns. This analysis addresses four fundamental questions:               5%

      • How have rising gasoline prices changed consumers’ spending patterns?
                                                                                           0%
      • Which demographic and geographic groups are being disproportionately
        affected by the spike in gas prices?

      • How are other spending categories affected by the rise in gas prices?             -5%

      • How long will these trends continue?
                                                                                          -10%
                                                                                                 Feb Mar Apr May Jun        Jul Aug Sep Oct Nov Dec Jan Feb
                                                                                                 ‘21 ‘21 ‘21 ‘21 ‘21        ‘21 ‘21 ‘21 ‘21 ‘21 ‘21 ‘22 ‘22
                                                                                                                               Source: Morning Consult Economic Intelligence, AAA

U.S. Spending Report | March 2022                                                                                                                                                   7
U.S. Consumer Spending Report - Soaring gas prices are reshaping how households allocate spending - Morning ...
Crowding out
      Rising energy costs are forcing many households to allocate a higher                                Combined share of total spending for airfare, apparel, education,
      share of total spending to gas and utilities. Many adults rely on personal                                  furniture, health care, hotels and restaurants*
      vehicles to commute to work, and cold winter temperatures across the                          21%
      country make heating essential to a functioning household. Consumers                          20%
      therefore have little choice but to absorb higher gas and utility bills and
      pay larger monthly amounts.                                                                   19%

                        Gasoline & utilities’ share of total spending*                              18%

       11%                                                                                          17%
                                                                                                                                           *Total spending excludes personal care and recreation
                                                                                                    16%
                                                                                                            Jun      Jul    Aug      Sep       Oct        Nov       Dec       Jan       Feb
                                                                                                            ‘21      ‘21    ‘21      ‘21       ‘21        ‘21       ‘21       ‘22       ‘22
      10%                                                                                                                                            Source: Morning Consult Economic Intelligence

                                                                                                    As spending on gas and utilities increased in recent months, purchases for
                                                                                                    services like health care, education, restaurants and travel, as well as
                                            *Total spending excludes personal care and recreation
                                                                                                    spending on consumer products like apparel and furniture trended lower. In
       9%                                                                                           contrast with gas and utilities, many of these categories are more likely to be
                 Jun       Jul      Aug    Sep        Oct   Nov       Dec      Jan      Feb
                                                                                                    discretionary. With prices rising faster than incomes, consumers are forced to
                 ‘21       ‘21      ‘21    ‘21        ‘21   ‘21       ‘21      ‘22      ‘22
                                                                                                    make trade-offs; for some households, this means lower spending on
      Source: Morning Consult Economic Intelligence                                                 nonessential goods and services.

U.S. Spending Report | March 2022                                                                                                                                                                    8
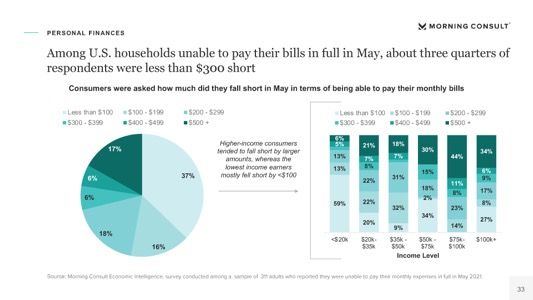
U.S. Consumer Spending Report - Soaring gas prices are reshaping how households allocate spending - Morning ...
Demographics matter
      Not all consumers are equally affected by rising gas prices. In general,                                      Gasoline & utilities’ share of total spending*, by community type
      lower-income adults tend to spend a higher share of their total monthly                                                          Rural         Suburban            Urban
      spending on gas and utilities, making them particularly vulnerable to future                            14%
      gas price increases. Low-, middle- and high-income adults allocated 0.8, 1.1                            13%
      and 0.7 percentage points more of their monthly spending to gasoline and
                                                                                                              12%
      utilities in February 2022 than they did in June 2021.
                                                                                                              11%
                 Gasoline & utilities’ share of total spending*, by income
                                                                                                              10%
               Less than $50,000               $50,000-$99,999                  $100,000 or more              9%
      12%
                                                                                                                                                      *Total spending excludes personal care and recreation
                                                                                                              8%
       11%                                                                                                            Jun     Jul     Aug      Sep       Oct       Nov        Dec        Jan       Feb
                                                                                                                      ‘21     ‘21     ‘21      ‘21       ‘21       ‘21        ‘21        ‘22       ‘22
                                                                                                                                                              Source: Morning Consult Economic Intelligence
      10%
                                                                                                              Rural Americans’ spending patterns are particularly susceptible to increases in
       9%                                                                                                     gas prices, whereas urban consumers’ spending patterns remain essentially
                                                                                                              unchanged. This stark difference in the level and change of exposure
                                                      *Total spending excludes personal care and recreation
       8%                                                                                                     underscores the importance of disaggregating Americans’ financial experiences:
                 Jun         Jul    Aug       Sep         Oct       Nov       Dec        Jan       Feb        As a growing share of wallet is taken up by energy categories, lower-income and
                 ‘21         ‘21    ‘21       ‘21         ‘21       ‘21       ‘21        ‘22       ‘22
                                                                                                              rural consumers have less left over to spend on other goods and services.
      Source: Morning Consult Economic Intelligence

U.S. Spending Report | March 2022                                                                                                                                                                             9
U.S. Consumer Spending Report - Soaring gas prices are reshaping how households allocate spending - Morning ...
Indirect impact
                 Percent change in spending among all U.S. adults from January 2022 to February 2022         Spending was higher in February across virtually
                                                                                                             all spending categories as rising prices —
           19%                                                                                               including rising gas prices — are forcing
                  17%                                                                                        consumers to spend more: Gas prices have
                         13%                                                                                 jumped an unadjusted 5.4% since January, and
                                11% 10%                                                                      grocery costs climbed 1.4% during the same time.
                                           9%
                                                 8% 8% 7%                                                    Discretionary categories like travel, personal care
                                                          7%
                                                               6%                                            and recreation bounced back from January
                                                                    4% 4% 3%
                                                                             3% 2%                           declines. The spending recovery for many of
                                                                                   2%
                                                                                           1%                these categories likely reflects a combination of
                                                                                                             seasonal factors, rising prices and renewed
                                                                                                0%
                                                                                                       -2%   comfort with engaging in certain activities as the
                                                     n                                                       omicron threat receded.
                                        se re

                                          Al e l
                              al ea lt as

                                      E d co m
                                        T e ce

                                tra ou e

                                         A p ry
                                       po ing

                                                      l
                                       s t on

                                       n s es
                                         su s
                 re

                                         G on
          ls

                            le e p ture
                      Au al c Fur es

                                Ca Ut s
                              ea and ts

                                                 ho
                                                  nt
                                      in an

                                     Re a tio

                                                   c
          e

                                                  c

                                                  r
                                                ce
              rfa

                                                 a
                                                G

                                                                                                             Rising gas prices not only impact consumers’ total

                                    r i iliti
                                                ic

                                                 n

                                               an

                                               pa
                                                ti
                                    Re eati
       ot

                                  es odu

                                               ra

                                                s

                                              co
                                 ca h c

                                              lo

                                             ra

                                            rta
                                             ni
                                             rv

                                            le

                                            ro
            Ai
      H

                                           ur
                                          uc

                                          au
                                        cr
                                          r

                                        H
                                                                                                             spending on gas and utilities — they also indirectly
                                     re

                                    ns
                                    H

                                  lth
                         to ar

                                                                                                             influence spending on other products and
                               as

                             ic
                            H
                        n

                           bl
                          on
                     so

                                                                                                             services, either by contributing to price changes
                       Pu
                        rs
                    r
                 Pe

                     Pe

                                                                                                             for other categories or by diminishing the share of
      Source: Morning Consult Economic Intelligence                                                          wallet available for discretionary purchases.

U.S. Spending Report | March 2022                                                                                                                                   10
Keeping it in perspective
                                                           Reported average monthly spending in February by category, all U.S. adults                                                $1,151

                           Total = $3,274
                          ▲ $141 from January
                                                                                                                                                                           $446

                                                                                                                                                  $160   $174     $210
                                                                                                                 $120    $137     $140     $153
                                           $55       $65       $71           $82        $85    $91   $99   $99
                   $32       $35    $43

                                                                                                                                                lo es

                                                                                                                                                 m &
           Pe ice re

                   uc re

                   tio ic

                                                      re

                                                                                                                                                             s
                                                                s

                                                                                                                                                                                     g
                                                                             re

                                                                                                                                  m
                          l

                                                                                                                                                                            y
                                                                                       re

                                                                                                           ce
                                                                                                             n

                                                                                                            ts
                                                                                                              l

                                                                                                                                                            e
                                                                                                                          s
                                                                                                           re
                       ho

                                                                                                                                                          ie

                                                                                                                                                                          er
                rta bl

                                                                                                                        Ga
                                                             el

                                                                                                                                                       nc
                                                                                                          io

                                                                                                                                                                                      in
                 rv a

                od a

                                                                                                                                              in on
                                                                                                        an

                                                                                                                                              d as
                                                                                                                                  co

                                                                                                                                          Re ans
                       s

                                                   rfa

                                                                                                                                                          t
                       n
                      ts

                                                                                       itu
                                                                        ca

                                                                                                       an
                                                                                                       pa

                                                                                                                                                   en
              se al c

             pr al c

                                                                                                                                                    ili t
                                                              t
             p o Pu
                    co

                                                                                                       at

                                                                                                                                                                        oc

                                                                                                                                                                                   us
                                                                                                                                                  ra
                                                           Ho

                                                                                                                                           an le

                                                                                                                                           rta ti
                                                                                                                                le
                                                                                                      ur
                                                 Ai

                                                                                    rn

                                                                                                    ur
                                                                                                    uc
                                                                                                   Ap
                                                                         h

                                                                                                                                                 Ut
                                                                                                                                         te rea

                                                                                                                                                                                Ho
                  Al

                                                                                                                                                su

                                                                                                                                                                      Gr
                                                                                                                              Te
                on

                on

                                                                     alt

                                                                                                  sta
                                                                                  Fu

                                                                                                                                               to
                                                                                                 ns
                                                                                                Ed

                                                                                                                                             in

                                                                                                                                           Au
                                                                  He

                                                                                                                                       en c
             rs

             rs

                                                                                              Re

                                                                                               ri

                                                                                                                                       h
           Pe

                                                                                             Ca
          ns

                                                                                                                                   alt
       tra

                                                                                                                                He
                                                                                                                                                         Source: Morning Consult Economic Intelligence

      While gas and utilities prices are eating into consumers’ monthly budgets as a                       raise prices. About 21% of monthly spending in February was allocated to
      direct result of higher energy prices, these categories combined amounted to                         consumer goods — like groceries, furniture and apparel — that are potentially
      only about 11% of monthly spending.                                                                  subject to these price pressures.
      A relatively larger portion of monthly expenditures will be indirectly impacted                      The single largest cost category is housing, which accounted for 35% of total
      by higher energy prices. Transportation categories — including public transit                        spending last month. While the housing market is relatively insulated from
      and airfare — face steeper fuel prices, pressuring margins for airlines, taxi                        energy price impacts, rents and mortgage costs are embroiled in their own set
      drivers and other mobility providers. Consumer goods categories will also face                       of price pressures, with rising rents, low inventory and climbing borrowing
      higher production and shipping costs, potentially pushing some businesses to                         costs eroding housing affordability.

U.S. Spending Report | March 2022                                                                                                                                                                        11
Income effect
      The long-run impact of rising gas prices on spending critically depends on              Share of U.S. adults who said their household earns
      income growth. As gas prices rise, will incomes keep pace? Average                                 income from various sources
      reported monthly household income increased in February as the workforce                      Money you earn from working
      continued its expansion. Compared to a year ago, average incomes                              Unemployment benefits from the government
      increased 4.9% and CPI inflation reached 7.9%, implying that purchasing      80%
      power has declined for the average American over the past year.
                                                                                   60%

                      Average reported monthly income, all U.S. adults             40%
      $2,950
                                                                                   20%
      $2,900
                                                                                    0%
       $2,850                                                                             Feb Mar    Apr May Jun     Jul   Aug Sep Oct Nov Dec Jan Feb
                                                                                          ‘21 ‘21    ‘21 ‘21 ‘21     ‘21   ‘21 ‘21 ‘21 ‘21 ‘21 ‘22 ‘22
      $2,800
                                                                                                                             Source: Morning Consult Economic Intelligence
       $2,750
                                                                                   After pandemic-related stimulus measures began to wind down in mid-2021, U.S.
       $2,700                                                                      households increasingly relied on wage incomes to support spending. In February
      $2,650                                                                       2022, 61% of adults earned income from working, up from 57% the year prior.
                                                                                   Meanwhile, 13% of adults now say they rely on unemployment benefits from the
      $2,600                                                                       government, down from 19% last year. If price growth continues to outpace incomes,
                 Feb ‘21 Apr ‘21 Jun ‘21 Aug ‘21 Oct ‘21 Dec ‘21 Feb ‘22
                                                                                   the rate of spending growth may become unsustainable: Consumers will increasingly
      Source: Morning Consult Economic Intelligence                                need to choose whether to curb purchases, dip into savings or take on more debt.

U.S. Spending Report | March 2022                                                                                                                                            12
Tax filing season provides some relief
      More than a third of adults who have filed their returns and expect to receive a       Average reported tax refund amount, among U.S. adults who already
      refund haven't gotten it yet, implying that many will receive a boost to incomes                            received their tax refund
      over the next few months when refunds are paid out. This additional income will
      provide Americans much-needed, albeit temporary, financial relief in the face of
                                                                                         Jan '22                $2,416
      rising gas prices.

                     Respondents were asked which of the following best
                        represents the status of their 2021 tax filings                  Feb '22                                                               $2,845

          I have filed my
          taxes and already                           13%           17%                                                              Source: Morning Consult Economic Intelligence
          received my refund
                                                      6%
          I have filed my taxes                                     19%                  The average reported refund in February was $2,845 — an amount that would
          and expect to receive                                                          double monthly reported incomes for the average U.S adult. As many
          a refund, but haven’t                                     9%
          received it yet                                                                households feel the strain of rising prices for everyday goods and services, the
                                                      65%                                payout would be a welcome stopgap to help keep pace with inflation.
          I have filed my taxes
          and do not expect to                                     45%                   However, some households — such as those with children under age 18 — may
          receive a refund                                                               receive a smaller payout this year: The expanded Child Tax Credit program
          I have not yet filed                                                           delivered monthly checks to most eligible parents over the second half of 2021.
          my taxes                                    11%           10%                  Only a small minority of those who qualify for the credit opted out of receiving
          Don’t know                              Jan '22         Feb '22                the payments in advance, so most households will miss out on the lump sum
      Source: Morning Consult Economic Intelligence
                                                                                         payout this tax season.

U.S. Spending Report | March 2022                                                                                                                                                    13
Gasoline prices are still center stage
      February was only the beginning of the latest jump in energy prices, which for           PRICES AT THE PUMP RIP INTO POCKETBOOKS
      consumers are most visible at the gas pumps. While the latest increase
                                                                                                           Daily retail gas prices/gallon
      arrived in early March (a foreboding sign for consumer pocketbooks in the
      current month), prices in February rose 18 cents on average.                     $4.4
                                                                                                                     Russia invades
      • When looking at month-end comparisons, gas rose 24 cents (7.1% change ).                                            Ukraine
                                                                                       $4.2
      • By the end of the month, prices had risen by 33 cents (or 10.1%) relative to
                                                                                       $4.0
        the beginning of the year. Through mid-March, gas prices grew another 70
        cents (19.3%) to $4.32.
                                                                                       $3.8
      • Regardless of the move over the past few months, gas costs have been
                                                                                       $3.6
        steadily rising since the beginning of 2021 — prices are $2/gallon higher
        today — a nagging problem for consumers that has yet to abate.                 $3.4

                                                                                       $3.2
                                                                                              Jan Jan Jan Jan Jan Feb Feb Feb Feb Mar Mar Mar Mar
                                                                                               1   8   15 22 29    5   12 19 26    5  12 19 26

                                                                                                                                                                  Source: AAA
                                                                                                                 Note: Daily National Average Gasoline Prices Regular Unleaded

U.S. Spending Report | March 2022                                                                                                                                                14
Spending intentions
      Despite the headwinds facing U.S. adults, spending intentions remain              However, there are indications that spending momentum may start to fade.
      relatively optimistic. Consumers are slightly more likely plan to spend more in   Morning Consult’s Daily U.S. Index of Consumer Sentiment — which tends to
      March than to intend to cut back on purchases. So far, rather than suppress       be a leading indicator of spending — has been sliding lower through early
      overall consumer demand, rising prices — including for gas — have mostly          March, falling below the previous low set in April 2020 during the early days of
      impacted consumers by reshaping spending allocations.                             pandemic fallout. Weekly retail sales estimates from the Chicago Fed Advance
                                                                                        Retail Trade Summary (CARTS) showed deterioration in spending levels at the
                  Respondents were asked how they expect their spending in              end of February, suggesting weakening conditions heading into this month.
                    March to compare to their spending in February 2022
                                                                                        Through mid-March, daily gas prices grew an additional 70 cents per gallon,
                                    9%                                                  equating to a 19% jump, compared with a 7% increase from the end of January
                         9%
                                                      A lot less than last month        to the end of February. Oil prices are beginning to retreat, but the magnitude of
                                          10%                                           the elevation in price levels suggest the impact of gas prices on spending is
           17%                                        A little less than last month     likely to be even more pronounced in March than in February.

                                                      About the same as last month      The most financially vulnerable demographics — including lower-income
                                                                                        earners, who tend to have less of a buffer to absorb rising costs of living—
                                                      A little more than last month     already showed signs of softer spending in February by cutting back on
                                                                                        discretionary purchases. As price growth continues to outpace income growth
                                    55%               A lot more than last month
                                                                                        in the near term, household budgets are likely to become increasingly strained,
                                                                                        possibly triggering a similar pattern of diminished demand among middle and
                                                                                        potentially even higher income adults
      Source: Morning Consult Economic Intelligence

U.S. Spending Report | March 2022                                                                                                                                           15
SECTION 2

HOUSING
HOUSING KEY TAKEAWAYS

1      Increases in monthly housing costs are disproportionately impacting renters.
       Housing prices are climbing for both owners and renters, but relatively short lease terms leave renters
       more exposed to market prices than the homeowners paying off 30-year mortgages.

2      Lower-income adults reported a larger increase in housing payments than
       higher earners.
       Adults in households earning less than $50,000 per year paid 10% more for housing in February 2022
       than they did a year earlier.

3      Affordability challenges increasingly discourage buyers.
       High housing prices — and increased skepticism about homebuying as an investment — are
       encouraging more sellers into the market. Meanwhile, buyers seem increasingly discouraged about
       their homeownership prospects, deciding instead to defer purchases.

                                                                                                                 17
Housing costs continue to climb, with renters bearing the brunt of spending growth
                                                                    Average monthly spending on housing, by homeownership status

                                                              Renters                                                           Homeowners with mortgage

          $1,000                                                                                      $1,500

                                                                                                      $1,400
                                                                                                                                                                                   ⊲ 0% y/y
                                                                                          ▲ 15% y/y
            $900
                                                                                                      $1,300

            $800                                                                                      $1,200
                      ‘21             1        ‘21            ‘21           1       21       ‘22                ‘21       ‘21          ‘21       ‘21        t ‘2
                                                                                                                                                                1          ‘21          ‘22
                    b             r ‘2       n                          t ‘2      c‘                          b         r            n         g           c             c            b
                  Fe            Ap         Ju             Au
                                                            g
                                                                      Oc
                                                                                De
                                                                                         Fe
                                                                                           b                Fe        Ap           Ju        Au           O            De           Fe
          Source: Morning Consult Economic Intelligence                                                                                            Source: Morning Consult Economic Intelligence

      As housing prices continue to climb, renters report having increased spending                   difficult to accumulate savings for a down payment, adding yet another
      over the past year by a wider margin than homeowners with mortgages.                            obstacle to homeownership on top of rising mortgage rates and low inventory.
      For renters hoping to buy homes, climbing rental costs will make it more

U.S. Spending Report | March 2022                                                                                                                                                                  18
Lower-income adults continue to face the steepest housing cost increases compared
      with a year ago
                                                             Average monthly spending on housing, by income

                                    Less than $50,000                                $50,000-$99,999                                            $100,000 or more
     $1,000                                                  $1,500                                                        $2,200

       $900                                                  $1,400                                                        $2,100

       $800                                                  $1,300                                                        $2,000

       $700                                                  $1,200                                                        $1,900

       $600          ‘22                                     $1,100                                                        $1,800
                      ‘21

                                                                                                                                           ‘21
                      ‘21

                      ‘21

                                                                                                                                           ‘21

                                                                                                                                           ‘21
                      ‘21

                      ‘2 1
                      ‘21

                                                                                                                                           ‘21

                                                                                                                                           ‘2 1
                                                                                                                                           ‘21
                      ‘21

                                                                                                                                           ‘21
                      ‘21
                      ‘2 1

                      ‘21

                                                                                                                                           ‘21
                                                                                                                                           ‘2 1

                                                                                                                                           ‘21
                      ‘21

                                                                                                                                           ‘21
                     ‘22

                                                                                                                                          ‘22
                                                                                                                                         ‘22
                                                                             ‘21
                                                                             ‘21
                                                                             ‘21
                                                                             ‘2 1

                                                                             ‘21
                                                                             ‘21

                                                                            ‘22
                                                                            ‘22
                                                                             ‘21

                                                                             ‘21

                                                                             ‘21
                                                                             ‘21

                                                                             ‘2 1
                A pr

                                                                                                                                     A pr
               Sep

               Nov

                                                                                                                                    Sep

                                                                                                                                    Nov
                Jun

                Oct
                 Jul

                                                                                                                                     Jun

                                                                                                                                     Oct
                                                                                                                                      Jul
               Aug

                                                                                                                                    Aug
               Feb
               Mar

               Dec

                                                                                                                                    Feb
                                                                                                                                     Mar

                                                                                                                                    Dec
               May

                                                                                                                                    May
                                                                        Jul
                                                                      Aug
                                                                      Feb
                                                                       Mar

                                                                      Dec
                                                                      May
                                                                       A pr

                                                                      Sep

                                                                      Nov
                                                                       Jun

                                                                       Oct
               Feb
               Jan

                                                                                                                                    Jan
                                                                                                                                    Feb
                                                                      Jan
                                                                      Feb
      Source: Morning Consult Economic Intelligence                   Source: Morning Consult Economic Intelligence                       Source: Morning Consult Economic Intelligence

      Adults whose households earn less than $50,000 per year reported the                     middle-income group. Housing is one of multiple categories where inflation is
      strongest increase in monthly housing payment amounts in February                        disproportionately challenging lower earners: This group also tends to spend a
      compared with a year ago, with average outlays growing 10%, compared with                relatively higher share of wallet on groceries and gas, categories with soaring
      flat housing cost growth for the highest earners and a slight decline for the            price growth over the past year.

U.S. Spending Report | March 2022                                                                                                                                                         19
Monthly housing costs for Gen Z adults stabilized in recent months as moves trended lower
                                Average monthly spending on housing,                              Share of adults who said they moved in the past month,
                                          by generation                                                               by generation

                     Gen Z adults           Millennials      Gen Xers   Baby boomers               Gen Z adults       Millennials       Gen Xers           Baby boomers
      $1,400                                                                             10%
      $1,300                                                                              8%
      $1,200
                                                                                          6%
       $1,100
                                                                                          4%
      $1,000
        $900                                                                              2%

        $800                                                                             0%
                   Feb Mar Apr May Jun                Jul Aug Sep Oct Nov Dec Jan Feb          Feb Mar Apr May Jun          Jul Aug Sep Oct Nov Dec Jan Feb
                   ‘21 ‘21 ‘21 ‘21 ‘21                ‘21 ‘21 ‘21 ‘21 ‘21 ‘21 ‘22 ‘22          ‘21 ‘21 ‘21 ‘21 ‘21          ‘21 ‘21 ‘21 ‘21 ‘21 ‘21 ‘22 ‘22
      Source: Morning Consult Economic Intelligence                                                                                 Source: Morning Consult Economic Intelligence

      The youngest generation reported the largest increase in housing spending         As Gen Z moves drifted lower, millennials switched homes more frequently,
      over the past year, with average monthly expenditures jumping 34% since           with the share who said they moved in the past month climbing to its highest
      February 2021. Gen Zers were also the generation that moved most frequently       point in over a year in February. These adults seem to be moving to homes
      throughout most of the year, leading to relatively more volatile housing          with relatively lower monthly payments, potentially indicating that many
      payment amounts. Since September, housing costs have fluctuated slightly less     millennials — a growing share of whom are supporting not only their own
      for this group as the pace of moves began to ease.                                expenses but those of young children — may be pursuing more affordable
                                                                                        housing situations as inflation drives up costs for other categories.

U.S. Spending Report | March 2022                                                                                                                                                   20
The share of rural and suburban adults who expect home price appreciation over the next
      year set new series highs in February
      • The share of U.S. adults expecting housing price                   Share of U.S. adults who expect housing prices to increase in the next 12 months,
        increases over the next 12 months rose to 62% in                                                 by community type
        February, from 40% during the same month a year ago.
                                                                                             All U.S. adults     Rural       Suburban       Urban
      • The increase in price expectations was driven by rural
                                                                                                                      The share of suburban adults expecting price
        and suburban adults. The share of adults in nonurban
                                                                                                                                     increases has climbed to 69%
        areas who anticipate home price growth set new series
                                                                     80%
        highs last month, whereas city dwellers’ price
        expectations eased lower.                                    70%

      • Perceptions of overall inflation and its future trajectory   60%
        may be influenced by consumers’ exposure to visible          50%
        price increases. Rural and suburban adults tend to rely      40%
        more on driving, and therefore are more likely to have
                                                                     30%
        noticed the signs marking an increase in gas prices.
        Expectations that overall price levels will rise could be    20%
        contributing to views on home values.                        10%
                                                                     0%
                                                                            Feb    Mar    Apr   May     Jun    Jul   Aug   Sep    Oct    Nov    Dec    Jan     Feb
                                                                            ‘21    ‘21    ‘21   ‘21     ‘21    ‘21   ‘21   ‘21    ‘21    ‘21    ‘21    ‘22     ‘22
      Source: Morning Consult Economic Intelligence

U.S. Spending Report | March 2022                                                                                                                                    21
More adults see homebuying as a poor investment, despite expectations for rising prices
       Share of U.S. adults who said buying a home in their ZIP code is a very bad or somewhat bad investment                         • Elevated price expectations should indicate
                                                                                                                                        that consumers view real estate as a
                                                                                                                                        promising investment.
      13%
                                                                                                                                      • However, the share of U.S. adults who said
      12%
                                                                                                                                        they view home purchasing in their
       11%                                                                                                                              neighborhood as a somewhat or very bad
                                                                                                                                        investment climbed to 12% in February, up 4
      10%
                                                                                                                                        points from the same time in 2021.
       9%
                                                                                                                                      • Recent pessimism could be the result of
       8%
                                                                                                                                        rising interest rates, as some consumers
        7%                                                                                                                              may feel that they missed the boat for
                                                                                                                                        affordable loans.
       6%

       5%                                                                                                                             • Others may simply view current prices as
                                                                                                                                        prohibitively expensive, limiting their ability
       4%                                                                                                                               to afford other expenses or potential
               b ‘21   r ‘21          r ‘21   y ‘21     n ‘21     l ‘21     g ‘21   p ‘21     t ‘21   v ‘21   c ‘21     ‘22     ‘22     investments with a relatively higher payoff.
             Fe      Ma             Ap      Ma        Ju        Ju        Au      Se        Oc
                                                                                                    No      De      Ja
                                                                                                                      n
                                                                                                                            Fe
                                                                                                                              b

      Source: Morning Consult Economic Intelligence

U.S. Spending Report | March 2022                                                                                                                                                         22
The share of prospective sellers surpassed that of homebuyers for the first time
      • The share of adults planning to sell their homes                Share of U.S. adults planning to buy or sell a home in the next 12 months
        over the next 12 months rebounded to 14.1% in
        February, surpassing the share of adults
        planning to buy for the first time in Morning                                                   Sell     Buy
        Consult tracking.                                   25%

      • Compared with the same month a year ago,
        there are more planned sellers and fewer            20%
        potential buyers, possibly signaling an easing of
        supply pressures heading into the spring.
                                                            15%
      • Homebuying demand has been relatively strong
        over the past year, with buyers tending to
                                                            10%
        outnumber sellers. However, escalating costs for
        both home prices and mortgage rates —
        combined with higher prices for many other          5%
        goods and services — may be weighing down
        demand. Sellers, meanwhile, look increasingly
                                                            0%
        eager to capitalize on ballooning home values —
                                                                  Feb    Mar     Apr    May    Jun Jul ‘21 Aug       Sep    Oct     Nov       Dec       Jan      Feb
        and are potentially feeling pressure to sell              ‘21    ‘21     ‘21    ‘21    ‘21         ‘21       ‘21    ‘21     ‘21       ‘21       ‘22      ‘22
        sooner rather than later as interest rates
        threaten to limit their pool of potential buyers.
                                                                                                                           Source: Morning Consult Economic Intelligence

U.S. Spending Report | March 2022                                                                                                                                          23
Average monthly utilities costs climbed 9 percent over the past year, driven by higher prices
                 Monthly percent change in spending on utilities vs. utilities consumer                              Percentage change in average spending from
                     price index (CPI), all U.S. adults (Indexed to February 2021)                                    February 2021 to February 2022, by region

                     Monthly spending on utilities               Energy services consumer price index
                                                                                                                  11.6%                                                          10.9%
      14%                                                                                                                             8.7%

      12%                                                                                                                                                   2.3%

      10%
                                                                                                                  West              Midwest              Northeast               South
       8%
                                                                                                                       Source: Morning Consult Economic Intelligence, Bureau of Labor Statistics
       6%

       4%                                                                                                  • U.S. adults in all regions spent more on utilities in February than
                                                                                                             they did during the same period in 2021 as rising energy prices
       2%
                                                                                                             drove up heating costs. The Northeast stood out due to relatively
       0%                                                                                                    modest spending increases, with above-average temperatures in
                                                                                                             February potentially reducing the amount of heating used.
      -2%

      -4%                                                                                                  • The milder spring weather may bring some relief for utilities

             b ‘21             r ‘21          n ‘21           g ‘21            t ‘21     c ‘21       ‘22
                                                                                                             costs. Prices, however, are unlikely to fall soon: The Russia-
           Fe                Ap             Ju              Au               Oc        De        Fe
                                                                                                   b         Ukraine crisis has disrupted global energy supply and continues
                                                                                                             to apply upward price pressure.
      Source: Morning Consult Economic Intelligence, Bureau of Labor Statistics

U.S. Spending Report | March 2022                                                                                                                                                                  24
SECTION 3

GROCERIES &
RESTAURANTS
GROCERIES & RESTAURANTS KEY TAKEAWAYS

1      Grocery prices continue to climb amid persistent supply disruptions and rising
       production costs.
       Grocery spending increased for a third consecutive month as rising food prices drove up grocery bills.

2      Lower-income adults are disproportionately impacted by higher grocery prices.
       Adults earning less than $50,000 per year allocated more than 15% of total spending to groceries,
       compared with 12% for the highest-income earners.

3      Inflation is muting restaurant demand, especially for lower-income adults.
       As prices for groceries and other staple categories pressure household budgets, restaurant spending
       is being crowded out by other spending priorities.

                                                                                                                26
Grocery spending climbed for a third consecutive month amid higher food costs
      Grocery spending was 4.1% higher for U.S. adults in February compared with                      Food consumer price index (CPI), all U.S. adults
      the same month a year ago. Prices for groceries have risen sharply over the      280
      past 12 months, amid supply chain disruptions, with the CPI for food consumed
      at home up 8.6% year over year. Persistent shortages and higher commodity        270
      costs are continuing to stoke inflation for food and ingredients.
                                                                                       260
                      Average monthly spending on groceries, all U.S. adults
                                                                                       250
      $460
                                                                                       240

                                                                                            b‘
                                                                                              21        r ‘21      n‘
                                                                                                                     21
                                                                                                                              g‘
                                                                                                                                21         t ‘2
                                                                                                                                               1
                                                                                                                                                         c‘
                                                                                                                                                           21             ‘22
                                                                                           e          Ap          u          u            c             e               b
                                                                                          F                      J          A            O             D              Fe
      $435                                                                                                                     Source: Morning Consult, Bureau of Labor Statistics

                                                                                       Food prices have trended consistently higher over the past year, while average
                                                                                       monthly spending amounts for groceries varied from month to month. One
                                                                                       driver of inconsistent monthly spending amounts could be school closures:
                                                                                       Parents need to supply fewer meals at home when children are relying on
       $410
                                                                                       school lunches. The relatively smaller annual increase in spending amounts
                21          r ‘2
                                1        21          21     t ‘2
                                                                1       21       ‘22
             eb‘           p          un‘         ug‘      c         ec‘       b       compared with price suggests that some consumers may be buying fewer
            F             A          J           A        O         D        Fe
                                                                                       items or selecting lower-priced options from grocery aisles in order to stretch
      Source: Morning Consult Economic Intelligence                                    grocery budgets as prices climb.

U.S. Spending Report | March 2022                                                                                                                                                    27
Lower-income adults are relatively more impacted by higher grocery prices
                                                      Share of total spending allocated to groceries in February 2022, by income

                               Less than $50,000                                  $50,000-$99,999                                             $100,000 or more
                                    Grocery   Other                                 Grocery     Other                                            Grocery        Other

                                              15%                                              13%                                                            12%

                               85%                                                 87%                                                         88%

      Adults from households earning less than $50,000 per year reported spending             have relatively less in savings, so the most financially vulnerable adults are also
      a relatively higher share of total spending on groceries. As food prices climb,         the ones most likely to struggle as a result of higher food costs.
      this group is therefore disproportionately impacted. Lower earners tend to
                                                                                                                       Source: Morning Consult Economic Intelligence, Bureau of Labor Statistics

U.S. Spending Report | March 2022                                                                                                                                                                  28
Midwesterners and Southerners report strongest spending growth on groceries
      since a year ago
                                               Average monthly spending on groceries, by region                                                         Monthly percentage change
                                                                                                                                                        between February 2021 and
                                                        West          Midwest             Northeast        South                                         February 2022, by region
      $490

       $470                                                                                                                                                      West                2%

      $450
                                                                                                                                                             Midwest                      8%
      $430
                                                                                                                                                           Northeast       -5%
       $410

      $390                                                                                                                                                      South                   8%

       $370
                   ‘21         ‘21       ‘21           21       ‘21     l ‘2
                                                                            1       ‘21         ‘21     t ‘2
                                                                                                            1       ‘21       ‘21       22       22
                 b           r         r          y‘          n        u          g           p        c          v         c         n‘       b‘
               Fe          Ma        Ap         Ma          Ju        J         Au          Se        O         No        De        Ja       Fe

      Source: Morning Consult Economic Intelligence                                                                                                   Source: Morning Consult Economic Intelligence

U.S. Spending Report | March 2022                                                                                                                                                                     29
Concerns over food affordability remained elevated in February, especially among
      lower-income adults
      Food insecurity is becoming a growing concern for U.S. households,                                  Share of respondents who said they are not confident in their
      especially among relatively lower-income adults. Incomes have been                                      ability to pay their monthly grocery bills, by income
      increasing, but not fast enough to keep up with the rising cost of living.                                                    Jan '22           Feb '22
      As a result, the share of consumers who lack confidence in their ability to
      afford groceries ticked higher in February.                                                                                                                       16.3%
                                                                                                      Under $50,000
               Share of respondents who said they are not confident in their                                                                                                  17.9%
                  ability to pay their monthly grocery bill, all U.S. adults
                                                                                                                                            8.0%
                                                                                                    $50,000-$99,999
                                                                13.4% 13.7%          13.2% 13.3%                                     6.5%
                                                        12.6%
       11.8%
                                          11.0% 10.7%
                              9.9% 9.3%
                                                                                                                                   5.7%
                7.7% 8.0%                                                     8.2%                  $100,000 or more
                                                                                                                                     6.1%
                                                                                                                                              Source: Morning Consult Economic Intelligence

                                                                                                   More than 1 in 6 adults from households earning less than $50,000 per year
                                                                                                   said in February that they weren’t confident in their ability to cover grocery
       Feb Mar Apr May Jun                 Jul Aug Sep Oct Nov Dec Jan Feb                         bills, emphasizing the relative vulnerability of this group compared with
       ‘21 ‘21 ‘21 ‘21 ‘21                 ‘21 ‘21 ‘21 ‘21 ‘21 ‘21 ‘22 ‘22                         higher earners. The highest-income group also reported a slight increase in
      Source: Morning Consult Economic Intelligence                                                food affordability worries last month as inflation concerns percolated.

U.S. Spending Report | March 2022                                                                                                                                                             30
Food price expectations set a new series high, with 90% of baby boomers expecting
      further increases
      • Ninety percent of adults ages 65 and older expect food prices to                Share of U.S. adults expecting food prices to increase
        rise over the next 12 months, up from 66 percent in February                                in the next 12 months, by age
        2021. People in this age group, many of whom are retired and
                                                                                       All adults     18-34       35-44       45-64           65 and over
        living off of fixed incomes, tend to worry more about inflation than   100%
        working adults, who can expect wages to rise along with prices.        90%

      • Adults under 35 remain least likely to expect price increases —        80%
        but expectations have trended higher for this group as well. The       70%
        share of adults ages 18-34 who are expecting price increases           60%
        climbed 16 points over the past year, compared with 24 points for
                                                                               50%
        the oldest group.
                                                                               40%
      • Supply chain disruptions have already contributed to heighted          30%
        price growth for food and groceries, but inflationary pressures        20%
        intensified further over the past month. Ingredients like wheat are
                                                                                10%
        global commodities, so costs for food inputs are being impacted
                                                                                0%
        by the Russia-Ukraine conflict. Furthermore, higher prices for

                                                                                                1

                                                                                                1

                                                                                               2
                                                                                              21
                                                                                              21

                                                                                                1
                                                                                                1
                                                                                                1

                                                                                                1
                                                                                                1
                                                                                                1
                                                                                               1

                                                                                               2
        energy and labor are adding to food production and delivery

                                                                                             ‘2

                                                                                             ‘2

                                                                                             ‘2
                                                                                             ‘2
                                                                                             ‘2

                                                                                             ‘2
                                                                                             ‘2
                                                                                             ‘2
                                                                                             ‘2

                                                                                            ‘2
                                                                                            ‘2
                                                                                           l‘
                                                                                          r‘

                                                                                         ay

                                                                                          v

                                                                                          c
                                                                                          g
                                                                                         ar

                                                                                          p

                                                                                         ct
                                                                                          n
                                                                                   b

                                                                                        Ju

                                                                                         b
                                                                                         n
                                                                                       Ap

                                                                                      No

                                                                                      De
                                                                                       Ju

                                                                                      Au

                                                                                      Se
                                                                                 Fe

                                                                                       O

                                                                                      Ja

                                                                                      Fe
                                                                                      M
        costs and reinforcing concerns about inflation.

                                                                                      M
                                                                                                                           Source: Morning Consult Economic Intelligence

U.S. Spending Report | March 2022                                                                                                                                          31
In-person grocery trips per month reached their highest level since September, while online
      orders changed little
                 Average monthly visits to grocery stores,                                Average monthly online grocery orders,                         • U.S. consumers visited grocery stores
                            all U.S. adults                                                          all U.S. adults                                       in person at their highest rate since
                                                           ▲ 0.2 since                                                          ▼ 0.3 since                September 2021 as the omicron variant
                                                        February 2021                                                        February 2021                 retreated and online orders stayed
                                                                                                                                                           close to their level the previous month.
                           6.2                6.2 6.1
          5.8 5.9 5.9               6.0 5.8                             6.0
                                                        5.7 5.8 5.6 5.7                                                                                  • In-person shopping frequency
                                                                                                                                                           increased over the past year while
                                                                                                                                                           online orders declined, suggesting any
                                                                                                                                                           pandemic-triggered trend toward
                                                                                                                                                           grocery delivery over traditional
                                                                                                                                                           shopping methods has stalled.
                                                                                         2.4
                                                                                   2.2         2.1 2.2                       2.0 2.1 1.9
                                                                                                         1.9 1.9                         1.8 1.9
                                                                                                                   1.7 1.9                               • Supply chain disruptions may be a
                                                                                                                                                           contributor: When a desired item is out
                                                                                                                                                           of stock, consumers may prefer to
                                                                                                                                                           select an alternative themselves rather
      N 21
      De 21

      Fe 22
       Ju 1

        Ju 1
       Ap 1

      Ja 21
       O 1
      Se 21

                2
       M 21

      M ‘21

      Au 21

                                                                               Ju 1

                                                                                Ju 1
                                                                               Ap 1

                                                                              Ja 21
                                                                               O 1
                                                                              Se 21

                                                                                        2
                                                                               M 21

                                                                              M ‘21

                                                                              Au 21

                                                                              N 21
                                                                              De 21

                                                                              Fe 22
              ‘2
              ‘2
              ‘2

              ‘2

                                                                                      ‘2
                                                                                      ‘2
                                                                                      ‘2

                                                                                      ‘2
            ‘2

                                                                                    ‘2
              ‘
              ‘
              ‘
              ‘
             ‘

           l‘

                                                                                      ‘
                                                                                      ‘
                                                                                      ‘

                                                                                   l‘

                                                                                      ‘
                                                                                      ‘
            ‘

                                                                                    ‘
         ct
        ov
         ay

          n
         ar

          c
          p
          g
          b

          r

                                                                                 ay

                                                                                  n
                                                                                 ar

                                                                                  c
                                                                                  p
                                                                                  g
                                                                                  b

                                                                                  r

                                                                                 ct
                                                                                ov
                                                                                                                                                           than rely on pickers.
         n
         b

                                                                                 b
                                                                                 n
    Fe

                                                                              Fe

      Source: Morning Consult Economic Intelligence                                                      Source: Morning Consult Economic Intelligence

U.S. Spending Report | March 2022                                                                                                                                                                     32
Restaurant spending fell on an inflation-adjusted basis compared with a year ago
                                           Average monthly spending on restaurants, all U.S. adults                               • Restaurant spending rebounded from January
                                                                                                                                    as the omicron case surge subsided and
                                                                                                                                    many adults reported higher comfort levels
                                                                                                           ▲ 0.6% since             with dining out.
                                             $107                                                         February 2021
                                                                                                                                  • Compared with a year ago, however,
                                                                                                                                    restaurant spending increased just 0.6% on a
                                                                                                                                    nominal basis. The Bureau of Labor Statistics’
                       $102         $101                                 $101                                                       restaurant price index rose 6.8% over this
                                                                $100                                                                same period, meaning inflation-adjusted
                                                                                           $99                              $99
            $98                                                                                                                     restaurant spending declined.
                                                       $97
                                                                                  $96                      $96                    • Relatively weak restaurant demand is likely a
                                                                                                   $95              $95
                                                                                                                                    sign that elevated concerns over inflation are
                                                                                                                                    pushing consumers toward frugality. While
                                                                                                                                    food purchases in general are an essential
                                                                                                                                    good, dining out tends to command a
                                                                                                                                    premium over meals at home, becoming more
          b ‘21      r ‘2
                         1
                                 r ‘2
                                     1
                                         y ‘21        n ‘21     l ‘2
                                                                    1
                                                                        g ‘21   p ‘21     t ‘2
                                                                                              1
                                                                                                  v ‘21   c ‘21     ‘22     ‘22
                    a           p                              u                         c                        n       b
        Fe         M           A       Ma           Ju        J       Au      Se        O       No      De      Ja      Fe          difficult to justify as costs increase.

      Source: Morning Consult Economic Intelligence

U.S. Spending Report | March 2022                                                                                                                                                    33
High-income earners were the only group that increased restaurant spending over the past year
                                                                 Average monthly spending on restaurants/takeout, by income

                                    Less than $50,000                                         $50,000-$99,999                                              $100,000 or more
      $100                                                             $130                                                        $160

       $90                                                             $120                                                        $150

       $80                                                             $110                                                        $140

        $70         Spending on restaurant meals has                   $100                                                        $130
                    trended steadily lower since early 2021
                    for the lowest income group
       $60                                                             $90                                                         $120

                                                                                          1
                                                                                          1

                                                                                          1
                                                                                         1
                                                                                1

                                                                                         2
                                                                                        21

                                                                                                                                                      1

                                                                                                                                                      1
                                                                                                                                                      1
                                                                                                                                            1

                                                                                                                                                     2
                                                                                                                                                    21

                                                                                                                                                     1
                            1
                            1

                            1
                           1
                1

                           2
                          21

                                                                                       ‘2
                                                                                       ‘2

                                                                                       ‘2
                                                                                       ‘2
                                                                              ‘2

                                                                                                                                                   ‘2

                                                                                                                                                   ‘2
                                                                                                                                                   ‘2
                                                                                                                                          ‘2

                                                                                                                                                   ‘2
                                                                                      ‘2
                         ‘2
                         ‘2

                         ‘2
                         ‘2
              ‘2

                                                                                                                                                  ‘2
                        ‘2

                                                                                     r‘

                                                                                                                                                r‘
                       r‘

                                                                                     c
                                                                                    g

                                                                                    ct
                                                                                    n
                                                                           b

                                                                                                                                               g

                                                                                                                                               ct
                                                                                                                                               n
                                                                                                                                       b

                                                                                                                                                c
                                                                                   b
                       c
                      g

                      ct
                      n
           b

                                                                                  Ap

                                                                                                                                              b
                                                                                 De

                                                                                                                                             Ap
                                                                                  Ju

                                                                                 Au
                     b

                                                                         Fe

                                                                                                                                            De
                    Ap

                                                                                                                                             Ju

                                                                                                                                            Au
                                                                                                                                     Fe
                                                                                  O
                   De

                                                                                 Fe
                    Ju

                   Au
         Fe

                                                                                                                                             O

                                                                                                                                            Fe
                    O

                   Fe

                 Source: Morning Consult Economic Intelligence                  Source: Morning Consult Economic Intelligence               Source: Morning Consult Economic Intelligence

      Despite a strong recovery in the labor market over the past year, consumers                    Statistics — expenditures look even weaker. As inflation becomes
      earning less than $100,000 per year spent less on meals from restaurants in                    increasingly worrisome for U.S. adults, cutting back on restaurant spending
      February than during the same month a year ago. After accounting for price                     is a natural response for many, especially among lower-income adults, who
      growth — which was 6.8% over this period according to the Bureau of Labor                      tend to be more cost conscious.

U.S. Spending Report | March 2022                                                                                                                                                           34
Takeout and delivery orders fell compared with a year ago as consumers concentrated
      more spending on groceries
                   Average monthly visits to restaurants,                           Average monthly takeout/delivery orders,                          • In February, consumers’ monthly
                             all U.S. adults                                                    all U.S. adults                                         visits to restaurants rebounded to its
                                                                                                                                                        highest level since August 2021.

                                                      ▲ 0.2 since                                                             ▼ 0.2 since
                                                                                                                                                      • As the omicron surge faded,
                                                   February 2021                               3.7
                                                                                                                           February 2021
                                                                                                                                                        consumers reported growing
                                                                                  3.4
                                                                           3.3           3.3         3.3 3.3                     3.2 3.1                comfort with dining out.
                           3.1                                                                                       3.2                 3.1 3.1
                                                                                                               3.1         3.0
                2.8              2.8 2.9 2.9                       2.9
        2.7 2.8                                2.7 2.7 2.8 2.8 2.7                                                                                    • The frequency of delivery or takeout
                                                                                                                                                        orders fell compared with the same
                                                                                                                                                        month a year ago. As food prices
                                                                                                                                                        increase, consumers may be less
                                                                                                                                                        inclined to pay the premium for a
                                                                                                                                                        restaurant meal without the added
                                                                                                                                                        value of being served in person.
                                  ‘21

                                  ‘2 1
                                  ‘21
                                  ‘21
       21
              ‘2 1

                                  ‘21
                                  ‘21

                                 ‘22
                                ‘22
                     ‘21

                                  ‘21

                                  ‘21

                                                                                                      ‘21

                                                                                                      ‘21
                                                                                                      ‘21

                                                                                                      ‘2 1
                                                                                                      ‘21

                                                                                                      ‘21
                                                                          21
                                                                                  ‘2 1

                                                                                                      ‘21
                                                                                                      ‘21

                                                                                                     ‘22

                                                                                                    ‘22
                                                                                         ‘21
         ‘

                                                                             ‘
                            Jun

                            Oct
                             Jul
                           Aug
     Feb
             Mar

                           Dec
                          May
                   A pr

                           Sep

                           Nov

                                                                                               Sep

                                                                                               Nov
                                                                                                Jun

                                                                                                Oct
                                                                                                 Jul
                                                                                               Aug
                                                                         Feb

                                                                                 Mar

                                                                                               Dec
                                                                                              May
                                                                                       A pr
                           Jan
                           Feb

                                                                                               Jan
                                                                                               Feb
      Source: Morning Consult Economic Intelligence                                                   Source: Morning Consult Economic Intelligence

U.S. Spending Report | March 2022                                                                                                                                                                35
Restaurants’ share of overall food spending remains lower than a year ago as rising grocery
      costs dominate monthly budgets
                                    Reported average monthly spending on food,                                  Restaurants’ share of total food spending per month,
                                                  all U.S. adults                                                                  all U.S. adults

                                             Groceries            Restaurants
                                                                                                                              19.4%
                $552 $539 $553                                                                                18.7% 18.8%             18.7%             18.8%
       $527                    $533 $533 $546 $535 $528                         $519   $530 $537 $545                                         18.5%             18.3%
                                                                                                                  18.4%                                                 17.8%
                                                                                                                                  18.3%
                                                                                                                                                  18.0%            18.1%    18.2%

                                                                                                                               Ju 1
                                                                                                                                        1
                                                                                                                  21

                                                                                                                              Ja 1
                                                                                                                               O 1
                                                                                                                              Se 1

                                                                                                                                       2
                                                                                                              1

                                                                                                                       21

                                                                                                                              Au 1

                                                                                                                                        1

                                                                                                                              De 1

                                                                                                                              Fe 2
                                                                                                                                     ‘2

                                                                                                                                     ‘2

                                                                                                                                     ‘2
                                                                                                                                     ‘2
                                                                                                                                     ‘2
                                                                                                          ‘2

                                                                                                                                      2

                                                                                                                                     ‘2

                                                                                                                                     ‘2

                                                                                                                                    ‘2
                                                                                                                                    ‘2
                                                                                                                   ‘
                                                                                                                       r‘

                                                                                                                                   l‘
                                                                                                                            ay

                                                                                                                                  n
                                                                                                                ar

                                                                                                                                  c
                                                                                                                                 p
                                                                                                                                 g
                                                                                                         b

                                                                                                                                 ct

                                                                                                                                ov
                                                                                                                                Ju

                                                                                                                                 b
                                                                                                                                 n
                                                                                                                   Ap
                                                                                                         Fe

                                                                                                              M

                                                                                                                          M

                                                                                                                              N
                                                                                                                                          Source: Morning Consult Economic Intelligence

                                                                                                         • Steeper food costs continue to drive substitution effects: The
                                                                                                           share of total food spending allocated to restaurants fell 0.5
                                                                                                           points from a year ago as inflation concerns push more
       Feb       Mar      Apr       May   Jun         Jul   Aug    Sep   Oct    Nov    Dec   Jan   Feb
                                                                                                           consumers to opt for the relatively less costly option of
       ‘21       ‘21      ‘21       ‘21   ‘21         ‘21   ‘21    ‘21   ‘21    ‘21    ‘21   ‘22   ‘22
                                                                                                           preparing meals at home.
      Source: Morning Consult Economic Intelligence

U.S. Spending Report | March 2022                                                                                                                                                         36
SECTION 4

TRANSPORTATION
TRANSPORTATION KEY TAKEAWAYS

1      Soaring prices for gas and autos drive up vehicle ownership costs.
       U.S. consumers remain committed to vehicle ownership, despite elevated driving costs. Total spending on
       gas, auto payments and insurance rose to a series high in February, up 18% from a year ago.

2      Vehicle-buying intentions are trending higher as deferred purchases pile up as backlog.
       The share of adults planning to purchase vehicles has trended higher over the past year, while actual purchases
       increased by a narrower margin. Supply constraints and rising prices are contributing to unfulfilled purchases, but
       so far demand has been deferred rather than extinguished.

3      Urban residents increased public transportation usage as omicron concerns ebbed.
       Public transit usage increased in February as the latest case surge receded — but the uptake likely did little to
       alleviate higher gas costs for most households. Urban adults accounted for most of the increase in public
       transportation spending, and this group already allocates a relatively lower share of spending to gas.

                                                                                                                             38
Auto payment amounts, insurance costs and gas spending all increased — driving up total
      vehicle-related spending 18% year over year
                      Average monthly spending on vehicle-related categories, all U.S. adults                   • Average monthly payment amounts for auto leases and
                                                                                                  Total: $417     loans, motor vehicle insurance costs and gas spending
                                        Auto payments        Car insurance      Gas                               all increased in February, pushing car ownership and
                                                                                                                  driving expenditures to a new series high.

                                                             $119                                     $137      • Much of the increase in vehicle-related spending has
                    $114             $115             $117                                     $121
                              $111           $115                   $110 $120 $122 $119                           been driven by price: Gas costs jumped 38% year over
          $101
                                                                                                                  year, while new and used vehicle prices grew 12% and
                                                                                                                  41%, respectively, and auto insurance increased 4.3%.
                    $117
                             $112
                                     $122 $117        $118 $120 $114                           $117
                                                                                                      $120
          $111                                                           $114    $113   $114                    • Despite elevated car ownership and driving costs,
                                                                                                                  consumers are showing little intention of giving up their
                                                                                                                  personal vehicles. But auto demand is not immune from
                                                                                                                  inflation impacts: About 30 percent of consumers said
          $142 $160 $145 $157 $149 $154 $163 $149 $137 $142 $142 $148 $160
                                                                                                                  they drove less in February, with a majority citing price
                                                                                                                  as the main reason. And Many adults who would like to
                                                                                                                  buy a new vehicle are deferring purchases as lingering

                                                            1
                                                            1
                   21

                                                            1
                                                            1
                               1
           1

                                                           2
                              1

                                                           1

                                                                                                        2
                                                          21
                             21

                                                                                                                  supply constraints keep inventory tight and prices high.
                                                         ‘2
                                                         ‘2

                                                         ‘2
                                                         ‘2
                            ‘2
         ‘2

                            ‘2

                                                         ‘2

                                                        ‘2

                                                                                                      ‘2
                  ‘

                                                       l‘
                           r‘

                                                      c
                                                     g
               ar

                                                     p

                                                     ct
                          n
      b

                         ay

                                                      v
                                                   Ju

                                                    n

                                                                                                   b
                        Ap

                                                  De
                                                  No
                        Ju

                                                  Au

                                                  Se
    Fe

                                                   O

                                                  Ja

                                                                                                 Fe
              M

                        M

      Source: Morning Consult Economic Intelligence

U.S. Spending Report | March 2022                                                                                                                                             39
Despite elevated prices, the share of consumers who are planning to purchase used vehicles
      reached its highest point in over a year in February
      Purchasing intent increased over the past year for new and used vehicles      Share of U.S. adults whose households purchased cars, trucks or SUVs
      by 3 and 5 points, respectively.                                                                      in the past 12 months

                                                                                            New car and truck purchases        Used car and truck purchases
      Many who planned to buy cars a year ago never made those purchases:        20%
      The shares of adults planning to buy new or used cars in February 2021
                                                                                 16%
      were 20% and 22%, respectively, but a year later, only 10% and 14% said
                                                                                 12%
      they’d completed purchases.
                                                                                  8%
                    Share of U.S. adults intending to purchase cars, trucks
                                or SUVs in the next 12 months                     4%
                                                                                  0%
                                    New vehicle       Used vehicle

                                                                                                2
                                                                                       Au 1
                                                                                       M 1

                                                                                       Ja 1
                                                                                       Se 1
                                                                                                 1

                                                                                       No 1
                                                                                                 1
                                                                                                 1
                                                                                                 1

                                                                                       Fe 2
                                                                                                 1

                                                                                       De 1
      30%

                                                                                               2
                                                                                               2

                                                                                              ‘2
                                                                                              ‘2
                                                                                              ‘2

                                                                                              ‘2
                                                                                              ‘2
                                                                                              ‘2
                                                                                              ‘2

                                                                                              ‘2

                                                                                              ‘2

                                                                                             ‘2
                                                                                             ‘2
                                                                                            l‘
                                                                                           r‘

                                                                                           c
                                                                                           g
                                                                                          ar

                                                                                           p

                                                                                          ct
                                                                                           n
                                                                                     b

                                                                                         ay

                                                                                           v
                                                                                         Ju

                                                                                          b
                                                                                          n
                                                                                        Ap

                                                                                        Ju
                                                                                   Fe

                                                                                        O
                                                                                       M
      25%                                                                                                                   Source: Morning Consult Economic Intelligence

      20%                                                                        High prices and low inventory are likely prodding many adults who want to buy
                                                                                 new vehicles to delay those purchases. Purchasing intentions are trending
       15%
                                                                                 higher, while actual purchases have trended flat as deferred purchases pile up.
                Feb Mar Apr May Jun Jul Aug Sep Oct Nov Dec Jan Feb
                ‘21 ‘21 ‘21 ‘21 ‘21 ‘21 ‘21 ‘21 ‘21 ‘21 ‘21 ‘22 ‘22
      Source: Morning Consult Economic Intelligence

U.S. Spending Report | March 2022                                                                                                                                           40
Car ownership rates remain elevated compared to a year ago, but they’ve trended lower for
      Gen Zers over the past 6 months
                                              Share of U.S. adults reporting that their household owns a car, truck or SUV, by generation

                                              All U.S. adults       Gen Z adults          Millennials         Gen Xers         Baby boomers
         95%

         90%

         85%

         80%

         75%

         70%
                                                                                                                                                    Gen Z car ownership
         65%                                                                                                                                  peaked in August 2021 and
                                                                                                                                                 has since fallen 9 points
         60%

         55%
                     Feb ‘21        Mar ‘21   Apr ‘21     May ‘21   Jun ‘21     Jul ‘21    Aug ‘21      Sep ‘21   Oct ‘21    Nov ‘21    Dec ‘21        Jan ‘22       Feb ‘22

                                                                                                                                       Source: Morning Consult Economic Intelligence

U.S. Spending Report | March 2022                                                                                                                                                      41
The share of adults who said in February that they lacked confidence in their ability to afford
      auto payments declined from the prior month, but remains elevated year over year
       Share of respondents who said they are not confident in their ability to                  Share of respondents who said they are not confident in their ability
                    make monthly auto payments, all U.S. adults                                            to make monthly auto payments, by generation

                                                                                                                           Jan '22    Feb '22
                                                                                     12.4%
                                                                                                                                                    13.3%
                                                                      10.3%              10.5%     Gen Z adults
                                                                                                                                              11.6%
      9.4%                                                     9.0%
                      8.9%
              8.5%            8.4% 8.8%                 8.6%
                                                 8.0%                         8.0%                                                                                  17.4%
                                          7.7%
                                                                                                     Millennials
                                                                                                                                                                  16.7%

                                                                                                                                                               15.9%
                                                                                                      Gen Xers
                                                                                                                                         10.3%

                                                                                                                        4.4%
                                                                                                 Baby boomers
                                                                                                                       4.4%
       Feb Mar Apr May Jun                 Jul Aug Sep Oct Nov Dec Jan Feb
       ‘21 ‘21 ‘21 ‘21 ‘21                 ‘21 ‘21 ‘21 ‘21 ‘21 ‘21 ‘22 ‘22
      Source: Morning Consult Economic Intelligence                                                                                    Source: Morning Consult Economic Intelligence

U.S. Spending Report | March 2022                                                                                                                                                      42
Soaring energy prices drove up gas spending
                                                            Monthly percent change in spending and prices, all U.S. adults

                                                        Average monthly gas expenditure             Retail gas price m/m (month end)
       15%

       10%

        5%

        0%

       -5%

      -10%
                  Feb ‘21           Mar ‘21   Apr ‘21    May ‘21    Jun ‘21    Jul ‘21    Aug ‘21     Sep ‘21     Oct ‘21    Nov ‘21      Dec ‘21        Jan ‘22        Feb ‘22

                                                                                                                                   Source: Morning Consult Economic Intelligence, AAA

U.S. Spending Report | March 2022                                                                                                                                                       43
Gas spending increased 35% from a year ago, but U.S. adults are still slow to substitute
      public transit
                           Percent change in average spending on transportation categories,             • Since January, U.S. adults have increased the
                                                    all U.S. adults                                       amount they spent on public transportation like
                                                                                                          buses, taxis or subway rides.
                                         Since January 2022   Since February 2021
                                                                                                        • As driving becomes more expensive, some
                                                                                                          consumers might switch to taking public
                                                                                                          transportation to save money on gas. Recovering
                                                                            35%                           consumer comfort levels in the wake of the omicron
                                                                                                          surge might reinforce this possibility.
                                                                                                        • However, the degree to which consumers are
                                                                                                          switching to alternatives to car travel appears limited
                                                      13%       13%                                       so far: U.S. adults increased spending on auto-
              3%            9%                                                         2%                 related categories much more strongly than they
                                             8%
                                                                                                          increased public transportation expenditures, and
                                                                                                 -7%      households continue to spend less on public transit
                                                                                                          than they did a year ago.
                    Car                     Auto loans and            Gas                  Public
                 insurance                 lease payments                              transportation

      Source: Morning Consult Economic Intelligence

U.S. Spending Report | March 2022                                                                                                                                   44
Suburban adults were more likely than other groups to abandon public transit spending,
      paring purchases by 12%
      Unsurprisingly, urban adults have consistently                     Average monthly spending on public transportation, by community type
      spent more on public transportation over the past
      12 months than those living in suburban or rural                                        Rural     Suburban      Urban
                                                            $120
      areas. Public transit options are more readily
      available and convenient in cities, whereas
                                                            $100
      suburban and rural adults tend to be more likely
      to depend on personal vehicles.
                                                            $80
      More notable is the downward trend in spending
      by suburban adults since February 2021.               $60
      Consumer comfort with using public
      transportation has lifted substantially over the
                                                            $40
      past year, while a 38% increase in gas prices
      made driving more expensive. Despite these
                                                            $20
      factors, suburban adults have shown little interest
      in diversifying spending away from personal
                                                             $0
      vehicles by using public transit.                            Feb   Mar    Apr    May    Jun     Jul   Aug    Sep     Oct       Nov      Dec       Jan      Feb
                                                                   ‘21   ‘21    ‘21    ‘21    ‘21     ‘21   ‘21    ‘21     ‘21       ‘21      ‘21       ‘22      ‘22

                                                                                                                       Source: Morning Consult Economic Intelligence, AAA

U.S. Spending Report | March 2022                                                                                                                                           45
SECTION 5

LEISURE TRAVEL
LEISURE TRAVEL KEY TAKEAWAYS

      1              Travel spending rebounded in February, though some of the gains were driven
                     by higher prices.
                     Average spending levels increased as a growing share of U.S. adults — whose comfort with travel fully
                     recovered after dipping during the omicron surge — planned trips.

      2              Younger adults — who tend to worry less about inflation — are spending larger
                     amounts on airfares and hotels.
                     Millennial consumers spent roughly twice as much on travel as baby boomers did in February.

      3              Inflation pressures are dampening travel demand for lower-income households.
                     The increase in travel demand in February was driven by adults earning at least $50,000 per year.
                     Lower-income adults are more sensitive to elevated inflation, diminishing their capacity to spend on
                     discretionary categories like travel.

U.S. Spending Report | March 2022                                                                                            47
Spending on airfare and hotels increased in February as the retreat of the omicron surge
      reinforced comfort with travel
                                                                                                                  • Consumer spending on leisure travel categories
                               Average monthly spending on travel categories, U.S. adults
                                                                                                                    increased in February as omicron concerns abated.
                                                            Airfare    Hotels
                                                                                                                  • Higher prices for airfare and hotels likely contributed
                                                                                                                    to the higher spending: Airline fares increased by
                         $83                                                                                        12.7% over the past year, and hotel rates were up
           $77                                                              $73                                     29.0%, according to the Bureau of Labor Statistics.
                                                                                                         $71
                                     $73                         $70                 $66
                                                      $66
                                                                                               $60                • Leisure travel is a discretionary purchase, and
                                                                                                                    therefore more likely to be on the chopping block
                                                                                                                    when households decide to tighten their spending.

           $65            $70                                               $65
                                                                 $61                 $61                 $65      • The increase in travel spending was driven by
                                     $58              $56                                      $55
                                                                                                                    younger adults, who are less likely to express
                                                                                                                    concern about inflation. For older generations and
                                                                                                                    lower-income households, travel spending is
                                                                                                                    becoming increasingly unattainable as gas and
         Jun ‘21        Jul ‘21     Aug ‘21      Sep ‘21       Oct ‘21    Nov ‘21   Dec ‘21   Jan ‘22   Feb ‘22     grocery prices drive up the cost of living.

      Source: Morning Consult Economic Intelligence

U.S. Spending Report | March 2022                                                                                                                                             48
Younger generations — which tend to be less concerned about inflation — drove most of
      the uptick in airfare spending
                                              Average monthly spending on airfare, by generation                           Monthly percent change between
                                                                                                                             January and February 2022,
                                                                                                                                    by generation
                                      Gen Z adults         Millennials        Gen Xers       Baby boomers

      $120

                                                                                                                               Gen Z adults        2%
      $100

       $80                                                                                                                        Millennials          30%

       $60                                                                                                                         Gen Xers        22%

        $40
                                                                                                                             Baby boomers            6%
       $20

         $0
                   Jun ‘21          Jul ‘21      Aug ‘21    Sep ‘21      Oct ‘21   Nov ‘21   Dec ‘21   Jan ‘22   Feb ‘22

      Source: Morning Consult Economic Intelligence                                                                          Source: Morning Consult Economic Intelligence

U.S. Spending Report | March 2022                                                                                                                                            49
The generational divide in hotel spending widened in February, with younger adults
      increasing purchases by a heftier margin
                                              Average monthly spending on hotels, by generation                              Monthly percent change between
                                                                                                                               January and February 2022,
                                                                                                                                      by generation
                                        Gen Zers           Millennials      Gen Xers         Baby boomers

      $140

      $120                                                                                                                            Gen Zers       16%

      $100
                                                                                                                                    Millennials         27%
       $80
                                                                                                                                     Gen Xers           7%
       $60

       $40                                                                                                                     Baby boomers          17%

       $20

         $0
                   Jun ‘21          Jul ‘21      Aug ‘21     Sep ‘21     Oct ‘21   Nov ‘21     Dec ‘21   Jan ‘22   Feb ‘22

      Source: Morning Consult Economic Intelligence                                                                            Source: Morning Consult Economic Intelligence

U.S. Spending Report | March 2022                                                                                                                                              50
More adults plan to travel in the next year than in February 2021, with most of the increase
      occurring among those earning $50,000 or more per year
                                       Share of U.S. adults planning to purchase a trip or                            • Travel in 2022 may surpass that of 2021,
                                          vacation in the next 12 months, by income                                     assuming those planning to take trips end up
                                                                                                                        following through: 47% of adults said they
                       All adults         Less than $50,000       $50,000-$99,999            $100,000 or more           intent to buy trips and vacations in the next 12
      90%                                                                                                               months in February, compared with 40% in the
                                                                                                                        same month a year ago.
      80%

       70%                                                                                                            • A stronger labor market and more stable public
                                                                                                                        health situation compared with February 2021
      60%                                                                                                               are helping to encourage travel spending.
                                                                                                                        However, heightened inflation is limiting travel
      50%
                                                                                                                        intentions for those less able to afford it: Adults
      40%                                                                                                               earning less than $50,000 reported a decline
                                                                                                                        in travel intentions in February compared with
      30%
                                                                                                                        January, as this group was disproportionately
      20%                                                                                                               impacted by rising gas prices and less able to
                  Feb       Mar     Apr      May      Jun   Jul   Aug    Sep     Oct    Nov      Dec    Jan     Feb     comfortably absorb the price increases.
                  ‘21       ‘21     ‘21      ‘21      ‘21   ‘21   ‘21    ‘21     ‘21    ‘21      ‘21    ‘22     ‘22

      Source: Morning Consult Economic Intelligence

U.S. Spending Report | March 2022                                                                                                                                             51
You can also read