Ultrasound elastography in patients with fatty liver disease - SciELO
←
→
Page content transcription
If your browser does not render page correctly, please read the page content below

Review
Silva LCM et al.         Articlein fatty liver disease
                 / Elastography                                                                             http://dx.doi.org/10.1590/0100-3984.2019.0028

             Ultrasound elastography in patients with fatty liver disease
             Análise da elastografia por ultrassonografia em pacientes com esteatose hepática

             Luiza de Campos Moreira da Silva1,a, Julia Teixeira de Oliveira1,b, Sandra Tochetto1,c, Claudia Pinto Marques
             Souza de Oliveira1,d, Rosa Sigrist1,e, Maria Cristina Chammas1,f
             1. Faculdade de Medicina da Universidade de São Paulo (FMUSP), São Paulo, SP, Brazil.
             Correspondence: Luiza de Campos Moreira da Silva. FMUSP – Instituto de Radiologia. Rua Doutor Ovídio Pires de Campos, 75, Cerqueira César.
             São Paulo, SP, Brazil, 05403-010. Email: luiza.silva@fm.usp.br.
             a. https://orcid.org/0000-0002-6051-4228; b. https://orcid.org/0000-0002-8770-3096; c. https://orcid.org/0000-0003-3588-2069;
             d. https://orcid.org/0000-0002-2848-417X; e. https://orcid.org/0000-0002-5780-4136; f. https://orcid.org/0000-0001-7041-3079.
             Received 18 February 2019. Accepted after revision 12 April 2019.

             How to cite this article:
             Silva LCM, Oliveira JT, Tochetto S, Oliveira CPMS, Sigrist R, Chammas MC. Ultrasound elastography in patients with fatty liver disease. Radiol Bras.
             2020 Jan/Fev;53(1):47–55.

Abstract Hepatic steatosis, or fatty liver disease, occurs due to the accumulation of lipids in hepatocytes. When it becomes chronic, lobular
             inflammation develops and the disease can evolve to hepatic fibrosis, liver cirrhosis, or hepatocellular carcinoma. Early diagnosis is
             desirable because patients diagnosed in the early stage of the disease respond better to treatment. In the early stages of fatty liver
             disease, the physical examination is often unremarkable. Fatty liver disease and hepatic fibrosis can be diagnosed and monitored
             through laboratory tests, imaging, and biopsy. Among the imaging methods, ultrasound stands out as an effective means of diag-
             nosing and following patients with liver disease. Ultrasound used in conjunction with elastography (ultrasound elastography) has
             recently shown great utility in the follow-up of such patients. Ultrasound elastography studies the degree of deformation (stiffness)
             of an organ or lesion, so that when there is hardening, fibrosis, or cirrhosis of the liver, those alterations are well demonstrated. In
             this review article, we discuss the application of the different types of ultrasound elastography for liver studies: transient elastogra-
             phy, point shear wave elastography, and two-dimensional shear wave elastography. Although magnetic resonance elastography may
             also be used in the analysis of liver fibrosis, it will not be addressed in this article.
             Keywords: Elasticity imaging techniques/methods; Ultrasonography/methods; Liver/diagnostic imaging; Fatty liver/diagnosis.

Resumo Esteatose hepática ocorre pelo acúmulo de lipídios nos hepatócitos, sua cronificação cursa com inflamação lobular e evolui com
             fibrose hepática, cirrose e carcinoma hepatocelular. O diagnóstico precoce do acometimento hepático é desejável em razão da
             melhor resposta terapêutica dos pacientes na fase inicial da doença. O exame físico nas fases iniciais da doença não apresenta
             alterações. O diagnóstico e o controle evolutivo da esteatose e fibrose hepática podem ser realizados por exames laboratoriais,
             exames de imagens e biópsia. Entre os exames de imagem, destaca-se a ultrassonografia (US) no diagnóstico e acompanhamento
             dos pacientes com doença hepática. Atualmente, a US associada à elastografia vem se destacando para acompanhamento desses
             pacientes. A elastografia por US estuda o grau de deformação (ou dureza) do órgão ou lesão, de modo que quando há endureci-
             mento do fígado, por fibrose ou cirrose, essa alteração é bem demonstrada na elastografia por US. Neste artigo de revisão nos pro-
             pusemos a discutir a aplicação dos diversos tipos de elastografia por US para estudo do fígado: elastografia transitória, point-shear
             wave elastography e 2D-shear wave elastography. A elastografia por ressonância magnética também pode ser utilizada na análise
             de fibrose hepática, mas não será abordada neste artigo.
             Unitermos: Técnicas de imagem por elasticidade/métodos; Ultrassonografia/métodos; Fígado/diagnóstico por imagem; Fígado
             gorduroso/diagnóstico.

INTRODUCTION                                                                      consumption, rather being related to metabolic syndrome,
      Hepatic steatosis, or fatty liver disease, occurs as a                      insulin resistance being one of the major predisposing fac-
result of the deposition and accumulation (to over 5% of                          tors(1). Increases in the incidence of obesity, type 2 diabe-
the weight of the liver) of microvesicular or macrovesicu-                        tes mellitus, and metabolic syndrome have contributed to
lar lipids (typically triglycerides) in hepatocytes. The main                     the increased incidence of NAFLD, so that its prevalence
risk factors for the condition are diseases that lead to met-                     now ranges from 15% to 24%, depending on the coun-
abolic disorders, such as obesity, type 2 diabetes mellitus,                      try(2,3). It affects an estimated 57.5–74.0% of obese indi-
and hyperlipidemia, and other comorbidities that damage                           viduals(2,4,5), 22.5% of children(6), and 52.8% of obese chil-
hepatocytes, such as hepatitis C, as well as the use of med-                      dren(7). It is also estimated that 50% of individuals with
ications and alcohol consumption (Table 1).                                       type 2 diabetes mellitus have some degree of NAFLD(2,7).
      Nonalcoholic fatty liver disease (NAFLD), unlike                            Patients with the chronic form of NAFLD develop lobular
other liver diseases, is not related to excessive alcohol                         inflammation, and the disease can evolve to hepatocyte

Radiol Bras. 2020 Jan/Fev;53(1):47–55                                                                                                                        47
0100-3984 © Colégio Brasileiro de Radiologia e Diagnóstico por Imagem
Silva LCM et al. / Elastography in fatty liver disease

Table 1—Causes of NAFLD.

  Insulin resistance              Obesity, type 2 diabetes mellitus, dyslipidemia
  Metals                          Antimony, barium, borates, phosphorus, chromates, carbon disulphide, thallium compounds, and uranium compounds
  Cytotoxic drugs                 L-asparaginase, azacytidine, azauridine, methotrexate, glucocorticoids, antiretroviral, amiodarone, tamoxifen, estrogens, war-
                                  farin, bromoethane, hydrazine, 5-fluorouracil, tetracycline, bleomycin, azaserine
  Inborn errors of metabolism     Wilson’s disease, familial steatohepatitis, galactosemia, hereditary fructose intolerance, homocystinuria, systemic carnitine
                                  deficiency, tyrosinemia, Refsum disease, Shwachman syndrome, Weber-Christian syndrome
  Other                           Hepatitis C, HIV, inflammatory bowel disease, cachexia, total parenteral nutrition, diverticulitis, autoimmune hepatitis

ballooning and fibrosis, conditions collectively known as                           Biomarkers of steatosis and liver fibrosis in NAFLD
nonalcoholic steatohepatitis (NASH). As the fibrosis ad-                                 In most cases, NAFLD is suspected or discovered by
vances, NAFLD evolves to cirrhosis and, subsequently,                               chance in routine evaluations, usually simple abdominal
to hepatocellular carcinoma(8).The accurate diagnosis of                            ultrasound or laboratory tests focused on liver enzymes.
fibrosis and hepatic inflammatory activity is extremely im-                         The first-line examination is abdominal ultrasound, be-
portant for determining the stage and prognosis of the                              cause it is inexpensive and widely available. It should be
disease, as well as for planning the treatment(9).                                  noted, however, that ultrasound has low sensitivity for the
     Although serology and the identification of biologi-                           detection of steatosis when it affects < 20% of the liver or
cal markers have little value in determining the degree                             in individuals with a body mass index (BMI) > 40 kg/m2
of fibrosis, their significance increases when they are                             (class III obesity). Magnetic resonance spectroscopy, the
combined with other tests. Histopathological analysis of                            ideal imaging examination for the detection of fatty liver
a liver biopsy specimen continues to be the gold standard                           disease, is costly, therefore being used only at specialized
for the diagnosis and staging of fibrosis. However, liver                           centers and for research purposes. Another noninvasive
biopsy has relevant limitations and complications, which                            approach to NAFLD is the use of clinical scores for ste-
has led to the development of noninvasive methods, such                             atosis, and three such scores have gained relevance be-
as imaging examinations, to estimate the degree of liver                            cause they have been externally validated, although they
fibrosis(10).                                                                       serve only to establish presence, rather than assessing se-
     This article aims to review the various diagnostic ul-                         verity(12,13): the fatty liver index, the SteatoTest, and the
trasound methods used in determining the degree of fi-                              NAFLD liver fat score. For fibrosis, a major determinant
brosis and the extent of hepatic involvement in patients                            of the prognosis of NAFLD, biomarkers are less accurate
with fatty liver disease.                                                           in detecting the intermediate stages than in detecting cir-
                                                                                    rhosis.
DIAGNOSTIC METHODS                                                                       In 65–90% of healthy subjects, the aspartate amino-
     Accurate, early diagnosis of liver disorders is desirable                      transferase/alanine aminotransferase (AST/ALT) ratio is
because it provides a better therapeutic response in pa-                            less than 1. In patients with steatosis, the AST/ALT ratio
tients in the early stage of fatty liver disease. To that end,                      begins to increase, mainly due to increased AST levels; that
there are a number of methods for analyzing the liver(11).                          trend inverts in those who develop marked fibrosis, those
     The evaluation and diagnosis of steatosis and liver                            in whom the disease progresses, and those who evolve to
fibrosis can be performed by ancillary examinations: lab-                           cirrhosis. In some cases of advanced fibrosis (< 50% of
oratory tests, imaging, and biopsy. Clinical examination                            cases), alkaline phosphatase and gamma glutamyltransfer-
does not allow early diagnosis of liver abnormalities, be-                          ase levels are two to three times higher than the reference
cause most patients in the early stage of fatty liver disease                       value. In addition to those markers, other variables, such
are asymptomatic, showing no alterations on physical ex-                            as age, glycemic index, BMI, platelet count, and albumin
amination. Imaging examinations include conventional                                level, are used for the analysis of fibrosis(14).
ultrasound, as well as ultrasound-based methods known                                    The investigation of steatosis requires tests to identify
as transient elastography (TE), point shear wave elastog-                           markers of various states(15): oxidative stress (low plasma
raphy (pSWE), and two-dimensional shear wave elas-                                  levels of vitamin E, inactivation of glutathione peroxidase,
tography (2D-SWE). Another such examination is strain                               and detection of exhaled nitric oxide or volatile organic
elastography, a form of quasi-static ultrasound-based im-                           compounds on a breath test); inflammation (elevated se-
aging. However, strain elastography is more effective in                            rum levels of cytokines such as tumor necrosis factor alpha
superficial tissues and is therefore not used for imaging                           and adiponectin); and apoptosis. In the NASH test, we
of the liver. Magnetic resonance elastography (MRE) can                             look for increases in alpha-2 macroglobulin, apolipopro-
also be used for the analysis of liver fibrosis. In this con-                       tein, total bilirubin, and gamma glutamyltransferase(16).
text, liver biopsy is still considered the gold standard for                             In addition to the biomarkers described, there are sev-
the diagnosis of fatty liver disease(10).                                           eral scales for the diagnosis of fibrosis: the hypertension,

48                                                                                                                 Radiol Bras. 2020 Jan/Fev;53(1):47–55
Silva LCM et al. / Elastography in fatty liver disease

ALT, and insulin resistance (HAIR) score; and the BMI,            confirmation. In addition to these findings, there can be
age, ALT, and triglyceride (BAAT) score. The HAIR score           periportal inflammation, glycogen-type vacuolization, me-
is used in order to determine whether or not a patient has        gamitochondria, and fewer Mallory-Denk bodies than in
NAFLD on the basis of the parameters arterial hyperten-           the alcoholic form of the disease, which is in many respects
sion, elevated ALT, and insulin resistance. The presence          identical, although it features more pronounced lobular in-
of two or more factors indicates NASH(17). The BAAT               flammation and other characteristics(19).
score classifies patients as potentially having liver fibrosis         Although biopsy is the gold-standard method for the
or liver cirrhosis if they meet at least one of the follow-       diagnosis of NAFLD, there is controversy regarding its
ing criteria(16): BMI > 28 kg/m2; age ≥ 50 years; ALT ≥ 2         validity. One issue is the representativeness of the mate-
times above normal; and triglycerides ≥ 1.7 mmol/L. The           rial, given that the typical liver fragment analyzed has a
HAIR and BAAT scores both serve to identify the predic-           volume of only approximately 1/50,000 of the total or-
tors of liver fibrosis and NASH severity. However, the in-        gan volume. Therefore, the extent of tissue damage can
struments that currently have the best external validation        be underestimated, because the process of parenchymal
are the NAFLD fibrosis score, the FIB-4 index(18), and the        fibrogenesis is dynamic and has a heterogeneous distribu-
FibroTest, the last having previously been used in order to       tion. In addition, there is some interobserver variation in
detect advanced fibrosis in patients with chronic hepatitis       the interpretation of slides and there can be disagreement
B or C. Those tests are highly accurate in distinguishing         among pathologists, especially among those with less ex-
advanced fibrosis—that categorized as stage 3 (F3) in the         perience. Several studies have shown that interobserver
METAVIR scoring system—from the milder forms.                     agreement is almost perfect among more experienced
     Another noninvasive tool for the assessment of fibro-        pathologists. Therefore, the kappa statistic for interob-
sis is TE (FibroScan; Echosens, Paris, France), which is          server agreement can range from 0.4 to 0.9(8). Because
already widely used in chronic viral hepatitis. Like other        liver biopsy is an invasive procedure, it carries a risk of
tests, TE is better at differentiating between advanced           serious complications, which occur in approximately 1%
and mild fibrosis. The controlled attenuation parameter           of cases(20). Therefore, in the context of the follow-up of
(CAP) can be measured with elastography and has been              individuals with NAFLD, it is not the most appropriate
shown to detect steatosis with good accuracy, although            examination, although it best reflects the degree of tissue
it is less reliable for determining the degree of involve-        damage.
ment(19).
     There is still no consensus on the use of markers of         Ultrasound
steatosis and liver fibrosis for the initial and continued             Ultrasound is the simplest diagnostic method, provid-
evaluation of NAFLD, especially in terms of their effec-          ing the best diagnostic results when steatosis affects more
tiveness in avoiding liver biopsy. Many authors have sug-         than 30% of the liver(21). It is noninvasive, easily accessi-
gested combining several of these diagnostic methods.             ble, and cost effective, revealing aspects suggestive of ste-
                                                                  atosis in more than 16% of healthy nonobese individuals
Liver biopsy                                                      and in approximately 95% of obese people who consume
     To confirm the diagnosis of NASH, a biopsy is still          alcohol. However, it has limited sensitivity to detect ste-
required. The decision to propose a biopsy should be dis-         atosis that affects less than 20% of the liver and to detect
cussed with and individualized for each patient. A num-           steatosis in obese patients with a BMI > 40 kg/m2. Stud-
ber of clinical findings associated with NASH, as well as         ies have shown good agreement between the ultrasound
advanced fibrosis in patients with NAFLD, can facilitate          classification and the histopathological stage, as well as
the indication of liver biopsy, namely being over 45 years        showing that, for the detection of steatosis, ultrasound
of age, being obese or having diabetes, and having an             has a sensitivity of 89% and a specificity of 93%(22). How-
AST/ALT ratio > 1. The indications for liver biopsy are           ever, it is not possible to differentiate between NASH and
as follows: altered liver enzymes or fibrosis scores in the       NAFLD steatosis by ultrasound, histopathological analy-
context of steatosis (usually seen on ultrasound); and to         sis being required in order to make that distinction(7).
determine the predominant type of liver involvement in                 In the quantitative ultrasound classification system
patients with concomitant diseases.                               devised by Saadeh et al.(22), steatosis can be categorized
     Histopathological analysis is still the ideal procedure      as follows (Figures 1 through 5): grade 1 (mild)—mild,
for staging the disease. The typical findings of NASH in-         diffuse increase in hepatic echogenicity, the hepatic ves-
clude steatosis, which is usually macrovesicular and graded       sels and diaphragm having a normal aspect; grade 2 (mod-
as one of three levels; hepatocyte ballooning; mixed lobular      erate)—moderate, diffuse increase in hepatic echogenici-
inflammatory infiltrate; and fibrosis, which is initially peri-   ty, the hepatic vessels and diaphragm having a blurred
sinusoidal, predominantly in zone 3 (centrilobular zone),         aspect; grade 3 (marked)—marked increase in hepatic
although it can also be seen in the periportal zone. How-         echogenicity, the hepatic vessels, diaphragm, and poste-
ever, fibrosis is not a necessary condition for diagnostic        rior liver not being visible(22,23).

Radiol Bras. 2020 Jan/Fev;53(1):47–55                                                                                       49
Silva LCM et al. / Elastography in fatty liver disease

Figure 1. A 2D-SWE study showing normal elasticity of the liver parenchyma (1.15 m/s), consistent with a METAVIR stage of F0. The elastography map is homoge-
neous and predominantly blue, a color range that represents less stiffness, and the propagation mode (on the right) indicates normality.

                                      (Liver)
  A                                                               B
Figure 2. A: Ultrasound examination of a liver with mild steatosis, as characterized by the slightly increased echogenicity of the liver parenchyma. The hepatic ves-
sels and diaphragm are clearly visible. B: A 2D-SWE study showing normal elasticity of the liver parenchyma (1.12 m/s), consistent with a METAVIR stage of F0. The
elastography map is homogeneous and predominantly blue, indicating less stiffness. The propagation mode (on the right) indicates normality.

Elastography                                                                         of liver fibrosis. There are several types of ultrasound elas-
     Elastography is a method that quantifies liver fibro-                           tography, the main ones used for the study of the liver
sis by measuring the propagation velocity of ultrasound                              being TE, 2D-SWE, and pSWE.
waves that pass through the liver; as fibrosis progresses,
the liver tissue stiffens and the waves propagate faster. On                         Examination technique
the basis of the wave propagation velocity, it is possible to                           For all elastography examinations, regardless of the
determine the degree of stiffness and therefore the stage                            method employed, the patient should be in the supine

50                                                                                                                 Radiol Bras. 2020 Jan/Fev;53(1):47–55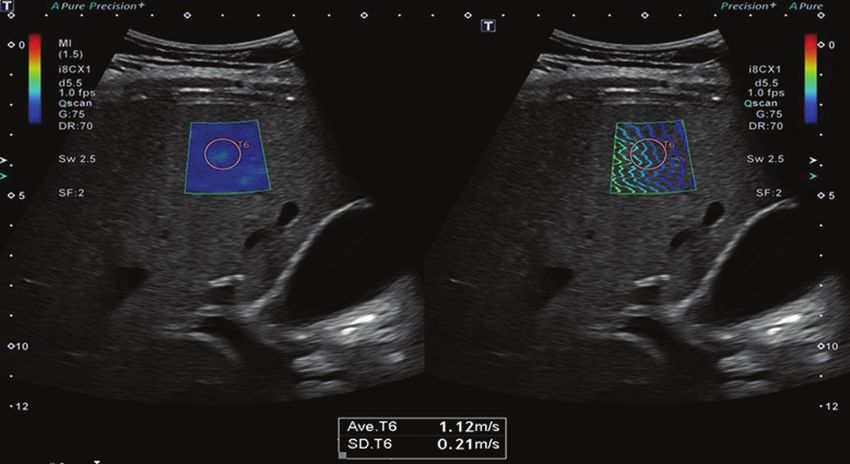
Silva LCM et al. / Elastography in fatty liver disease

                                                                                                     (Liver)

                                                         (Liver)                                               (Right kidney)
                                             A                                                B

Figure 3. A: Ultrasound examina-
tion of a liver with moderate steato-
sis, as characterized by increased
echogenicity of the liver parenchyma
and posterior attenuation of the ul-
trasound beam. The attenuation of
the ultrasound beam decreases the
definition of the hepatic vessels and
the diaphragm, although they are still
identifiable (arrow). The echogenicity
of the liver is higher than is that of the
right kidney (B). C: A 2D-SWE study
showing greater parenchymal stiff-
ness, albeit still within normal limits
(1.34 m/s), consistent with a METAVIR
stage of F0/F1. Although the elastog-
raphy map is a bit less homogeneous,
it is still predominantly blue, indicating
less stiffness, despite a larger number
of green areas.
                                             C

or left lateral position, with the right arm raised above          one that produces a numerical result other than “x.xx” or
the head to broaden the intercostal acoustic window, and           “0.00”(8). The interquartile/median ratio is the statistical
the transducer should be positioned over the intercos-             measure of dispersion, being equal to the difference be-
tal space(24). The location selected for the measurement           tween the largest and the smallest quartile, and reflects
should take into account the depth and choice of the most          the variability of valid measurements(8,25): an interquar-
appropriate acoustic window to achieve the most reliable           tile/median ratio < 0.30 indicates that the data are valid.
measurement of liver stiffness, provided by multiple mea-
surements taken at the same location. To optimize the              TE
results, the measurement is taken during a brief breath                 The FibroScan device is used in performing TE. It
hold (of a few seconds), because deep breathing and the            was the first device developed to measure liver elasticity
Valsalva maneuver both change the hepatic venous pres-             as an alternative to biopsy. It is dedicated exclusively to
sure and can thus alter the assessment of stiffness(8).            the analysis of liver fibrosis, having no other diagnostic
     Previous studies of elastography suggest that 10              applications because it is not a conventional ultrasound
measurements should be obtained and that the mean of               device. It employs an ultrasound transducer operating at
those measurements should be recorded. Measurements                5 MHz, which is built onto the shaft of a piston that acts
deemed acceptable should account for at least 60% of the           as a vibrator. At the push of a button, low frequency (50-
measurements. An acceptable measurement is defined as              Hz) transient vibrations are transmitted and the elastic

Radiol Bras. 2020 Jan/Fev;53(1):47–55                                                                                           51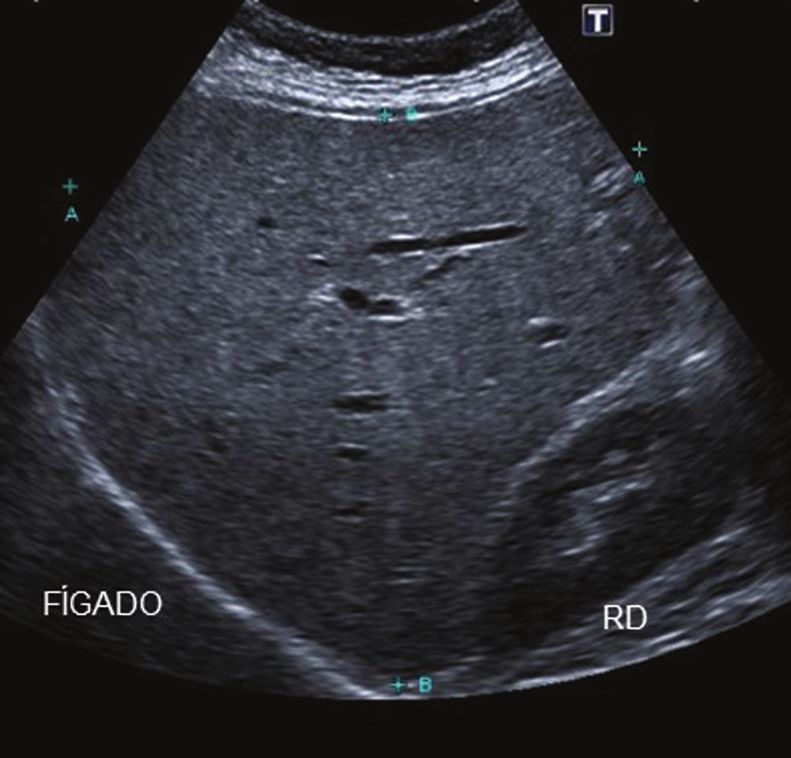
Silva LCM et al. / Elastography in fatty liver disease

  A                            (Liver)                                        B
Figure 4. A: Ultrasound examination of a liver with marked steatosis, as characterized by increased echogenicity of the liver parenchyma and posterior attenua-
tion of the ultrasound beam. Attenuation of the ultrasound beam obscures the view of the diaphragm. B: A 2D-SWE study showing greater stiffness of the liver
parenchyma (1.85 m/s), consistent with a Metavir stage of F3. The blue and green tones are in equal proportions on the elastography map and the lines are further
apart in the propagation mode.

     (Liver)

 A                                                                B
Figure 5. A: Ultrasound examination of a liver with mild steatosis and signs of chronic liver disease, as characterized by blunt edges, irregular contours, and hetero-
geneous parenchyma. B: A 2D-SWE study showing greater stiffness of the liver parenchyma (2.58 m/s), consistent with a Metavir stage of F4. On the elastography
map, tones of green predominate, and there is greater line separation in the propagation mode.

shear waves generated propagate through the underlying                               in the medium; that is, the stiffer the tissue is, the faster
tissues. It is used in order to assess tissue elasticity, which                      the vibrations will propagate. Therefore, the higher the
allows the degree of fibrosis to be estimated, in patients                           result is (in kPa), the greater is the degree of parenchymal
with chronic liver disease(25).                                                      fibrosis in the liver(25).
     Ultrasound acquisitions are used in order to moni-                                   The CAP is an operator-independent tool associated
tor the propagation of the shear wave and to measure its                             with the TE device and is used in order to quantify hepatic
velocity. In a TE examination, liver stiffness is measured                           steatosis. The measurements obtained by CAP (in dB/m)
in a cylindrical volume of approximately 10 × 40 mm at                               follow the same acquisition pattern as those obtained
a depth of 25–65 mm below the skin surface, which is at                              by FibroScan. A study of overweight and obese patients
least 100 times larger than a biopsy specimen and there-                             with chronic liver disease reported that CAP determina-
fore much more representative of the liver parenchyma(9).                            tion showed sensitivity and specificity of 76% and 79%,
Measurements should be performed in an area of paren-                                respectively, for the detection of steatosis involving less
chyma without vessels or bone; those acquired inappro-                               than 10% of hepatocytes (214–289 dB/m), 85% and 79%,
priately or with excess transducer pressure on the skin are                          respectively, for the detection of that involving 11–33%
automatically discarded.                                                             of hepatocytes (233–311 dB/m), and 83% and 79%, re-
     The intensity of the ultrasound wave is directly related                        spectively, for the detection of that involving 67–100% of
to the elasticity, decreasing exponentially as it propagates                         hepatocytes (266–318 dB/m). Although there have been

52                                                                                                                  Radiol Bras. 2020 Jan/Fev;53(1):47–55
Silva LCM et al. / Elastography in fatty liver disease

few studies evaluating the CAP method, it has proven             Table 2—Morphological criteria for staging fibrosis with the METAVIR histologi-
to be a good way to evaluate and monitor patients with           cal scoring system(28).

NAFLD, because it is easily performed and able to ana-             Histopathological finding                                     Stage
lyze a portion of the liver 100 times larger than the typi-
                                                                   No fibrosis                                                     F0
cal liver biopsy specimen, with the additional advantages
                                                                   Portal fibrous expansion without septa                          F1
of being operator independent and providing immediate              Fibrous expansion with a few septa                              F2
results(23). Studies show that FibroScan has good repro-           Fibrous expansion with many septa, without cirrhosis            F3
ducibility, although the level of agreement decreases in           Cirrhosis                                                       F4
patients with less fibrosis, less steatosis, or a high BMI(7).

pSWE                                                             centers. However, for some ultrasound systems, it is pos-
     The pSWE technique consists in measuring the veloc-         sible to update the software or hardware to implement the
ity of shear wave propagation in the liver parenchyma as         elastography tool without replacing the equipment, which
a way of assessing the degree of stiffness of the liver(26).     could reduce the budgetary impact of the eventual incor-
An acoustic radiation force impulse (ARFI) is applied in         poration of this technique at smaller facilities.
a region of interest chosen by the operator. Unlike TE,
pSWE does not require vibratory stimulation, making the          2D-SWE
measurement more accurate, with less interobserver varia-             In the 2D-SWE technique, multiple ARFI measure-
tion and greater reproducibility(25,27). The area analyzed       ments are made over a large field of view, which can be
is a 10 × 5 mm rectangle that can be freely moved in the         achieved with a single real-time image. The mean, maxi-
two-dimensional (B-mode) image to a maximum depth of             mum, minimum, and standard deviation of the shear wave
80 mm below the skin surface(25), which allows a more ap-        velocity are analyzed in one region of interest. Because
propriate measurement in obese patients and in patients          2D-SWE is performed in real time, it evaluates various
with ascites. Measurements are preferably performed in           regions of the liver and allows the production of elastog-
segments 5 and 8 of the right lobe of the liver, in the in-      raphy measurements to be visualized on a color display as
tercostal spaces. Examination of the left lobe by pSWE is        they accumulate(20,25). The ARFI focus is dragged below
useful in obese patients, in whom there can be technical         the acoustic axis faster than the shear wave velocity, in
difficulties in obtaining measurements in the right lobe.        order to generate almost simultaneous tissue shifts (in the
     The pSWE technique provides a numerical indica-             tens of micrometers) at all positions along the acoustic
tion of the degree of liver stiffness by emitting acoustic       axis, producing a shear wave in the form of a shallow-
pulses that produce shear waves, whose velocity is pro-          angle cone that shifts from the pressure line, propagating
portional to the degree of stiffness of the examined or-         less and thus decaying less rapidly with distance than it
gan (higher velocity equals greater stiffness). As steatosis     would from a single pushing focus.
progresses to fibrosis, the stiffness of the organ increases,         An ultrafast scanner achieves an ultrasound rate of
resulting in higher shear wave propagation velocity. In ad-      up to 20 kHz, transmitting a flat wave and focusing only
dition, because pSWE is a technique coupled with con-            on receiving, so that each ultrasound echo image is cre-
ventional ultrasound equipment, it is possible to evaluate       ated with a single push pulse. The differences between
the morphology of the liver (in B mode), to perform a            the arrival times at different positions are then analyzed
Doppler study of the liver, and to avoid areas such as ves-      to create a portion of the final shear wave velocity image.
sels and other structures that could compromise the pro-         The process is repeated over a number of different push
cedure and distinguish between stiffened and preserved           lines to create a final quantitative image of elasticity in
areas when using a gray scale or color scale, thus allowing      a box, which is presented as a color overlay on the B-
a more comprehensive evaluation of the liver in compari-         mode image (in m/s) or converted to Young’s modulus (in
son with the TE technique(26).                                   kPa, as for TE). Therefore, the software uses three related
     For staging fibrosis, the histological scoring system       frame rates(27): the standard B-mode echo image; an echo
of choice is the METAVIR system (Table 2), in which              image used in order to track displacement; and the shear
the results obtained by pSWE are compared with those             wave elastogram.
obtained by liver biopsy. Studies have shown that pSWE                In patients with chronic liver disease, the 2D-SWE
has good sensitivity and specificity in comparison with          technique has shown greater accuracy in detecting the
biopsy(24). A meta-analysis of a collective sample of 518        early and intermediate stages of fibrosis than has the TE
patients showed a correlation between pSWE and liver             technique. Although 2D-SWE is only minimally opera-
biopsy, the former showing an accuracy of 87% for F2             tor dependent, care must be taken to minimize trans-
fibrosis, 91% for F3 fibrosis, and 93% for F4 fibrosis(20).      ducer pressure to avoid the overestimation of stiffness
     The high cost of the equipment used in pSWE re-             during surface tissue imaging. Factors that affect data
stricts the application of the technique beyond referral         quality, producing speed errors or signal loss, include the

Radiol Bras. 2020 Jan/Fev;53(1):47–55                                                                                                       53
Silva LCM et al. / Elastography in fatty liver disease
following(24): the strength and speed of the shear wave; NAFLD at high risk of steatohepatitis or advanced fibro-
variations in the attenuation, absorption and reflection sis, suggested by serological markers or elastography find-
of the pushing beam; ultrasound scatterer spacing; tis- ings; elevated liver enzymes (AST or ALT) for more than
sue continuity; and scattering, reflection, or refraction three months; and metabolic syndrome that is not con-
of the shear waves. trolled after six months of nonpharmacological treatment
It is noteworthy that the various ultrasound elastog- and lifestyle modification.
raphy systems marketed by different manufacturers have The complexity of the diagnosis of liver fibrosis and
different cutoff values (in m/s or kPa) for each liver fibro- NAFLD is viewed with enthusiasm by the research com-
sis stage. Table 3 shows how the different techniques re- munity, because it creates opportunities for lines of re-
late to the METAVIR classification(29). Figures 1 through search in this area. As a result, ultrasound elastography is
5 provide examples of the results obtained with 2D-SWE. moving toward considerable improvements in the current
techniques. Major improvements are expected in terms
Table 3—Cut-off values for different stages of liver fibrosis determined by vari- of image quality, ease of use, quantification, and range of
ous ultrasound elastography techniques and equipment marketed by various
manufacturers(29). measurable tissue characteristics. It may one day com-
pletely replace liver biopsy in the diagnosis of steatosis,
Ultrasound elastography techniques ≥ F2 ≥ F3 F4
saving many individuals from undergoing this invasive
pSWE (VTQ/ARFI) – Siemens 1.34 m/s 1.55 m/s 1.80 m/s procedure(20,27).
pSWE (ElastPQ) – Philips* 1.37 m/s 2.00 m/s 2.64 m/s
2D-SWE – General Electric* 1.66 m/s 1.77 m/s 1.99 m/s REFERENCES
2D-SWE (SSI) – Aixplorer 1.50 m/s 1.70 m/s 1.90 m/s 1. Angulo P. Nonalcoholic fatty liver disease. N Engl J Med. 2002;346:
2D-SWE (ASQ) – Toshiba* 1.76 m/s 2.21 m/s 2.86 m/s 1221–31.
TE-FibroScan – Echosens 1.67 m/s 1.70 m/s 2.10 m/s 2. Nomura H, Kashiwagi S, Hayashi J, et al. Prevalence of fatty liver in
a general population of Okinawa, Japan. Jpn J Med. 1988;27:142–9.
* Cut-off values provided by the manufacturer. 3. Hilden M, Christoffersen P, Juhl E, et al. Liver histology in a ‘nor-
mal’ population—examinations of 503 consecutive fatal traffic ca-
sualties. Scand J Gastroenterol. 1977;12:593–7.
WHAT IS CONSOLIDATED IN THE LITERATURE 4. Bellentani S, Saccoccio G, Masutti F, et al. Prevalence of and risk
factors for hepatic steatosis in Northern Italy. Ann Intern Med.
The literature indicates that ultrasound elastogra- 2000;132:112–7.
phy can be used in order to distinguish between patients 5. Luyckx FH, Desaive C, Thiry A, et al. Liver abnormalities in severely
without fibrosis and those with mild fibrosis, as well as obese subjects: effect of drastic weight loss after gastroplasty. Int J
between those with mild fibrosis and those with severe Obes Relat Metab Disord. 1998;22:222–6.
fibrosis or cirrhosis, without the need for an invasive pro- 6. Tominaga K, Kurata JH, Chen YK, et al. Prevalence of fatty liver in
Japanese children and relationship to obesity. An epidemiological
cedure unless there is a concomitant disease factor, such ultrasonographic survey. Dig Dis Sci. 1995;40:2002–9.
as a risk of acute hepatitis, that would not be definitively 7. Franzese A, Vajro P, Argenziano A, et al. Liver involvement in
diagnosed with a noninvasive method(8). In addition, the obese children. Ultrasonography and liver enzyme levels at diag-
efficacy of ultrasound elastography depends on physician nosis and during follow-up in an Italian population. Dig Dis Sci.
1997;42:1428–32.
knowledge and the technique employed in the examina-
8. Barr RG, Ferraioli G, Palmeri ML, et al. Elastography assessment
tion, which is made more difficult by the complexity of of liver fibrosis: Society of Radiologists in Ultrasound Consensus
liver disease and the variety of techniques available. Conference Statement. Ultrasound Q. 2016;32:94–107.
The Brazilian Hepatology Society issued a consensus 9. Vergniol J, Foucher J, Terrebonne E, et al. Noninvasive tests for
that guides practice in the diagnosis of NAFLD in Bra- fibrosis and liver stiffness predict 5-year outcomes of patients with
chronic hepatitis C. Gastroenterology. 2011;140:1970–9.
zil(30). The consensus emphasizes the importance of in-
10. Rockey DC, Caldwell SH, Goodman ZD, et al. Liver biopsy. Hepa-
vestigating metabolic factors and diseases that can lead tology. 2009;49:1017–44.
to steatosis, recommending a thorough clinical evaluation 11. Chen J, Talwalkar JA, Yin M, et al. Early detection of nonalcoholic
and the ordering of laboratory tests (of liver function and steatohepatitis in patients with nonalcoholic fatty liver disease by
enzymes, as well as serology). According to the consen- using MR elastography. Radiology. 2011;259:749–56.
sus, diagnostic imaging methods such as ultrasound, com- 12. Bedogni G, Bellentani S, Miglioli L, et al. The fatty liver index: a
simple and accurate predictor of hepatic steatosis in the general
puted tomography, and magnetic resonance imaging are
population. BMC Gastroenterol. 2006;6:33.
classified as ancillary to biopsy, because they are impor- 13. Kahl S, Straßburger K, Nowotny B, et al. Comparison of liver fat
tant for excluding differential diagnoses but are not able to indices for the diagnosis of hepatic steatosis and insulin resistance.
distinguish between steatosis and steatohepatitis. Fortu- PLoS One. 2014;9:e94059.
nately, TE and other ultrasound elastography methods are 14. Angulo P, Hui JM, Marchesini G, et al. The NAFLD fibrosis score:
a noninvasive system that identifies liver fibrosis in patients with
described as contributing to the diagnosis of liver fibrosis
NAFLD. Hepatology. 2007;45:846–54.
in NAFLD patients. Biopsy is strongly indicated only in 15. Wieckowska A, McCullough AJ, Feldstein AE. Noninvasive diag-
the following cases: suspected steatohepatitis with vari- nosis and monitoring of nonalcoholic steatohepatitis: present and
ous differential diagnoses (other chronic liver diseases); future. Hepatology. 2007;46:582–9.
54 Radiol Bras. 2020 Jan/Fev;53(1):47–55Silva LCM et al. / Elastography in fatty liver disease
16. Poynard T, Ratziu V, Charlotte F, et al. Diagnostic value of bio- 24. European Association for Study of Liver; Asociación Latinoameri-
chemical markers (Nash test) for the prediction of non alcoholo cana para el Estudio del Hígado. EASL-ALEH clinical practice
steato hepatitis in patients with non-alcoholic fatty liver disease. guidelines: non-invasive tests for evaluation of liver disease severity
BMC Gastroenterol. 2006;6:34. and prognosis. J Hepatol. 2015;63:237–64.
17. Dixon JB, Bhathal PS, Hughes NR, et al. Nonalcoholic fatty liver 25. Piscaglia F, Marinelli S, Bota S, et al. The role of ultrasound elas-
disease: improvement in liver histological analysis with weight loss. tographic techniques in chronic liver disease: current status and
Hepatology. 2004;39:1647–54. future perspectives. Eur J Radiol. 2014;83:450–5.
18. Shah AG, Lydecker A, Murray K, et al. Use of the FIB4 index for 26. Yoneda M, Suzuki K, Kato S, et al. Nonalcoholic fatty liver disease:
non-invasive evaluation of fibrosis in nonalcoholic fatty liver dis- US-based acoustic radiation force impulse elastography. Radiology.
ease. Clin Gastroenterol Hepatol. 2009;7:1104–12. 2010;256:640–7.
19. Bedossa P, Patel K. Biopsy and noninvasive methods to assess 27. Bamber J, Cosgrove D, Dietrich CF, et al. EFSUMB guidelines
progression of nonalcoholic fatty liver disease. Gastroenterology. and recommendations on the clinical use of ultrasound elastog-
2016;150:1811–22. raphy. Part 1: basic principles and technology. Ultraschall Med.
20. Cosgrove D, Piscaglia F, Bamber J, et al. EFSUMB guidelines and 2013;4:169–84.
recommendations on the clinical use of ultrasound elastography. 28. Bedossa P, Poynard T. An algorithm for the grading of activity in
Part 2: clinical applications. Ultraschall Med. 2013;34:238–53. chronic hepatitis C. The METAVIR Cooperative Study Group.
21. Parise ER. Métodos de imagem e testes não invasivos no diagnóstico Hepatology. 1996;24:289–93 .
da DHGNA. In: Sociedade Brasileira de Hepatologia. Doença hepá- 29. Sigrist RMS, Liau J, Kaffas AE, et al. Ultrasound elastography: review
tica gordurosa não alcoólica. p. 10. [cited 2019 Oct 23]. Available of techniques and clinical applications. Theranostics. 2017;7:1303–
from: sbhepatologia.org.br/pdf/revista_monotematico_hepato.pdf. 29.
22. Saadeh S, Younossi ZM, Remer EM, et al. The utility of radiological 30. Sociedade Brasileira de Hepatologia. Doença hepática gordurosa
imaging in nonalcoholic fatty liver disease. Gastroenterology. 2002; não alcoólica. Consenso da Sociedade Brasileira de Hepatologia.
123:745–50. 2015. [cited 2017 Jun 16]. Available from: http://www.sbhepatologia.
23. Lupsor-Platon M, Stefanescu H, Muresan D, et al. Noninvasive as- org.br/pdf/Consenso_DHGNA_da_SBH-2015.pdf.
sessment of liver steatosis using ultrasound methods. Med Ultra-
son. 2014;16:236–45.
Radiol Bras. 2020 Jan/Fev;53(1):47–55 55You can also read