UNITED UTILITIES SUSTAINABLE CATCHMENT MANAGEMENT PROGRAMME WATER QUALITY MONITORING RESULTS - JULY 2012
←
→
Page content transcription
If your browser does not render page correctly, please read the page content below
UNITED UTILITIES
SUSTAINABLE CATCHMENT MANAGEMENT PROGRAMME

      WATER QUALITY MONITORING RESULTS
                  JULY 2012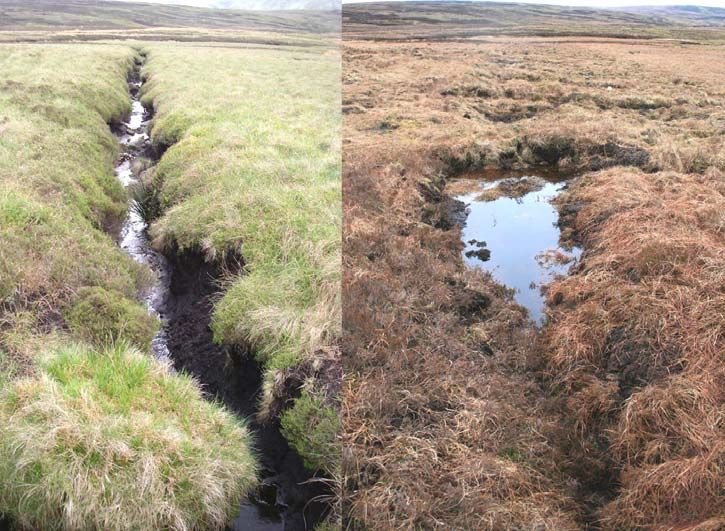
UNITED UTILITIES
0B

SCAMP WATER QUALITY MONITORING
1B

JULY 2012
2B

Penny Anderson Associates Limited
‘Park Lea’
60 Park Road
Buxton
Derbyshire
SK17 6SN

Project Manager
Penny Anderson

August 2012

     This project has been undertaken in accordance with PAA policies and procedures on quality assurance.

     Signed

              _______________________________________________________________________________________________________________________
120274                                                                                                                     United Utilities
August 2012                                                                                    SCaMP Water Quality Monitoring - July 2012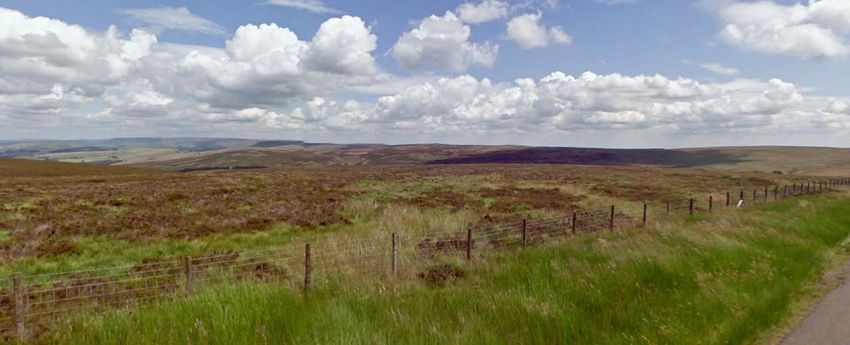
CONTENTS
3B

     1.   INTRODUCTION.................................................................................................... 1
     2.   GOYT STUDY CATCHMENT ................................................................................ 2
              Goyt - Raw Streamflow Water Colour............................................................................................. 3
              Goyt – Streamflow Turbidity (Suspended Sediment) ..................................................................... 4
     3.   ASHWAY GAP STUDY CATCHMENT .................................................................. 5
              Ashway Gap - Streamflow Water Colour ........................................................................................ 6
              Ashway Gap – Streamflow Turbidity............................................................................................... 7
     4.   BRENNAND STUDY CATCHMENT ...................................................................... 9
     5.   RAW STREAMFLOW COLOUR.......................................................................... 12
              Streamflow Turbidity ..................................................................................................................... 12
              Using ARIMA Models for Forecasting Colour and Turbidity ......................................................... 13
     6.   PEAT WATER TABLE RECOVERY.................................................................... 14
              Ashway Gap.................................................................................................................................. 14
              Goyt............................................................................................................................................... 15
              Whitendale .................................................................................................................................... 16
              Brennand....................................................................................................................................... 16
     7. CAN SCAMP CHANGES BE DETECTED DOWNSTREAM? - EVIDENCE FROM
        ERRWOOD RESERVOIR, GOYT......................................................................... 19
     8.   WATER QUALITY MONITORING – CONCLUSIONS ......................................... 22
     9.   REFERENCES..................................................................................................... 23

PHOTOS
     1    View Across the Goyt Valley Study Catchment……………………………………………………………3

     2    View Across the Ashway Gap Study Catchment Showing Changes in Vegetation Following SCaMP
          Management………………………………………………………………………………………………….. 6

     3    Brennand Brown Syke Sub-Catchment Before and After Major Grip Block Work was Completed.. 10

     4    A Blocked Grip in the Whitendale Catchment where Vegetation Succession is Beginning to Fill in
          the Channel…………………………………………………………………………………………………..11

     5    Peat Water Table Recovery Leading to Vegetation Re-colonisation with Sphagnum Following Grip
          Blocking……………………………………………………………………………………………………… 17

              _______________________________________________________________________________________________________________________
120274                                                                i                                                                             United Utilities
August 2012                                                                                                         SCaMP Water Quality Monitoring - July 2012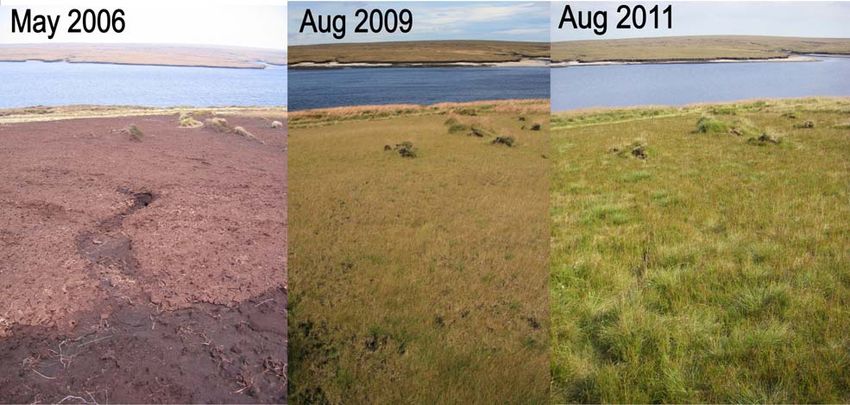
FIGURES
    1    Location of Monitoring Sites Across the Goyt Estate…………………………………………………….. 2

    2    River Goyt – Raw Streamflow Colour 2006-2012………………………………………………………… 3

    3    Location of Monitoring Sites Across Ashway Gap………………………………………………………...5

    4    Chew Clough- Raw Streamflow Colour 2007-2012……………………………………………………….7

    5    Ashway Gap Small Clough – Raw Streamflow Turbidity 2008-2011……………………………………8

    6    Location of Monitoring Sites Across the Brennand Catchment…………………………………………. 9

    7    Brown Syke Stream – Raw Streamflow Colour 2009-2012……………………………………………. 12

    8    Bield Field Stream – Raw Streamflow Turbidity 2007-2012…………………………………………….13

    9a Mean Daily Peat Water Table Depth – Ashway Gap, Blindstones Moss Dipwell…………………….14

    9b Mean Daily Peat Water Table Depth – Goyt 2 Dipwell…………………………………………………. 15

    9c Mean Daily Peat Water Table Depth – Goyt 3 Dipwell…………………………………………………. 15

    10a Raw Water Colour Time Series Plot – Errwood Reservoir, Goyt, 1990-2012………………………...18

    10b Raw Water Colour Time Series Plot – Errwood Reservoir, Goyt, 2000-2012………………………...19

    10c Raw Water Colour Time Series Plot – Errwood Reservoir, Goyt, 2007-2012………………………...19

              _______________________________________________________________________________________________________________________
120274                                                     ii                                                              United Utilities
August 2012                                                                                    SCaMP Water Quality Monitoring - July 2012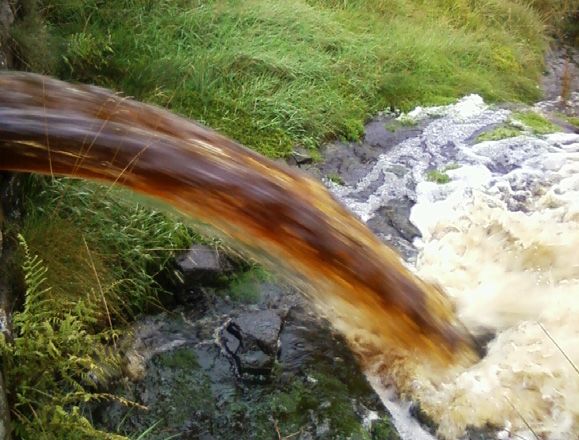
1. INTRODUCTION
4B
1.1 The hydrological monitoring that had been established as part of SCaMP 1 (2006-2010 inclusive)
has been continued throughout 2011 and into 2012. It is due to continue under this phase of
SCaMP until the end of 2014. No botanical monitoring was undertaken in 2011, but is due to take
place on the key blanket bog sites where hydrological monitoring is conducted later in 2012.
1.2 The hydrological monitoring has comprised:
water quality monitoring (colour and turbidity) after grip blocking in the Goyt Valley, Peak
District and Brennand, Bowland, along with stage discharge measurements;
water quality monitoring (colour and turbidity) after re-vegetation work on Ashway Gap,
Longdendale, Peak District, along with stage discharge measurements; and,
water table levels in the peat at all three sites (i.e. Ashway Gap, the Goyt and Brennand
study catchments).
1.3 The results of these studies are reported in the following sections, adding to the data already
presented for the period 2006 (2007 for Brennand) to 2010.
______________________________________________________________________________________________________________________
120274 1 United Utilities Water
August 2012 SCaMP Water Quality Monitoring – July 2012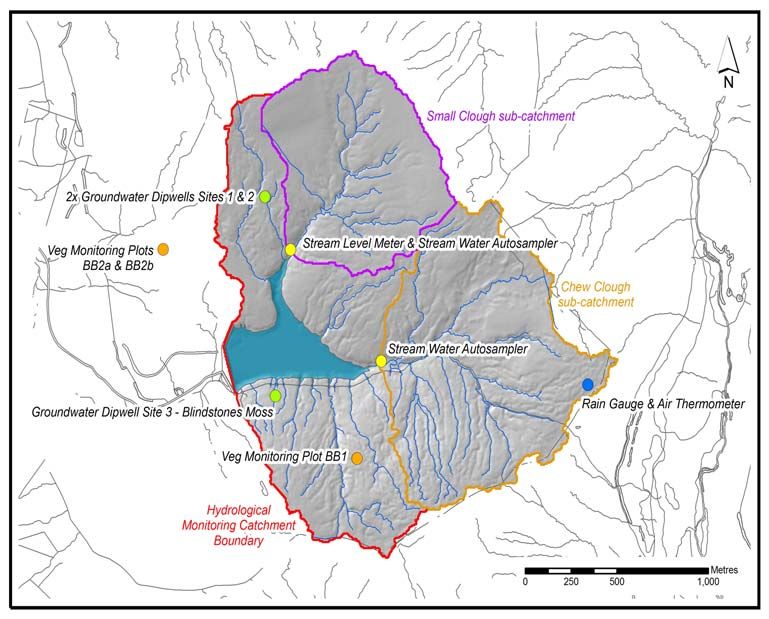
2. GOYT STUDY CATCHMENT
5B
2.1 The River Goyt is a major tributary and significant headwater of the River Mersey. Rising to
525m, the sub-catchment studied within SCaMP consists of around 600ha of predominately
blanket bog over deep peats (averaging 1.5m) and around 250ha of dwarf shrub heath. The
vegetation is a mix of cotton grasses and dwarf shrubs typical of drier blanket bog habitat, with
little Sphagnum cover except in the wettest areas. Figure 1 illustrates the Upper Goyt study
catchment together with SCaMP monitoring plots and the location of monitoring equipment
installations. Photo 1 illustrates a typical view of the Goyt study catchment.
2.2 Grip blocking has been carried out on the Goyt on two areas of catchment. At the same time,
sheep stocking levels were reduced and burning for grouse moor management ceased, at least
for a period. The objectives for these activities were:
to raise the water table in the peat, thus establishing wetter and, therefore, better condition
blanket bog, thus also increasing the possibility of maintenance and enhancement of
carbon sequestration;
to encourage, through this re-wetting, a more diverse blanket bog vegetation with more
characteristic plant species, including a greater cover and diversity of Sphagna sp.; and,
to reduce the production and loss of dissolved organic carbon (DOC), thus contributing to
improved water quality for United Utilities’ (UU) treatment works, but also reducing carbon
loss from the peat store on the moorlands.
Figure 1 Location of Monitoring Sites Across the Goyt Estate
25B
______________________________________________________________________________________________________________________
120274 2 United Utilities Water
August 2012 SCaMP Water Quality Monitoring – July 2012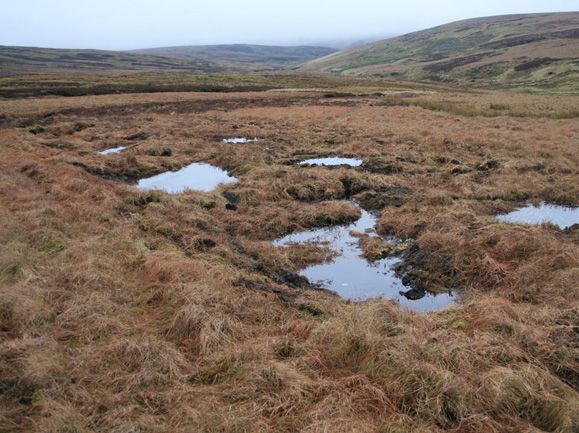
Photo 1 View Across the Goyt Valley Study Catchment

              Goyt - Raw Streamflow Water Colour
              13B

2.3                 The time series record for raw streamflow water colour (a surrogate for dissolved organic carbon,
                    or DOC) in the Goyt is illustrated in Figure 2.

2.4                 The colour trend observed on the River Goyt continues to improve at a slight, but statistically
                    significant rate, once seasonality has been factored out of the series.

                                            Figure 2 River Goyt - Raw Streamflow Colour 2006-2012
                                            24B

                    ______________________________________________________________________________________________________________________
120274                                                           3                                                       United Utilities Water
August 2012                                                                                        SCaMP Water Quality Monitoring – July 2012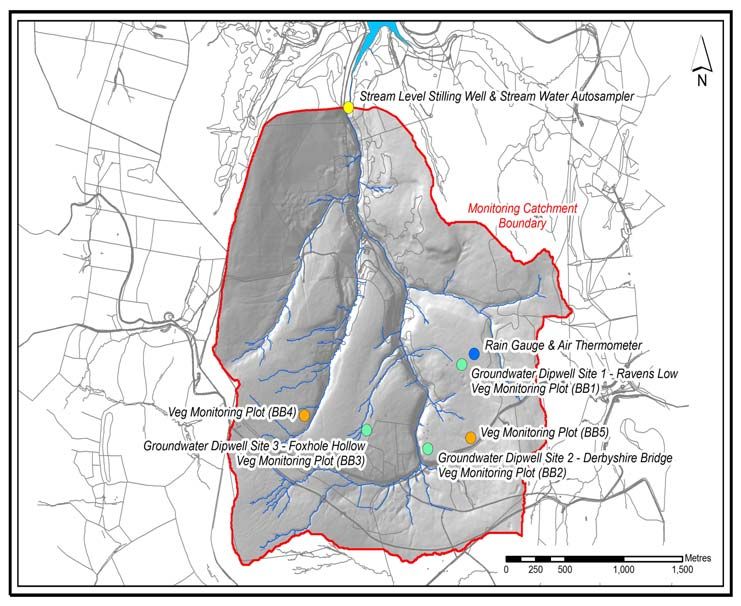
2.5                 A slight improvement in raw water colour at a mean rate of 0.7% per annum (entire data series
                    taken together, from 2006 to 2011) has been observed and reported previously.

2.6                 At present, the median raw water colour in the Goyt streamflow is 68 degrees hazen (mean is
                    99.54 hazen). Thus, a 0.7% annual reduction in colour equates to a 0.476 hazen drop in median
                    raw water colour per annum. If this trend is projected forward, the annual reduction in median
                    raw water colour ten years from now would be 4.76 hazen, assuming that the trend in water
                    colour continues to decline at the same rate over this period.

2.7                 Using the arithmetic mean value, the annual year on year rate of colour production will decrease
                    at 0.69 hazen per annum. Thus, we may expect mean raw water colour to decline by 6.9 hazen
                    by 2022, based on the same assumptions as set out above.

2.8                 A comparative statistical test between raw streamflow water colour in the Goyt pre and post
                    SCaMP works is not possible with the Goyt data as the vast majority of grip blocking work had
                    been completed across the catchment by the time SCaMP monitoring had started. Nevertheless,
                    trend tests continue to show declining colour levels at the catchment outlet.

2.9                 The key Goyt results demonstrate that real, although slight improvements in water quality have
                    been achieved as a result of grip blocking, stock exclusion and cessation of burning across only
                    a relatively small catchment.

              Goyt – Streamflow Turbidity (Suspended Sediment)
              14B

2.10          As in previous years, Goyt turbidity levels remain low and constant, a function of the intact nature
              of the blanket bog in the upper catchment. No trends have been detected and levels remain very
              low.

                    ______________________________________________________________________________________________________________________
120274                                                           4                                                       United Utilities Water
August 2012                                                                                        SCaMP Water Quality Monitoring – July 2012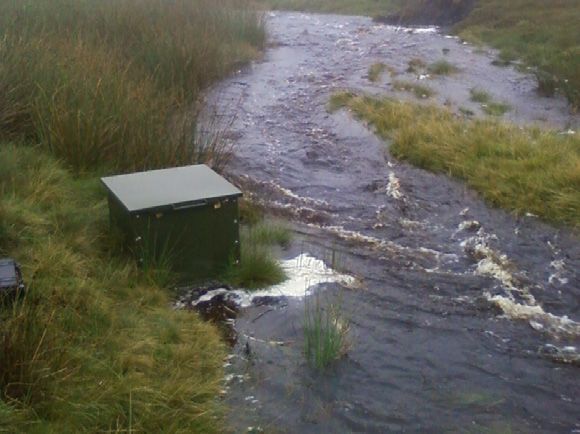
3.            ASHWAY GAP STUDY CATCHMENT
              6B

3.1                The Ashway Gap study catchment (as shown in Figure 3) forms one of the three restoration sites
                   selected for restoration. Much of the blanket bog (some 12.5%) has been heavily gullied,
                   severely eroded and incorporates much bare peat. The extensive bare ground is thought to be
                   related to repeated wildfires, but the loss of Sphagnum about 230 years ago across the Peak
                   District is linked to air pollution and a coincident increase in the rate of erosion, both of which
                   would have contributed to increased bare peat exposure.

3.2                On-going heavy grazing and air pollution have prevented effective regeneration of the vegetation
                   in the recent past.

                                          Figure 3 Location of Monitoring Sites Across Ashway Gap
                                          26B

3.3                SCaMP has provided the opportunity to restore areas of damaged blanket bog with the dual
                   objectives of improving the water quality in the nearby reservoirs and restoring the habitat as part
                   of the SSSI condition targets.

3.4                The vegetation of the area is poor in species and dominated by hare’s-tail and common cotton
                   grasses (Eriophorum vaginatum and E. angustifolium) with crowberry (Empetrum nigrum) and
                   bilberry (Vaccinium myrtillus) on the drier peat. Heather (Calluna vulgaris) is only locally
                   abundant. Sphagnum and other mosses are scarce but currently increasing as a response to
                   reductions in sulphur dioxide.

3.5                The restoration works were implemented within a stock-proof fence (covering 1,675.9ha of
                   blanket bog), in the winters of 2007/8 and 2008/9 and focused on the worst affected areas within
                   the western half of the fenced site. The scale of the measures is significant, reflecting the
                   ______________________________________________________________________________________________________________________
120274                                                          5                                                       United Utilities Water
August 2012                                                                                       SCaMP Water Quality Monitoring – July 2012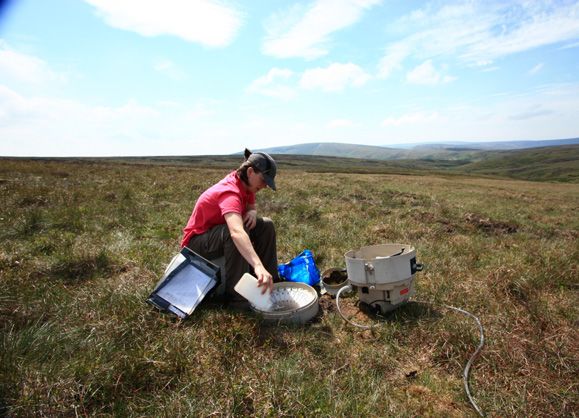
integrated approach that SCaMP has taken, with lime, seed and fertiliser added to some 93ha
and heather brash with lime, seed and fertiliser applied to a further c.377ha. Rolls of a geotextile;
geojute totalling 12.97ha have been pegged out onto the steeper peat slopes. Figure 3 illustrates
the Ashway Gap study catchment together with SCaMP monitoring plots and the location of
equipment installations.
3.6 The specifications, which were based on experimental work undertaken within the Moorland
Management Project (Anderson, Tallis and Yalden, 1997), were:
the addition of lime and fertiliser with a grass seed nurse crop mix;
the addition of cut heather with pods and seeds still attached (brash) to the lime/seed and
fertiliser-treated areas;
securing geojute geotextile to steep, bare gully sides with the addition of lime/seed and
fertiliser with or without the brash also added;
some experimental placing of coir rolls in peat pans to stabilise the peat and reduce peat
loss and rill development; and some gully blocking with stone (deeper gullies) or heather
bales (shallower areas) in selected sites.
Photo 2 View Across the Ashway Gap Study Catchment Showing Changes in Vegetation
Following SCaMP Management
Ashway Gap - Streamflow Water Colour
15B
3.7 In order to attempt to isolate out the direct effects of SCaMP management works (re-vegetating
much of the extensive areas of bare and eroding peat), a set of trend tests have been completed
on the post SCaMP treatment datasets for raw water quality on Ashway Gap.
3.8 Post treatment water quality records have been assessed for streamflow colour on both Chew
Clough and Small Clough catchments (see Figure 3 for locations and context).Overall, the raw
water colour trends in both Chew and Small Clough have always indicated a slight, statistically
significant increase and this pattern has been consistent throughout SCaMP monitoring, until the
end of 2010.
______________________________________________________________________________________________________________________
120274 6 United Utilities Water
August 2012 SCaMP Water Quality Monitoring – July 20123.9 However, the latest statistical results based on the post treatment data series point to a slight
reduction in raw water colour production as time series trend tests conducted show raw water
colour decreasing on both Chew and Small Clough simultaneously, suggesting that SCaMP
works may be having a similar effect on raw water colour production as observed on the Goyt.
These results are obviously exciting, as to date it was thought unlikely that colour production
would be influenced so directly by re-vegetation and gully blocking work on such a degraded
catchment. Furthermore, it was also expected that changes in water colour would take much
longer to become apparent, if at all.
3.10 Despite the unexpected results outlined above, the observed trends are slight and datasets are
still subject to climatic variations and so results and interpretations should still be treated with
caution.
3.11 The time series record for raw streamflow water colour in Chew Clough is illustrated in Figure 4.
Figure 4 Chew Clough - Raw Streamflow Colour 2007-2012
Ashway Gap – Streamflow Turbidity
16B
3.12 Monitoring results have consistently shown that there has been a statistically significant
decrease in mean raw water turbidity levels from pre treatment levels to post treatment levels.
Again, crucially, both median turbidity levels and standard deviations have also declined,
suggesting that the streamflow turbidity levels has also stabilised as well as decreased across
both study catchments.
3.13 In Chew Clough, raw streamflow turbidity levels appear to have decreased at an annual rate of -
0.136 (nonparametric trend slope coefficient) between 2008 and 2012. This equates to a 13.6%
decrease on average per annum. Taking the median daily turbidity level of 13.64 NTU (arithmetic
mean 30.11 NTU), this rate of decrease equates to a decreasing trend of approximately 1.85
NTU per annum in the post treatment period.
3.14 On Small Clough, overall trends in raw streamflow turbidity levels are static at the present time
(See Figure 5). The background rate probably remains in a decreasing state, but recent
presence of algae in the sample results in 2011 and 2012) has lead to false readings. Thus at
______________________________________________________________________________________________________________________
120274 7 United Utilities Water
August 2012 SCaMP Water Quality Monitoring – July 2012the present time, it can be assumed that turbidity levels will remain static, or else fall slightly with
increasing vegetation cover across the catchment and further gully blocking work.
3.15 Thus, the results of comparative statistical tests indicate that there have been real reductions in
turbidity (suspended sediment) levels as a result of SCaMP works across Ashway Gap.
Projecting these declining trends forwards, results indicate that, in theory at least, after ten years,
raw turbidity levels could have reduced to a theoretical minimum for the catchment, although this
is unlikely to be achieved fully until all the bare peat still on the site is restored.
Figure 5 Ashway Gap Small Clough - Raw Streamflow Turbidity 2008-2011
(Red ellipse denotes turbidity spikes caused by algal blooms)
3.16 Furthermore, these reductions in suspended sediment delivery have been achieved only by re-
vegetating bare peat areas across the catchment. As bare peat covers approximately 20% of the
catchment, the observed reductions in suspended sediment are highly significant and
demonstrate the effectiveness of blanket bog restoration in reducing suspended sediment
loading into streamflow and reservoirs.
3.17 It is important to note that the delivery of turbidity in streamflow is highly event-driven and so the
statistics presented here can in some ways be misleading. Periods of elevated suspended
sediment delivery during rainfall events may only last for one or two hours on these small, flashy
upland catchments. Thus daily sampling may completely miss many such events and so report
misleading, under-estimates for turbidity.
______________________________________________________________________________________________________________________
120274 8 United Utilities Water
August 2012 SCaMP Water Quality Monitoring – July 20124. BRENNAND STUDY CATCHMENT
7B
4.1 The River Brennand lies in the heart of the Forest of Bowland in Lancashire, serving as a
tributary to the River Hodder and forming a significant part of the headwaters to the River Ribble.
The Brennand catchment, rising to 527m, is some 1,100ha, with its headwaters divided into the
two large sub-catchments of Brown Syke (277ha) and Bield Field (166ha). The area is
characterised by deeply incised streams arising from blanket bog covered, gently sloping
plateaux with peat depths varying from 0.5m to over 2m.
4.2 Brennand Farm includes just over 400ha of blanket bog, almost all of which was identified as in
unfavourable recovering condition by Natural England in 2005, and 300ha of upland dwarf shrub
heath with some 15% classified as degraded. The study sub-catchments, Brown Syke and Bield
Field, were extensively gripped in the 1950s with over 25km of grips representing 15% and 37%
of the sub-catchment areas respectively. Bield Field has a proportionately greater area of its
catchment surface gripped at the same density as that of Brown Syke. In addition, the upper
catchment zone of Brown Syke is highly degraded with substantial areas of exposed peat and
bed rock, whereas Bield Field has an intact blanket bog/dwarf shrub heath cover throughout.
Brown Syke has also recently been fenced for stock exclusion.
4.3 Figure 6 illustrates the Brennand study catchment together with SCaMP monitoring plots and the
location of equipment installations.
Figure 6 Location of Monitoring Sites Across the Brennand Catchment
27B
______________________________________________________________________________________________________________________
120274 9 United Utilities Water
August 2012 SCaMP Water Quality Monitoring – July 2012Photo 3 Brennand Brown Syke Sub-Catchment Before (May 2007- left) and After (February 2009
- right) Major Grip Blocking Work was Completed
4.4 Grip blocking has been carried out on Brennand and Whitendale on a large scale. The grip
blocking process and its favourable consequences are illustrated in Photos 3, 4 and 5. At the
same time, sheep stocking levels were reduced (Brennand) or sheep grazing was re-introduced
(Whitendale). The objectives for these activities were:
to raise the water table in the peat, thus establishing wetter and, therefore, better condition
blanket bog, thus also increasing the possibility of maintenance and enhancement of
carbon sequestration;
to encourage, through this re-wetting, a more diverse blanket bog vegetation with more
characteristic plant species, including a greater cover and diversity of Sphagnum; and,
to reduce the production and loss of dissolved organic carbon (DOC), thus contributing to
improved water quality for UU’s treatment works, but also reducing carbon loss from the
peat store on the moorlands.
4.5 With an additional year's worth of post treatment monitoring data some key trends are now being
observed on the Brennand study catchment after extensive grip blocking and stock reduction.
These clearly present cause for cautious optimism, although the trends are not entirely
consistent across all sampling sites and instruments.
______________________________________________________________________________________________________________________
120274 10 United Utilities Water
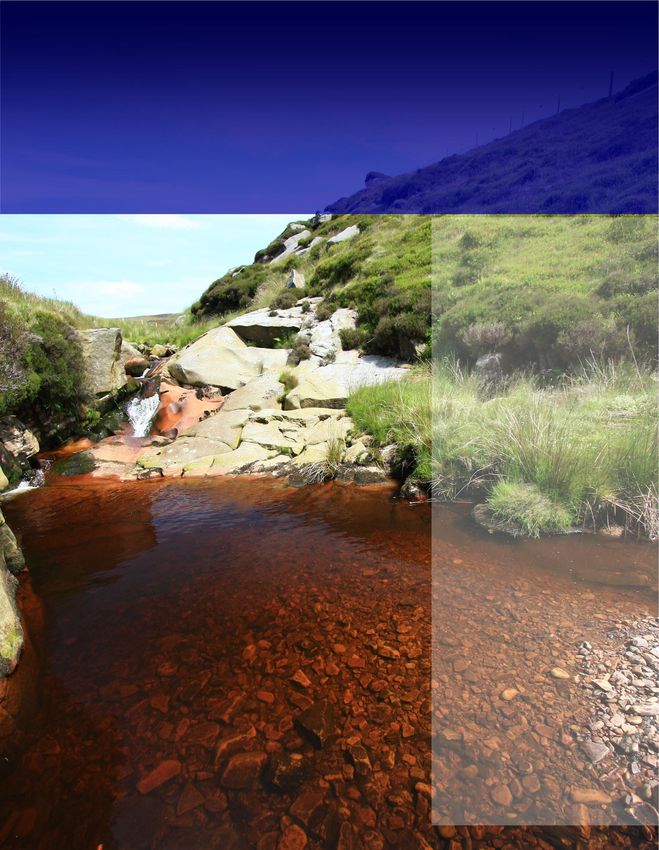
August 2012 SCaMP Water Quality Monitoring – July 2012Photo 4 A Blocked Grip in the Whitendale Catchment where Vegetation Succession is
Beginning to Fill in the Channel. In this Case, Sphagnum fallax is Building up in the Old Grip
______________________________________________________________________________________________________________________
120274 11 United Utilities Water
August 2012 SCaMP Water Quality Monitoring – July 20125. RAW STREAMFLOW COLOUR
8B
5.1 The latest statistical test results for Bield Field Stream indicate a (post treatment) stationary data
series that is neither increasing nor decreasing over time. Although not decreasing, this
represents positive news in that it shows how the rate of production and delivery of raw water
colour is remaining constant. This result also has to be considered in the context of the Bield
Field catchment which was intensively gripped and so displayed high, increasing levels of
streamflow colour previous to grip blocking.
5.2 Results from Brown Syke Stream are more positive. The latest trend test results indicate a slight,
statistically significant declining trend in colour in the post treatment (grip blocking) monitoring
phase. This is supported by a review of summary statistics for the pre and post treatment
phases, which show decreasing mean, median and standard deviation (variability in colour
delivery) in the post treatment phase compared with the pre treatment phase. This equates to a
current rate of decrease of 0.78% per annum.
5.3 Considering the highly degraded nature of the blanket peat across a significant area of the
Brown Syke catchment, this result is perhaps the most surprising and positive. The trend is
indicated in Figure 7.
Figure 7 Brown Syke Stream – Raw Streamflow Colour 2009-2012
28B
Streamflow Turbidity
17B
5.4 In Bield Field Stream, no statistically significant directional trends in turbidity levels have been
observed, although the overall trend appears to hint towards a slight decline in turbidity post grip
blocking (see Figure 8). Additional statistical evidence does support this notion as the monthly
mean turbidity levels are decreasing with time and, far more importantly, the variability is also
decreasing, as also illustrated in Figure 8. Taken together, the results indicate a reduction in
throughput of turbidity, suggesting that suspended sediment load is slightly lower and far more
stable post grip blocking.
5.5 In Brown Syke Stream, as with Bield Field, no statistically significant directional trends in turbidity
levels have been observed and the data series appears to be stationary. Here, however, there is
______________________________________________________________________________________________________________________
120274 12 United Utilities Water
August 2012 SCaMP Water Quality Monitoring – July 2012no additional evidence to suggest that the variability in suspended sediment delivery is
decreasing. All test results were non significant with no trends and changes in behaviour
detected.
Figure 8 Bield Field Stream – Raw Streamflow Turbidity 2007-2012
29B
Using ARIMA Models for Forecasting Colour and Turbidity
18B
5.6 Autoregressive moving average models (ARIMA) were employed in order to try to forward predict
trends and rates of change in raw water colour for the Goyt data series and for raw water
turbidity for both streams on Ashway Gap.
5.7 Unfortunately, the ARIMA models all predicted a zero rate of change, or stationary in the future
data series. This was almost certainly as a result of the very low actual rates of change and the
inherent variability in the data series in terms of seasonal variability and random noise. The
results of the ARIMA forecasting were therefore rejected. Having said that, no forecast model
showed an increasing trend in colour or turbidity.
5.8 In summary, the results of a variety of statistical tests indicate that SCaMP-induced
improvements in key water quality parameters are real, although usually slight in effect. This is to
be expected. However, long-term there will be significant benefits to the work undertaken for
SCaMP and definite improvements in water quality post works and compared to the previous ‘do
nothing’ or deteriorating catchment conditions, pre SCaMP.
______________________________________________________________________________________________________________________
120274 13 United Utilities Water
August 2012 SCaMP Water Quality Monitoring – July 20126. PEAT WATER TABLE RECOVERY
9B
6.1 SCaMP monitoring results (as reported in the Year 5 (2011) report) also demonstrate that across
many study catchments, water table levels are generally rising and stabilising, particularly in
zones adjacent to blocked grips. This is leading to real changes in vegetation, particularly the re-
establishment of Sphagnum species and, over time, the re-establishment of active blanket bog
vegetation communities (see Photo 5).
6.2 Having said this, a re-evaluation of the most recent peat water table monitoring datasets,
collected up to March 2012 is presented here.
Ashway Gap
19B
6.3 The peat water table dipwell installation on Blindstones Moss, Ashway Gap is still indicating a
statistically significant improving (decreasing) trend in peat water table depth over time, in the
post treatment period (Figure 9a). Results indicate that background peat water table depth is
decreasing, relative to the ground surface (i.e. the water table is gradually rising) in the peat
body, albeit slowly and the variability in water table depth is decreasing also, suggesting a slight
stabilisation in peat water table regime.
6.4 These results are particularly encouraging for the site at Ashway Gap, given the degraded nature
of the peat body. Examination of the monthly mean, median and standard deviation data allows
the potential to observe and quantify changes levels and variability further. This is currently being
completed.
6.5 In May 2010, a new study was commissioned on the Ashway Gap catchment where stone dams
were being used to attempt to block gullies over an extended timeframe. Resources have now
been diverted into utilizing technology to provide a more accurate, wider picture of how the
SCaMP works influence peat water table levels. Investment was made in an automated array of
eight peat water table level meters measuring depth every 50cm from a blocked gully every 15
minutes. This array has now been in for two years and a significant dataset is now accumulating.
The aim is for this data to be analysed within the next SCaMP year; a decision was taken not to
analyse the data now in order to allow a sufficient time span of records to accumulate.
______________________________________________________________________________________________________________________
120274 14 United Utilities Water
August 2012 SCaMP Water Quality Monitoring – July 2012DAILY MEAN PEAT WATER TABLE DEPTH (CM) - ASHWAY GAP BLINDSTONES MOSS
26/02/2008
26/03/2008
26/04/2008
26/05/2008
26/06/2008
26/07/2008
26/08/2008
26/09/2008
26/10/2008
26/11/2008
26/12/2008
26/01/2009
26/02/2009
26/03/2009
26/04/2009
26/05/2009
26/06/2009
26/07/2009
26/08/2009
26/09/2009
26/10/2009
26/11/2009
26/12/2009
26/01/2010
26/02/2010
26/03/2010
26/04/2010
26/05/2010
26/06/2010
26/07/2010
26/08/2010
26/09/2010
26/10/2010
26/11/2010
26/12/2010
26/01/2011
26/02/2011
26/03/2011
26/04/2011
26/05/2011
26/06/2011
26/07/2011
26/08/2011
26/09/2011
26/10/2011
26/11/2011
26/12/2011
26/01/2012
26/02/2012
0
20
40
60
80
100
DAILY MEAN GW LEVEL (CM)
120
Figure 9a Mean Daily Peat Water Table Depth - Ashway Gap, Blindstones Moss Dipwell
Goyt
20B
6.6 Visual examples of SCaMP-related peat water table level response are provided in Figure 9b
and 9c. As in previous years, the Goyt 1 Raven’s Low water table monitoring dipwell is
consistently indicating a weak improving (decreasing) trend in peat water table depth from 2007-
2012. At the Goyt 2 Derbyshire Bridge dipwell, a similar trend is observed over the same period.
Finally, the trend in improving (decreasing) water table depth is again observed at the Goyt 3
Foxhole Hollow water table dipwell.
6.7 Again, examination of the monthly mean, median and standard deviation data allows the
potential to observe and quantify changes levels and variability further. This is currently being
completed.
DAILY MEAN WATER TABLE DEPTH (cm) - GOYT 2 DIPWELL (2007-2012)
0
5
10
GROUNDWATER DEPTH (CM)
15
20
25
30
35
40
45
50
10/10/2006
28/04/2007
14/11/2007
01/06/2008
18/12/2008
06/07/2009
22/01/2010
10/08/2010
26/02/2011
14/09/2011
01/04/2012
DATE
______________________________________________________________________________________________________________________
120274 15 United Utilities Water
August 2012 SCaMP Water Quality Monitoring – July 2012Figure 9b Mean Daily Peat Water Table Depth – Goyt 2 Dipwell
DAILY MEAN WATER TABLE DEPTH (cm) - GOYT 3 DIPWELL (2007-2012)
0
5
10
GROUNDWATER DEPTH (CM)
15
20
25
30
35
40
45
50
10/10/2006
28/04/2007
14/11/2007
01/06/2008
18/12/2008
06/07/2009
22/01/2010
10/08/2010
26/02/2011
14/09/2011
01/04/2012
DATE
Figure 9c Mean Daily Peat Water Table Depth – Goyt 3 Dipwell
30B
Whitendale
21B
6.8 The Whitendale East peat water table dipwell shows a stable groundwater regime with no overall
time series directional trend. However, the Whitendale Central water table dipwell shows a very
slight, statistically significant improving (decreasing) trend in peat water table depth (increase in
level) over the monitoring period 2007-2012.
6.9 Similarly, the Whitendale West water table dipwell shows a similar, though slightly stronger trend
to that observed at the Central dipwell, with a slight, improving (decreasing) trend in peat water
table depth for the period 2007-2012.
6.10 Taken together, available evidence points to stable or improving groundwater conditions at the
monitoring sites.
Brennand
2B
6.11 On the Brennand study catchment, peat water table monitoring dipwells on Brown Syke (the
catchment with extensive, degraded sections in its upper reaches) both appear to indicate very
slightly declining peat water table levels. At the Brown Syke 1 monitoring dipwell, peat water
table depth appears to be increasing very slightly and the Brown Syke 2 dipwell shows an
identical, very slight increasing trend also.
6.12 These results are interesting as analyses of the peat water table levels at the Brennand Control
dipwell indicates an identical, increasing trend in water table depth over the same monitoring
period. Thus, the results show that although trends seem to be indicating a slight drying out of
the peat body, this is also the case on the control site and is, therefore, likely not to be a result of
any SCaMP-related land management change.
______________________________________________________________________________________________________________________
120274 16 United Utilities Water
August 2012 SCaMP Water Quality Monitoring – July 20126.13 Across the catchment on Bield Field, the decreasing peat water table levels observed across
Brown Syke and the Control site are replicated, with the exception of the Brennand Bield Field 2
dipwell, which is showing a rather marked decrease in water table depth (increase in level)
relative to the ground surface. It is not known why this one dipwell is showing a markedly
different trend to all others across both sub-catchments, but taken all together, the results
suggest a slight drying due to other factors such as climatic conditions or peat pipes rather than
any land management-induced changes on the ground.
6.14 The latest Bield Field peat water table monitoring results are conflicting when compared to
results from previous years and when compared with water table regimes on the adjacent
Whitendale study catchment. This highlights the need to take into account seasonal and longer-
term climatic effects when considering the results of statistical tests for trend and change within
the SCaMP Monitoring Programme. In addition, there may be other unknown factors serving to
complicate patterns and trends further, such as the presence of peat pipes and macro-void
structures, which may locally affect peat water table regimes.
6.15 Investigations into the localised effects of grip blocking across gullies and grip cross sections has
been undertaken in two distinct ways, manual measurements around grips, and automated
monitoring of a gully.
6.16 The study into the influence of grips on peat water table levels using manual techniques was
undertaken between 2006 and 2010. This was reported in the 2010 report following the
successful grip blocking of the Brennand catchment in Bowland. The results demonstrated a
levelling of the peat water table surface within the cross sections of grips where the localized
influence of grip drainage was arrested.
Photo 5 Peat Water Table Recovery Leading to Vegetation Re-colonisation with Sphagnum
Following Grip Blocking
______________________________________________________________________________________________________________________
120274 17 United Utilities Water
August 2012 SCaMP Water Quality Monitoring – July 2012Concluding Remarks
23B
6.17 Taken together, the results from the latest batch of trend tests broadly support observations from
previous years and across all SCaMP study catchments, where peat water table levels are seen
to respond positively in the post SCaMP (grip blocking, grazing removal and gully blocking)
period. Measured water table levels have generally been slowly rising in the peat profile and
becoming generally less variable, as reflected in the diminishing standard deviations. Achieving
this was a direct SCaMP objective and one which appears to be working, though with some
degree of success and variation.
______________________________________________________________________________________________________________________
120274 18 United Utilities Water
August 2012 SCaMP Water Quality Monitoring – July 20127. CAN SCAMP CHANGES BE DETECTED
10B
DOWNSTREAM? - EVIDENCE FROM ERRWOOD
RESERVOIR, GOYT
7.1 A final set of analyses were undertaken in order to investigate whether the potential water quality
benefits from SCaMP-induced land management changes can be detected in raw water colour
downstream in the reservoir of the Goyt study catchment. Errwood Reservoir was chosen as a
suitable site for study as the treated catchment feeds directly into the reservoir and makes up the
majority of the supply into the reservoir. No other monitored SCaMP catchment is suitable for this
type of investigation.
7.2 Time series analyses and trend tests were undertaken on the raw water colour data, which has
been collected from Errwood Reservoir by UU since 1990, and regularly since 2000. The time
series plots are illustrated in Figures 10a, 10b and 10c below, which show the entire data series
(Figure 10a), the same data from 2000 onwards, when regular sampling commenced (Figure
10b) and the same data from the post SCaMP land management period only (Figure 10c).
Figure 10a Raw Water Colour Time Series Plot - Errwood Reservoir, Goyt 1990-2012
31B
7.3 The trend test results indicate a consistent picture of slight, but statistically significant increasing
colour levels in the reservoir. When the data series are considered as a whole, including the
small number of spot samples taken in the period 1990 to 2000, there is a slight, statistically
significant increasing trend in raw water colour (slope 0.003, n = 329, p 0.001) when
the data are confined to the period where regular monitoring began, i.e. 2000 onwards (Figure
10b).
______________________________________________________________________________________________________________________
120274 19 United Utilities Water
August 2012 SCaMP Water Quality Monitoring – July 2012Figure 10b Raw Water Colour Time Series Plot - Errwood Reservoir, Goyt 2000--2012
32B
Figure 10c Raw Water Colour Time Series Plot - Errwood Reservoir, Goyt for the post SCaMP
3B
period, 2007-2012
______________________________________________________________________________________________________________________
120274 20 United Utilities Water
August 2012 SCaMP Water Quality Monitoring – July 20127.5 However, when the dataset is further confined to the post-SCaMP land management phase, from
spring of 2007 until the present, an increasing trend is observed, but at a lower rate of increase
(slope 0.001, n = 184). These data are illustrated graphically in Figure 10c. In all cases, the trend
test accounts for the strong seasonality in the data. Tentatively, this result can be interpreted that
the rate of colour increase in the reservoir is slowing and that this may be direct evidence
confirming that SCaMP land management treatment does have a positive effect on water quality
in the reservoir.
7.6 Broadly speaking, the results appear to show a changing state of colour flux from one of net
increase to net decrease. These results broadly support those found in the Upper Goyt stream
running directly off catchment.
______________________________________________________________________________________________________________________
120274 21 United Utilities Water
August 2012 SCaMP Water Quality Monitoring – July 20128. WATER QUALITY MONITORING – CONCLUSIONS
1B
8.1 In summary, the results of a variety of statistical tests indicate that overall, SCaMP-induced
improvements in key water quality parameters are real, although relatively slight in effect. This is
to be expected. However, long-term there will be significant benefits to the work undertaken for
SCaMP and definite improvements in water quality post works and compared to the previous ‘do
nothing’ or deteriorating catchment conditions, pre SCaMP.
______________________________________________________________________________________________________________________
120274 22 United Utilities Water
August 2012 SCaMP Water Quality Monitoring – July 20129. REFERENCES
12B
Anderson, P., Tallis, J.H. and Yalden, D.W., 1997. Restoring Moorland: Peak District Moorland
Management Project Phase III Report. Peak Park Joint Planning Board.
______________________________________________________________________________________________________________________
120274 23 United Utilities Water
August 2012 SCaMP Water Quality Monitoring – July 2012You can also read