Update and 2020 Outlook for Precious Metals - Nicky Shiels, Metals Strategist January 2020
←
→
Page content transcription
If your browser does not render page correctly, please read the page content below
Update and 2020 Outlook for Precious Metals
                         Nicky Shiels, Metals Strategist

                                        January 2020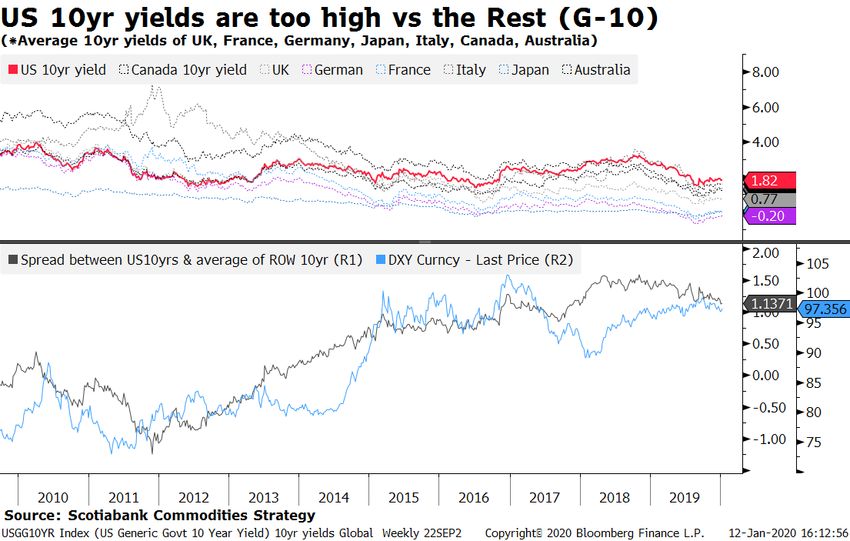
Table of Contents

    THE MACRO BACKDROP, KEY ASSUMPTIONS & 2020 INVESTMENT THEMES   Pages 3-15

    GOLD UPDATE & OUTLOOK                                          Pages 19-25

    SILVER UPDATE & OUTLOOK                                        Pages 26-29

    PLATINUM UPDATE & OUTLOOK                                      Pages 30-34

    PALLADIUM UPDATE & OUTLOOK                                     Pages 35-37

                                                   2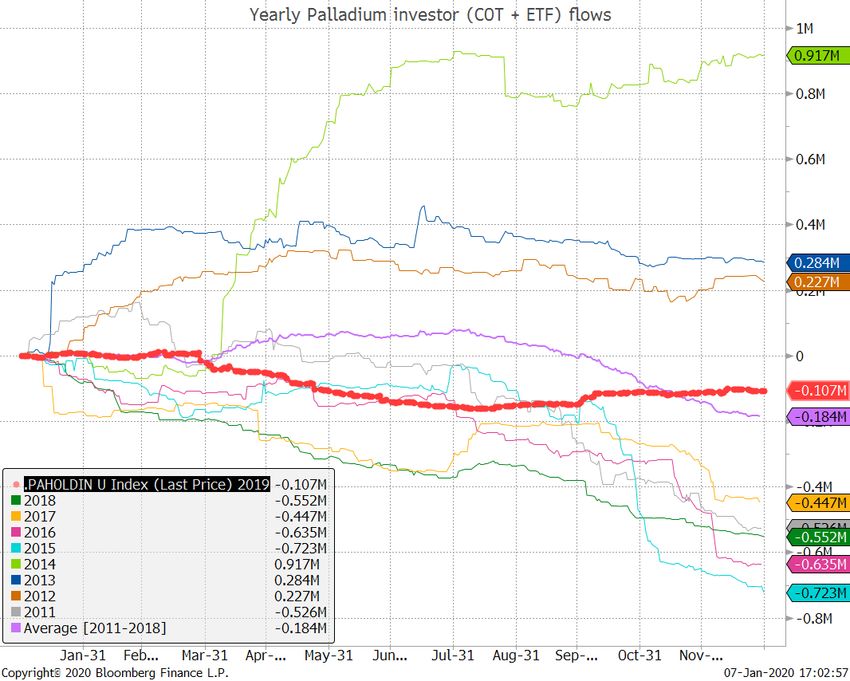
The macro backdrop & expectations for 2020
A summary of key macroeconomic expectations and assumptions for 2020
 … that will thus help frame our outlook and thinking in both base and precious

 Growth & recession risk: A tepid and gradual recovery is expected in 2020, and markets should be careful to make the distinction that
 slow and low global growth is not recessionary; this (fragile) “goldilocks” outlook hinges on supportive central bank policy, stabilizing data
 with diminished economic and trade risks BUT higher geopolitical & election risk. (Page 12)

 Interest rates & liquidity: the coordinated dovish Developed Market CB pivot that drove risk markets in 2H’2019 is behind us.; peak
 negative yielding debt ($17tn) is also behind us given the pushback and rethink around negative interest rates (ultimately undermining their
 safe haven appeal). However, liquidity comes in various forms and while the Fed is largely expected to be on a sustained hold throughout
 2020 (reinforcing our low for longer US interest rate profile), they have indicated that they're OK with letting the economy run a little hot
 while the (NY) Fed is likely to continue buying short duration Treasuries in 1H’2020; that should lead to a boost in inflation expectations.
 (Page 7-8)

 Inflation: Inflation risks are underappreciated given the Feds stance, potential expansionary fiscal policies due to social unrest, and the
 cost push from ESG & protectionist trade policies. There’s a growing risk that markets shift from financial/equity inflation into real asset
 inflation (page 7-8)

 Risk Sentiment: Continue to expect volatile shifts in sentiment, driven by trade and (geo)political themes creating large divergences
 between sentiment beliefs (positioning) and reality (data). (Page 5)

 FX trends and the US$: Our core $ house call through 2021 implies the DXY weakening ~8%, from current levels of around ~97 while
 currency market volatility is overdue an awakening, already witnessed in global bonds, most commodities & equities (page 10).

 Trade: Expect a series of 'mini-wins' and positive rhetoric within a broader framework of global protectionism; little aggressive trade
 escalation is expected into the 2020 US elections, but there should be no respite either, given the ‘need’ to keep US growth and risk assets
 buoyed. (page 11 )

 US politics: US election risk remains underpriced with little premium being factored in, on a progressive Democratic nominee; it will
 become a tradeable theme after Super Tuesday in which the path toward and into November will likely become messy and disorderly
 keeping election sensitive assets / macro vol bid. (Page 13).

 Geopolitics: the frequency of off-calendar geopolitical risks and events are rising, driving the need for more tactical tailrisk hedging. (Page
 13-14)

                                                                        4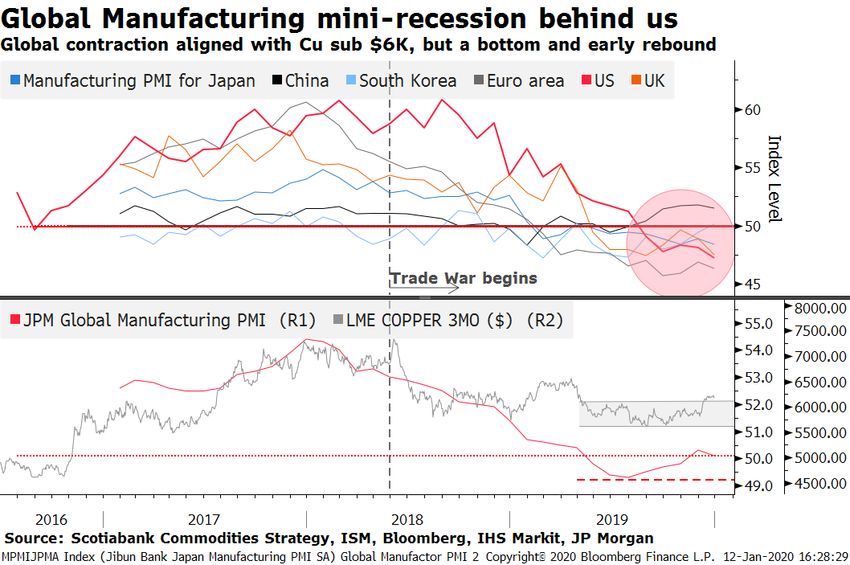
2019: volatile shifts in sentiment; strong performances across risk assets

 • 1H 2019 – risks contained

       • Low volatility, complacent regime

       • Sustained Fed pause after the January FOMC

       • Risk assets trend

 • Summer 2019 – peak Geopolitical
   uncertainty, trade & recession fears
       • Trade, geopolitics & Fed change course

       • Outsized repricing in global bonds; $17tn of global
         debt demand negative yields

       • Global manufacturing collectively really rolls over

 • 4Q 2019 -- trade hopes & liquidity injections

       • Shift from trade escalation to de-escalation
                                                                      It going to be very tough to repeat the
       • Low volatility, complacent regime
                                                                   above-average, double digit returns of 2019
       • Macro fear trumped by liquidity, led by the Fed            seen in most sectors except Commodities
                                                                   and EM FX. Historically, sharp risk-asset are
       • Reflation trades re-emerge
                                                                         followed by more modest growth
       • Reduced need for recession hedges/havens

                                                               5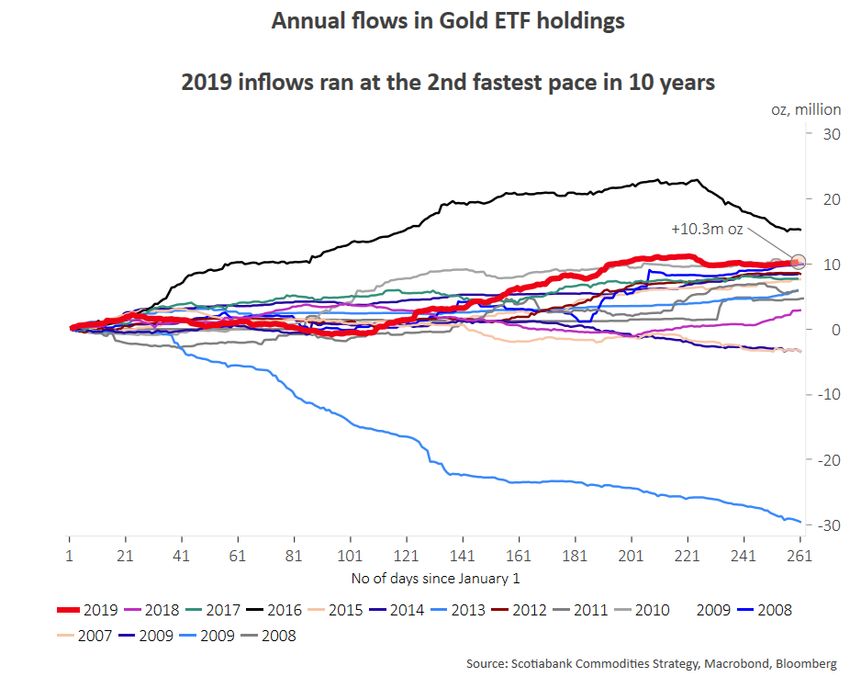
Geopolitical, trade & Fed risk peaked in 2019; remain vigilant in 2020
• 2019 will be known as the year of relentless cheap money (unleashed by the Feds U-turn from hikes to cuts and re-
  expansion of their Balance Sheet), US/China trade policy U-turns and a major global manufacturing growth slowdown, that
  altogether drove negative yields through the financial system and led to peak recession fears

• The hot summer of 2019 marked several major turning points in trade, geopolitics/politics & monetary policy injecting
  broad-based macro fear and volatility. But in Q4’19, trade de-escalation & CB easing led to a dramatic shift in narrative;
  markets debated between “no recession vs cyclical upturn” instead of “recession vs no recession”

• Current volatility is relatively low, the macroeconomic regime is ultra complacent and theres a reduced need for recession
  hedges or havens. However, volatility flare-ups are underpriced into 2020 with political and geopolitical developments still
  a large ‘unknown’ creating a key risk for overly optimistic sentiment.

                                                                     The largest macro moments of 2019:
                                                                     •   Flash crash in the Yen (January)
                                                                     •   The January to July U-turn in Fed policy and switch from
                                                                         autopilot QT to Balance Sheet increases (QE)
                                                                     •   Reemergence of currency wars (summer 2019) and the
                                                                         renminbi ‘cracked 7’
                                                                     •   US repo markets stress (September)
                                                                     •   US/China Trade - tariffs or deals - delivered by tweet (all year)
                                                                     •   Brexit shenanigans (all year)
                                                                     •   High profile IPOs or attempts to IPO (WeWork, BeyondMeat,
                                                                         Uber, Lyft) mostly disappointed
                                                                     •   Geopolitical and Middle East tensions became more frequent
                                                                         and underpinned oil markets and other havens
                                                                     •   Anarchism returned with large and violent protests in Chile,
                                                                         Lebanon, Spain, Iraq, Hong Kong, India, France and Russia (all
                                                                         year)

                                                                 6
Interest Rates & The Fed: liquidity in various forms
• Macro fear was trumped by liquidity, led by the Feds 3 “midcycle” rate
cuts in 2H’19. Global G-10 Central Banks have cumulatively cuts rates by
175bps while the Fed has pumped over $400bn worth of liquidity since
the repo markets seized up in September.
• The Fed is largely expected to be on a sustained hold throughout 2020,
with the NY Fed likely to continue buying short duration Treasuries in
1H’2020; the Fed has hinted that they're OK with letting the economy
run a little hot which should lead to a further boost in inflation
expectations. That supports “all-boats rise” in which Gold and havens
can perform, but Golds unlikely to outperform risk assets (IF
geopolitical / trade risks remain contained). Overall, the coordinated
dovish DM CB pivot that drove risk markets in 2H’2019 is behind us.
• The consensual outlook from ‘the street’ is for US Treasuries (10years)
to remain below 2%, which isn't wrong in light of relative pricing vs other
G-10 countries and expectations for growth, inflation and monetary
policy. Havens such as US Government bonds and Gold still have a role
to play as insurance (despite low yields and recent gains).
• Inflation risks are underappreciated given:
• The Feds past action and stance - U-turn on both rates (from
hikes to cuts) and Balance Sheet trends (from Quantitative
Tightening to ‘QE’) with “sustained inflation” required before
they act
• Expansionary fiscal policies (eg: higher wages) to appease large
scale social unrest globally
• The cost push from ESG, decarbonization policies and
protectionist policies/tariffs.
There is a growing risk that markets shift from financial/equity
inflation into real asset inflation
7Interest Rates & The Fed: liquidity in various forms
• Negative interest rates remain despite the the pile of
negative yielding debt falling from a peak of $17tn in
Q3’19 to ~$12tn currently. That pile is likely to have
peaked in 2019 (given the pushback and rethink
around negatively yielding European debt ultimately
undermining their safe haven appeal) but the amount
of negative yielding debt should still remain sizeable.
That’s because weak inflation, structural long-term
demand for government debt and expectations for
ECB rates to stay below 0%, remain in place.
• However, the full (and perverse) implications from
negative debt has yet to be felt (or known) thereore
its highly unlikely the Fed targets a negative range
into the next recession (upheaval in money markets,
essentially a tax on banks lending to the Fed which
only Congress can technically do). That implies the
Fed will be forced to get creative given that its room to
maneuver on interest rates remains very limited.
• For now, and into 1H’2020, further US yield curve
steepening (away from the recessionary “inverted
levels”) is possible if global growth and inflation
expectations continue to run. There is little
correlation between a steeper yield curve and Gold
prices (unless rate cuts are imminent and real rates
remain flat or negative).
8A Fed pause: what happened during past pauses
A Fed rate pause which is usually associated with “Goldilocks” growth (or a recovery that’s rather fragile), is most favourable
to both US and EM equities, AND high beta illiquid metals like Nickel, Palladium & Zinc
Asset & metals performances over the past 3 Fed pauses (2006,
9.0% 2016, 2019)
8.0%
7.0%
6.0%
AVERAGE Monthly
5.0%
performance on 2019
4.0% pause***
3.0%
2.0%
AVERAGE Monthly
1.0% performance on 2006
pause**
0.0%
-1.0%
-2.0% AVERAGE Monthly
performance on 2016
pause*
* 2016 Fed pause: Dec '15 hike - Dec '16 hike ** 2006 Fed pause: June '06 hike to Sept '07 cut
*** 2019 Fed pause: Dec '18 hike to July '19 cut
Source: Scotiabank Commodities Strategy, Bloomberg
9The US$ Outlook: Tirelessly resilient but 2020 looking increasingly different
• Our core $ house call through 2021 implies DXY weakening ~8%, from current levels of around ~97. Persistent USD$ strength
is probably peaking as interest rate differentials are generally tilted against it while the China-US de-escalation will induce an
unwind of typical haven currencies specifically the US$.
• Additional US$ headwinds also stem from, 1) further stalling of US growth or “US exceptionalism” as fiscal stimulus (2018)
and monetary policy (2019) fade, 2) renewed pressure as markets refocus on the unsustainable US fiscal path/debt levels,
and 3) added uncertainty around the US presidential election
• Currency market volatility is also overdue an awakening (already witnessed in global bonds, most commodities & equities)
• Metals most likely to benefit from broad-based USD strength (vs DM currencies) are Gold, Silver, & Platinum. On the contrary,
Nickel, Rhodium and Zinc are the historical benefactors on any EMFX strength
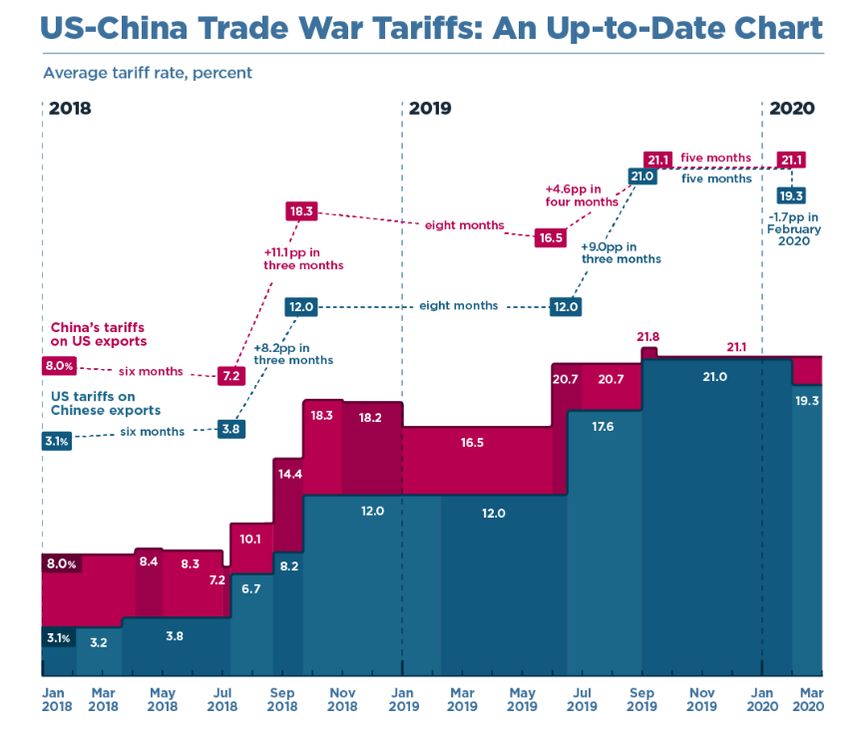
10US/China Trade: Expect a series of 'mini-wins’ within protectionism
• Expect a series of 'mini-wins' and positive rhetoric
within a broader framework of global protectionism;
little aggressive trade escalation is expected into the
2020 US elections, but there should be no respite
either, given the ‘need’ to keep US growth and risk
assets buoyed.
• 2019s trade wars have been somewhat of a
distraction to the major rift in the US / China
relationship over technological competition. The
likelihood over any comprehensive trade agreement
including national security, IP/tech and human rights
issues, in 2020 is very small.
• The Phase One trade deal (note documents remain
sealed) agreed upon in mid December in reality does
little for manufacturers by keeping the 25% tariffs on
most imported Chinese goods; it has a relatively
larger impact on sentiment (which has drastically Source: The Peterson Institute
improved) vs actual activity
• “Phase one" seems to lock in a new normal of higher
tariffs (vs a year ago). And while Phase Two may
provide further improvement, that is 1) only expected
after the November US elections, and 2) depends on
who is in the White House where Democratic rivals are
likely to be as protectionist as Trump
112020: Slowest global growth since 2016 but the bottom is in
• Recession risk has receded dramatically due to the de-escalation of two key event risks for the global markets (US China trade war and
a no-deal Brexit) and coordinated CB easing.
• A tepid and gradual recovery is expected in 2020, and markets should be careful to make the distinction that slow and low global
growth is not recessionary; this (fragile) “goldilocks” outlook hinges on supportive central bank policy, stabilizing data with diminished
economic and trade risks BUT higher geopolitical and US election risk.
• Raw commodities can be a leading indicator in recoveries with the following lessons from the CRB Rind Index evident:
• Commodities were not at recessionary levels in 2019, despite sentiment calls and other recessionary indicators (inverted yield
curve).
• Dips in raw commodities are historically shallower (vs the 2008 and 2016 commodities nadir) and upturns are historically sharp.
• There is a bottom in raw commodity prices and early signs of a reflationary rebound in Q4’19. However, its tough to expect this
upcoming 3rd manufacturing bounce (since the GFC) into 2020 to mimic the reflationary bounce in commodities in 2016, due to
limited Chinese growth with little appetite for a repeat of their large-scale stimulus of the past.
122020 Politics: Modern Politics makes surprises the norm
• With currently 13 major candidates, the Democratic 2020
presidential field is one of the largest, competitive, and arguably
unpredictable in modern history.
• Markets usually struggle to fairly price in election risks (due to
innate binary outcomes) after analyzing the two competing
agendas relating to trade & tax policy, regulation & fiscal spending.
This is further complicated given the unpredictability of Trump -
will he campaign as Trump 1.0 (the market-friendly, deregulating,
tax cutting person seen in the 2 years post 2016 election) or Trump
2.0 (the protectionist tariff man the market feared in 2016 but who
only ‘emerged’ in 2018)?
• There's plenty of historical analysis outlining how risk markets
react to a Democratic or Republican White House win, whether one
party controls Congress or not, or whether stock markets have any
predictive powers (strong equity returns in the lead up to elections
have an uncanny ability to ensure the incumbent party wins). That
could be a useful exercise after the Democratic nominee is known
(after Q1’20). However it’s the path toward and into November that
will likely become messy and disorderly, characterized by polarized
and angry rhetoric and one in which markets will need to price in
the fact that political surprises have become the norm; that should
keep election sensitive assets / macro vol bid
• Overall, the US election will be a highly tradeable theme in 2020
US election risk remains underpriced with
especially after Super Tuesday (March 3rd) in which we’ll likely know little premium being factored in on a
the Democratic candidate. The most likely outcome is a Trump re- progressive Democratic nominee.
election, given current financial and economic conditions; that's the
best case for risk assets as it extends the status quo and especially if
Republican also control Congress, which could usher in a 2nd round
of tax cuts driving equities higher but also deficits (positive Gold).
The best case for Gold (worst case for equities) is if either
progressive (Elizabeth Warren or Bernie Sanders) is elected,
especially if the Democrats also gain full control of Congress – the
market friendly Trump policies are then likely to be unwound.
13A list of macro uncertainties to monitor in 2020
Potential catalysts for renewed recession fears and/or the end of decade long bull market in US risk
3 known core macro uncertainties: Potential lesser known macro uncertainties:
Shaky Banks in Europe
Global growth falters further ()
Debt mountain in China
A Central Bank policy mistake
Corporate Leverage in the U.S
Escalating geopolitical or trade tensions ()
Official currency intervention
Major selloff in credit markets and/or interest rates
A dollar-yuan break through 7-handle ()
2020 U.S. election: an elected progressive Democrat
Impeachment risk
Inflation gradually, then suddenly accelerates
A global (not Chinese) ‘carmageddon’
Threat of a US debt default
Problems sourcing market liquidity ()
European or other recession risk
() Achieved. (-) Undecided; TBD. (x) Not achieved
in 2019
14Macro Investment themes to consider for 2020
“Investment idea” Thinking Metals Trade Expression
• De-escalating US/China trade war • Tactically long higher
Short $ • Swelling twin deficits beta Gold proxies / $
(tactical) • US growth “exceptionalism” behind us hedges (Platinum,
• Trump & modern politics: 2020 US election campaign Silver, Copper)
• Trade policy remains highly unpredictable
Long Volatility • (Fake) new cycles driving whippy intraday price action & unpredictability • Long low volatility,
(structural) • Skepticism growing around power of CBs to pump up asset prices safe-haven currencies
• Inherent & unexplained lack of market/screen liquidity (e.g.: Gold, CHF, JPY)
• Growing number of late cycle macro wobbles
• Trade policy remains highly unpredictable & complicated by climate
change policies (“carbon tariffs”)
Short Politics &
• Increasing frequency of “off-calendar” geopolitical events/risks
Geopolitics • Long Gold as a
(structural) • Rise of protectionism globally - “Globalism” vs “nationalism” political hedge
• Partisan polarization and 2020 US election campaign
• Low/slow growth, income inequality fueling further political uprisings and
protests
• Fed U-turn on both rates (from hikes to cuts) and Balance Sheet
expansion (QT to ‘QE’): “sustained inflation” required before they act
• Expansionary fiscal policies (higher wages) to appease large scale
Long inflation
social unrest
(structural) • Long Commodities
• ESG: cost inflationary supply constraints, tighter future commodity
supply.
• Political pressure due to climate change unlikely to dissipate
• Protectionist trade policies / tariffs
15Precious metals update & outlook
Precious Performances

                        17
Metals performances over the decade
18Gold… was smart in 2019 & hit record highs in 73 currencies
Gold Outperformance Requirements Only 2 out of 4 drivers “on” in 2019 • DESPITE a resiliently strong & compressed
US$ and a lack of (sustained) US equity
1. Sustained equity market volatility () 3. Lower yields for longer () volatility, Gold made a statement breakout in
summer 2019
2. A negative U.S$ catalyst () 4. A dovish leaning Fed ()
() Achieved. (-) Undecided; TBD. (x) Not achieved
• It became sensitive to geopolitical and trade
risk and the repricing was (smartly) aligned
with a shift in Fed policy.
• There are technical similarities between the
repricing higer in 2019 (into a bull market)
versus repricing in 2013 (into a bear market),
which should be respected.
• Gold has entered a new bull market and begun
to internalize geopolitical, political, trade &
growth risks, which is a constructive new
development, compared to its responsiveness
over the previous 6 year bear market
19Gold is a rate cut hedge and more…. Analysis of Golds “Fear Premium”
• While Gold pricing was aligned with a shift in the Fed in 2019, its
NOT only a hedge to potential Fed cuts. Pricing also
incorporates the threat of fear drivers such as trade,
political/geopolitical & growth re-emerging.
• Correlation chart shows that real US yields and the US$ are
both reliably strong current and past core drivers of Gold.
• Golds current ‘fear premium’* of ~$200 is somewhat overpriced
vs equity market volatility in the short-term.
• However, the historical highs ranged from $400-$600,
suggesting that political/geopolitical & trade risk remains
underpriced; that especially important into 2020, as election
risk rises, the business cycle matures and the frequency of off-
calendar geopolitical events likely remains high.
* Utilizing a multiple regression model to establish the implied Gold fair
price given current US$ and real yields.
2009 - 2019 (current)
Real US 10 Nominal
DXY
Yields* Yields
10year monthly Correlation with Gold -0.71 -0.45 -0.43
Gold with current real 10yr yields (+0.14) $ 1,397
Gold with current DXY (96.40) $ 1,227
Weights 0.61 # 0.39
Gold with DXY/10yr weighted $ 1,329
(40% DXY, 60% real)
Fear premium* $ 200
Current Gold price $ 1,529
*10yr US Treasuries - 10yr Breakevens
Source: Scotiabank Commodities Strategy
20Official Sector demand: becoming more active & lifting floors
• Very strong Central Bank inflows totaled 22m oz on an annualized basis in 2019, making it the 2nd largest year of purchases this
decade. This was somewhat highlighted by BOE gold trading at an historical premium vs unallocated London Gold
• Emerging Markets were avid Gold purchasers this year led by China, Turkey, Russia, India and Kazakhstan. Poland was also a large
purchaser of Gold.
• This trend - especially amongst Emerging Market CBs- is expected to continue in 2020 but probably at a slightly slower pace given
lofty Gold prices in local currency terms; new & atypical CBs will also continue to “de-dollarize” into the current mature business cycle
and increasingly more fraught geopolitical and trade regime
• Overall, Central Banks have recouped 80% of what was ‘lost’ since 1990 under the various CBGA agreements; there is still some
capacity to accumulate from a historical perspective, and even more capacity due to the fact that EM CBs traditionally hold a much
smaller share of FX reserves in Gold vs their DM counterparts.
21Investor interest: phenomenal signs of interest and inflows from the West
• Largely US & European investors turned net bullish in 2019 where sentiment improved from an underweight base after years of
running net short positioning (COT). That was driven by the technical statement repricing in summer 2019 as the market scouted for
havens to hedge out trade war, currency war, geopolitical and recession risks with global interest rates negative.
• Investors (net COT and global ETF holders) own a combined ~103m oz of Gold after accumulating ~27m oz in 2019, their 2nd largest
year of Gold buying (after 2009s net purchase of 33m oz). That was driven by a combination of ETFs (+10.3m oz) and COT (17m oz).
This peak length does provide some short-term downside risk for prices.
• However, without US equity market volatility and an unwind of the sustained bull run, the larger equity or generalist investor is still
underweight Gold Gold investor holdings represent only 0.6% of the market cap of SPX, vs a peak of >1.6% seen in 2011. That
provides longer-term upside risk as Gold has shown to adapt to being both 1) a real asset hedge against equity inflation and 2) a safe
haven / late-cycle hedge against the possibility of sustained equity volatility or weakness.
22Physical demand: muted purchases with Asia dehoarding
• Physical demand in 2019 remained subdued with strong physical dishoarding also notable from Asian Gold hubs. Indian demand lost
significant momentum in Q3, and while there was a revival in Q4 due to the traditional wedding and festival season, fears over a
potential GST(Good & Services Tax) from 3% to 5%, together with higher prices in local currency terms dented demand; overall FY
demand is expected to be at the lower end of 700-750 tonnes
• Chinese physical investor (gold bar sales) interest has also suffered large losses in 2H’2019 due to concerns over further yuan
depreciation moderating given trade de-escalation and the phase one deal; theres also a preference to hoard cash or other
alternative currencies instead, during the current trade and macroeconomic uncertainty.
• CB & Investors have bought a combined ~50m oz on an annualized basis in 2019; a simple regression model implies Gold should have
gained 24% (vs ~18% in 2019), indicating that strong OTC physical dishoarding has managed to cap potential gains. Overall, Gold
remains an investment story (driven by Western flows) not a commodity story (driven by Eastern flows); through a commodity lens,
Gold is overvalued, a headwind for any potential gains in 2020.
23Summary: Current Bullish vs Bearish Drivers for Gold
Tailwinds Neutral Headwinds
Positioning and sentiment: fast money (COT +
Increasing frequency of 'macro wobbles' and Fed reluctantly cut rates and now pausing,
ETF & perhaps OTC) is well ITM, with positioning
derisking episodes; extreme and fast shifts in risk downplaying QE-lite/expansion of BS. Some global
saturation leading to downsizing; however the
sentiment (from recession fears to exuberance) central bank policies putting the onus on fiscal
generalist (FI, Equities) investor remains largely
indicative of late business cycle policy and highlighting monetary policy limits
underweight
Trade, Geopolitics: de-escalation in the US/China
trade with Phase 1 deal. Any formal comprehensive Lack of sustained macro fear/equity volatility
Underlying growth fears persists, especially the
US/China trade deal or Phase 2 unlikely before US (VIX MORE BEARISH
------> MORE BULLISH
US election risk remains underpriced with little A stubbornly perky US$. Outlook on whether the $ 2020 reflation risk or fear of sustained US data
premium being priced on a progressive Democratic extends into cyclical weakness is mixed, given its outperformance and / or trade deal promoting a
nominee reserve currency status & historical resilience more hawkish Fed into 2020
Fiat currencies politicized with markets in a cold Higher pace of Central Bank gold buying,
Muted physical support from India & China as
currency war; growing risk of US currency diversifying against fiat/US$ and slower global
higher prices in local terms defer purchases; XAUINR
intervention to weaken the $ and reduce the dollar growth in 2019; small risk of CB demand slowing in
near record highs & XAUCNH at 6 year highs
dominance (and dependence on it) in financial 2020 due to significantly higher prices and renewed
deterring jewelry consumption
system trade optimism2020 Short-Term Outlook & factors required for upside/downside pricing
Base case: $1600/oz Average Price (50%) • Bullish case & upside risk (~$1800/oz):
Gold range: $1500/oz (new cyclical floor) - $1700/oz (soft ceiling dependent on 1) equity market volatility*, 2) inflation
into U.S elections). risks**, 3) the limited effectiveness of CBs to control
global growth slowdown, new risks (trade) and
Despite a resiliently strong & compressed US$ in 2019, Gold made a equity market volatility, upping the appeal of
statement breakout out of its 6-year bear trend in the summer, as it became real/hard assets as a source to either hedge share
sensitive to geopolitical & trade risk with a repricing that was (smartly) aligned price inflation (on liquidity injections) or volatile
with a shift in Fed policy. Technically it has entered a new bull market without paper assets (30%)
the ‘help’ from potentially two other bullish drivers (sustained equity market
volatility and systematic US$ weakness).
• Bearish case & downside risk (~$1400/oz):
Gold remains an investment story (driven by Western investment flows of emergence of sustained reflation risk – improved US
~30m oz and Central Bank buying of 22m oz), and less so a commodity story data, rebound in global mfg PMIs, and
(driven by Eastern physical flows); we don’t see this participation mix and rate comprehensive trade deal leading to the Fed hikes
changing much in 2020 as Central Banks & Eurasia continue to “de-dollarize” & thus large-scale positioning deleveraging in both
into the current mature business cycle and increasingly more fraught Bonds and Gold (20%)
geopolitical and trade regime.
Gold prices in 2020 will be driven by 1) the US election cycle (a highly
tradeable theme especially after Super Tuesday), 2) trade & geopolitics
(expect a series of 'mini-wins' and positive trade rhetoric within a broader
framework of global protectionism, ultimately eroding the appeal of
safehaven US$, less so Gold), and 3) the US$ and a Fed on a dovish hold
(continuing to provide a liquidity backstop throughout 1H’2020).
Probability
Super bullish gold drivers (resilient repricing above $1600) could emerge from
sustained macro fear/equity volatility and inflation risks. Overweight (BUT *theres an inbred resilience for US equities to bounce,
increasing) Gold investor positioning showcases that its earning some respect regardless of negative news cycle/developments
across broader markets given the rethink around negatively yielding debt
** due to the Fed seeking “sustained inflation”, expansionary
which ultimately undermines their safe haven appeal; contrary to consensus,
fiscal policies to appease large scale social unrest globally and
Gold positioning is underweight (on the basis of its share in equity portfolios).
the cost push from ESG, decarbonization policies &
2020 will be another defining year for Gold, as the increasing frequency of
protectionist policies/tariffs
“off-calendar” geopolitical events, US politics and slower growth simply lifts
the Gold floor.
25Outlook for Silver
Silver Outlook: Fundamentally oversupplied but attractive as a cheap high beta Gold proxy
Silver remains very inexpensive vs Gold, despite putting in 15% gains
in 2019 as geopolitical uncertainty, growth fears and a dovish Fed
pause boosted the appeal of precious as an asset class. Silvers 2019
gains, despite weak fundamentals, confirms that it is still a precious
metal, and can play a role as a currency hedge or quality asset, as well
as provide relatively cheap optionality on further Gold upside
Structurally, Silver remains oversupplied due both to a mix of primary
& by-product production and a buildup of known (to record highs of
380m oz) and unknown inventories. Thus despite the recent shrinking
in fundamental surpluses since 2014, this has not materially tightened
the market (rather the contrary).
After 4 years of consecutive production losses, supply will continue to
fall in 2019 (declines in South America and Oceania were offset by
European and North American production increases). But Silvers
inherent by-product nature – the difficulty in timely self-regulating
supply – is expected to play out and hamper any major price
improvements in 2020. Primary production is expected to begin
improving in 2020 from Australia, the US & Mexico, driven by an
increase in by-product output from gold and zinc/lead operations;
the higher Gold climbs, the more the Silver fundamental picture
softens.
Industrial demand should increase modestly aligned with the mini
recovery expected in global growth, but this wont be sufficient to
offset supply increases with another (fundamental) surplus expected
in 2020.
27Investor demand: strong inflows that can extend on EM outperformance
• Silver investors added a chunky 543m oz of silver to HEAT MAP: Net investor monthly flows (net Global ETFs + net COT length), mn oz
either ETFs or COT since the US/China trade deal December
2019
18
2018
141
2017
-253
2016
-16
2015
2
collapsed in the early summer, bringing total investor November -8 -5 4 -3 -206
holdings to ~870m oz, near historical highs. The total October -10 70 -9 -136 193
September -46 -14 22 32 23
accumulation of Silver in FY 2019 (200m oz) matched August 6 -129 167 -46 57
record inflows seen in 2016, a year in which July 262 -117 -93 70 -45
performances were similar. June 322 63 -107 101 -195
May -113 19 -162 -70 127
April -127 123 33 118 -74
March -157 -30 -34 4 32
February 31 -159 94 146 -92
• This peak length does provide short-term downside January 155 125 71 69 115
risk for prices, especially on muted Silver rallies. But Source: Scotiabank Commodities Strategy, CFTC
similar to the thinking in Gold, Silver investor
holdings represent only 0.34% seen in 2011. That argues for
some upside risk in Silver if theres continued cyclical
repricing in risk assets and/or EM outperformance
where investors scout for cheap and
underperforming precious exposure/Gold proxies.
• Retail interest (coin sales) in the US remain muted,
and unless December posts strong gains of over 20%,
2019 will be the 4th consecutive year of declining
demand. However, this trend could reverse into
election year; historically, retail/coin demand for
Silver (especially) over Gold is given a boost in the
election cycle.
282020 Short-Term Outlook & factors required for upside/downside pricing
Availability risk: low Price risk: high (contingent on Gold)
• Bullish case & upside risk (~$23/oz) dependent on 1)
Base case: Average price: $19 (50%) Gold outperformance, 2) inflation and reflation risks, 3)
fresh real demand drivers in medium term* (30%)
Silver range: $17.50 - $21 /oz is the new fair & more “aligned”
range (vs Gold above $1500/oz). • Bearish case & downside risk (~$15/oz): The steady
emergence of supply (due to higher gold prices),
Silver remains very inexpensive vs Gold, despite 15% gains in 2019 opportunistic hedging and growing fundamental
as geopolitical uncertainty, growth fears and a dovish Fed pause surpluses in the face of weakening global demand (20%)
boosted the appeal of ALL precious metals. The structurally large
physical overhang, and a mini- manufacturing-recession ensured
any Silver outperformance (vs Gold) remained short-lived; that
performance trend should continue into 2020 with another
fundamental surplus expected.
While the bottoming out in manufacturing PMIs should provide
tailwinds to industrial demand in 2020, multiple years of sustained
fundamental deficits are required for record known inventories
(~380m oz) to be drawn down and prices to outperform. Its
inherent by-product nature (the difficulty in self-regulating supply)
complicates that since the higher Gold climbs, the more the Silver
fundamental picture softens.
Silvers attraction is, however, through a tactical lens – it’s a cheap
high beta Gold proxy for investors in the short-term, its still partly a
precious metal that has proven itself as a currency, interest rate or
equity inflation hedge. Its best friend is gold strength not
fundamentals.
Probability
*Potential demand drivers from known (PVs) and nascent (auto) industries: thrifting in the PV sector is slowing (more projects/capacity expansion driving increased
silver consumption) and higher silver loadings in auto sector as vehicles become more sophisticated
29Outlook for PGMs
PGM Outlook: Sister metals but not fundamentally similar
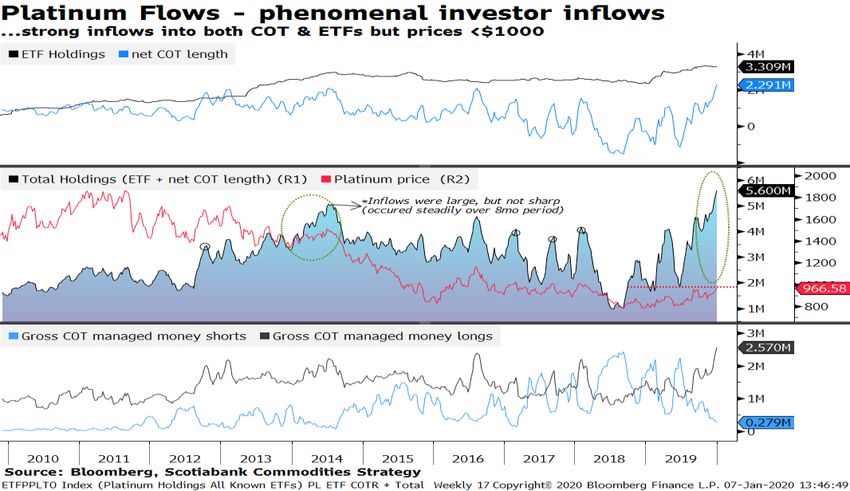
31Platinum Outlook: fundamentally neutral but floors are in
• Platinum prices rose 21% in 2019 and performance
slightly outpaced Gold for the first time since 2013, while
continuing to underperform Palladium most notably
through the widening of the Platinum-Palladium spread
to -$1050 in 2019.
• Without the stellar investor inflows in 2019, which were
contingent on the convincing Gold repricing (i.e..: a macro
story not a platinum specific fundamental or demand
growth one), Platinum prices would’ve underperformed
even more so versus its sisters.
• Platinum's 2019 revival was due to Golds statement
repricing on the escalating trade dispute and Fed
entering a cycle of rate cuts. The combined 3.4m oz
accumulated by investors (+2.5m oz of COT & +935K oz of
ETFs), is its strongest year of inflows on record and
should have been worth a larger price reaction. That
clearly indicates a structurally oversupplied fundamental
profile
32Platinum Outlook: fundamentally neutral but floors are in
• Prices have remained historically low and dormant for 6
years and counting, as a number of factors drove relative
weakness (vs other PGMs) in 2019 such as:
Falling-to-flat diesel market share in Europe (share has
fallen to ~30% in 2019 from 45% in 2017) especially in LDD
Subdued Chinese jewelry demand falling for 5 consecutive
years due to weakened consumer sentiment and trade
war, with no bottom convincingly predicted
Some mild ZAR depreciation but more so stellar byproduct
(Palladium & Rhodium) outperformance, which has
bolstered S.A producer margins and delayed expected and
warranted (Platinum) production cuts
S.A platinum exports surged in 2019, while a pay-deal
between SA producers and AMCu (after 4 months of
negotiations) was uncharacteristically stable and
professional, lowering any future supply-side risk and
premium from markets
The retreat in substitution talk in 2H’2019 (with markets
demanding a some firm/official confirmation from an
OEM) in lieu of auto rhetoric shifting to EV plans, potential
auto tariffs and navigating a Chinese sales slowdown
The discredit caused by the lack of sustained price reaction
(prices capped at $1000 throughout 2019) in light of
exceptional investor inflows of +3.4m oz. As an example: In
2013-14, 2.4m oz was accumulated over a longer period
which resulted in Platinum shifting from a $40 discount to
Gold, to a $220 premium.
33Platinum Outlook: fundamentally neutral but floors are in
• Platinum fundamental surplus (excluding investment demand!) likely Availability risk: low
peaked in 2019, with SA supply declines and rebound in auto demand
Price risk: medium (contingent on Gold)
likely in the next 2 years. SA supply is expected to decline due to a
worsening Eskom crisis (with frequent loadshedding/outages) and the
closures of loss-making shafts (as unit costs increase on power cuts 2020 average price forecast: $1000/oz
and labor); a rebound in auto demand should be driven by LDD in High: $1120/oz
China, developing nations & North America (barring a ‘carmageddon’ Low: $850/oz
similar to the one witnessed in China), some ‘substitution’ in Europe
and HDD demand globally.
• Tactical rallies — which are increasingly outsized given the disconnect
between strong investor inflows versus market size, in large part due to
continued availability of liquidity and lower rates— will continue to
exist in 2020, especially on (expected) Gold rallies.
• However, above ground stocks, weak jewelry demand and producer-
related flows (due to buoyant Rand PGM Basket prices) ensure these
rallies remain structurally capped.
• Seasonal Q1 strength is an up-coming upside price risk, but the next
bull run in the medium term is unlikely unless clues in physical
indicators emerge and/or theres a demand-side catalyst (outside of
being a cheap proxy for gold/precious exposure) from an OEM on
substitution. Supply side risk (Eskom) will continue to have a relatively
limited impact on Platinum unless physical indicators tighten.
• European diesel market share continued declines in in 2019, but in the
leading & larger German market, the share has recently increased as
manufacturers prepare for CO2 limits from 2021; that is a first early
sign of demand emerging and is expected to provide critical support
and tailwinds into 2021.
• Platinum is simply ‘high-beta gold’ with an opportunistic risk-reward
profile on any upside European data & growth surprises; it should reset
higher above $1000 somewhat reflective of parabolic rises in its peers
prices
34Palladium Outlook: fundamentally bullish but less so vs 2019
• Palladium put in solid gains of 54% in 2019, matching its
strong performance in 2017 (but still less than the >100%
gains seen in 2010). This sustained strength in 2019,
unquestionably the best performing (listed) metal since
2010, clearly highlights structural deficits and under
hedged market participants, due to the complexity of
catalyst technologies and emission regulations.
• The rise in auto loadings in 2019 due to stricter emission
regulations (led by China 6 emissions standards driving
an expected ~30% rise in metal loadings) has
overwhelmed supply. Chinas “car crash” in 2019, while
prices remained in tireless price uptrends, proved that
the complexity of catalyst technologies and emission
regulations is real, where changes are occurring faster
than supply responses.
• Investor flows were ‘kind’ in 2019, by essentially
delivering metal back to market, to supply the structural
shortages; they sold a total of 110k oz, all driven by ETFs
(whereas COT flows have remained rather range bound
at 1.2m oz, ~50% of peak holdings seen in 2017/18).
Speculators are not the main culprit driving upside price
action where exchange limits and lack of liquidity are also
a deterrent.
35Palladium Outlook: fundamentally bullish but less so vs 2019
• These investor outflows, unlike instances across other
precious metals, injected price rises, reaffirming beliefs
that (unknown) above ground stocks are out (at least at
current prices). Overall, despite the recent ETF
accumulation of ~54K oz in 2H’19, known visible stocks
(Comex + ETF holdings) of 664K oz could run out in ~88
days given the unwind rate the past 3years.
• The relatively fundamentally tighter PGMS – Rhodium
and Palladium – showed that they were unusually more
sensitive to any supply-side risk stemming from either
wage negotiations (2H’19) or the ongoing power crisis
(Eskom loadshedding Q4’19).
• While S.A labor risk is somewhat reduced in 2020 (given
the 3 year pay deal struck between Amcu and producers
in 2019), the unexpected, frequent and rather stringent
(stage 6) power cuts in December –Jan 2019, is a clear
and growing risk for 2020. The system continues to be
vulnerable, where loadshedding could be implemented
at short notice, which will upend consumer buying
trends, impact production and thus prices.
36Palladium Outlook: bullish but less so vs 2019
• The market balance is due to marginally shrink in 2020 Availability risk: high
but remains in a structural deficit for the foreseeable Price risk: high
medium term at a time when above ground stocks are
minimal. 2020 average price forecast: $2150/oz
• Supply-side adjustments (increases in primary supply High: $2300/oz
and/or of scrap) is currently not occurring fast enough Low: $1800/oz
to offset the increase in auto demand, due to the rise in
loadings. S.A supply should mildly contract over the
next few years, while Russian production (due to new
projects, improvements in efficiencies) only has a
material impact in 2021; NA growth is strong but
insufficient at current consumption rate. The risk for a
larger response in scrap continues to grow given surging
prices.
• Rhodium has broken up and out serving as a bullish
reminder and could drive potential substitution (of 5-6x
palladium for 1 part rhodium) in gasoline vehicles.
There’ll thus be a continued affinity for prices to bust
into a new higher ranges, but major and painful
intermittent price flush outs and unusually volatile
forward rates still remain a key feature for 2020.
• Palladiums largest downside risk stems from the
macroeconomic backdrop – the later the business cycle
extends, the larger the subsequent risk to US auto sales
(arguably the dominating tipping point for pricing).
Palladium prices are very susceptible to risk asset
trends and deficits simply can’t persist in an (auto)
recession across both major markets (the US and
China).
37Legal Notices
Commodities Strategists are not research analysts, and this report was not reviewed by the Research Departments of Scotiabank, nor prepared in accordance with legal
requirements designed to promote the independence of investment research. Commodities Strategist publications are not research reports and should be considered for
regulatory purposes as marketing communications. The views expressed by Commodities Strategists in this and other reports may differ from the views expressed by
other departments, including the Research Department, of Scotiabank.
The information contained in the confidential presentation (the “Presentation”) is proprietary and may not be copied, excerpted or otherwise reproduced and may not be
distributed, transmitted, disseminated or otherwise made available to any other person or entity without the prior written consent of The Bank of Nova Scotia or its affiliates
(collectively, “Scotia”). The information contained in this Presentation is indicative only and is subject to change without notice. Information other than indicative terms
(including market data and statistical information) has been obtained from various sources. We do not represent that it is complete or accurate. Any analysis presented herein
that indicates a range of outcomes that may result from changes in market parameters, is not comprehensive, is not intended to suggest that outcome is more likely than
another and may have been derived using proprietary models developed by Scotia, historic data and subjective interpretation. Nothing in this Presentation shall be construed
as constituting an offer or an agreement, or a solicitation of an offer or an agreement, to enter into any transaction. No assurance is given that any transaction on the terms
indicated in this Presentation can or will be arranged or agreed. Transactions of the sort described herein contain complex characteristics and risk factors. Transactions
incorporating derivatives may create additional risks and exposures. Before entering into any transaction, you should consider the suitability of the transaction to your
particular circumstances and independently review (with your professional advisers as necessary) the specific financial risks as well as the legal, regulatory, credit, tax and
accounting consequences. Scotia does not act as an adviser or fiduciary to its counterparties or their clients and takes no responsibility for assessing the suitability of this
product for you except where written agreement expressly provides otherwise. Nothing in the Presentation shall be construed as constituting legal, business or tax advice by
Scotia to any person or entity. Scotia, its respective officers, directors, partners and employees, including persons involved in the preparation or issuance of this Presentation,
may from time to time (1) have banking or other commercial relationships with the with the issuers of the products contemplated by this Presentation or the issuers of the
investments, securities or related derivatives underlying such products, (2) may engage in proprietary trading in the products contemplated by this Presentation or the
investments, securities or related derivatives underlying such products, (3) perform services in connection with or be an issuer of the products contemplated herein, and (4)
engage in transactions similar to those contemplated by this Presentation with other market participants, all or some of which may negatively impact or reduce the return
expected or anticipated by you in connection with the products or transactions contemplated hereby.
TM Trademarks of The Bank of Nova Scotia Used under license, where applicable Scotiabank, together with “Global Banking and Markets”, is a marketing name for the global
corporate and investment banking and capital markets businesses of The Bank of Nova Scotia and certain of its affiliates in the countries where they operate, including Scotia
Capital Inc, Scotia Capital (USA) Inc, Scotiabank Europe plc; Scotiabank (Ireland) Limited; Scotiabank Inverlat SA, Institución de Banca Múltiple, Scotia Inverlat Casa de Bolsa SA de
CV, Scotia Inverlat Derivados SA de CV, Scotiabank Colombia SA, Scotiabank Brasil SA Banco Multiplo – all members of the Scotiabank group and authorized users of the mark
The Bank of Nova Scotia is incorporated in Canada with limited liability Scotia Capital Inc is a Member of the Canadian Investor Protection Fund Scotia Capital (USA) Inc is a
registered broker-dealer with the SEC and is a member of FINRA, the NYSE and SIPC The Bank of Nova Scotia, Scotiabank Europe plc, and Scotia Capital Inc are each authorized
and regulated by the Financial Services Authority (FSA) in the UK Scotiabank Inverlat, SA, Scotia Inverlat Casa de Bolsa, SA de CV, and Scotia Derivados, SA de CV, are each
authorized and regulated by the Mexican financial authorities Activities are subject to the local law The products and services described herein may not be available in all
jurisdictions, and are offered by different legal entities authorized to use the SCOTIABANK trademark.
The ScotiaMocatta trademark is used in association with the precious and base metals businesses of The Bank of Nova Scotia The Scotia Waterous trademark is used in
association with the oil and gas M&A advisory businesses of The Bank of Nova Scotia and some of its subsidiaries, including Scotia Waterous Inc, Scotia Waterous (USA) Inc,
Scotia Waterous (UK) Limited and Scotia Capital Inc - all members of the Scotiabank group and authorized users of the mark.
Scotia Capital Inc owns or controls an equity interest in the TMX Group Limited (TMX) and has a nominee director serving on its board As such, Scotia Capital Inc may be
considered to have an economic interest in the listing of securities on an exchange owned or operated by TMX, including the Toronto Stock Exchange, the TSX Venture Exchange
and the Alpha Exchange (each, an Exchange) No person or company is required to obtain products or services from TMX or its affiliates as a condition of Scotia Capital Inc
supplying or continuing to supply a product or service Scotia Capital Inc does not require issuers or selling shareholders to list securities on any of the Exchanges as a condition of
supplying or continuing to supply underwriting and/or any other services.
38You can also read