Updated projections for COVID-19 omicron wave in Florida
←
→
Page content transcription
If your browser does not render page correctly, please read the page content below

Updated projections for COVID-19 omicron wave in Florida
              Thomas J. Hladish1,2             Alexander N. Pillai1            Ira M. Longini2,3
                             1
                             Department of Biology, University of Florida
                         2
                         Emerging Pathogens Institute, University of Florida
                         3
                           Department of Biostatistics, University of Florida
                   Correspondence: tjhladish {at} ufl.edu and ilongini {at} ufl.edu
                                               January 4, 2022

Key findings
  • Because of the significant growth in reported COVID-19 cases due to omicron SARS-CoV-2 during December
    2021, we have revised our model projections.
  • We find that the omicron wave in Florida is likely to cause many more infections than occurred during the
    delta wave, potentially infecting most of the state’s population in this wave alone.

  • Preliminary data suggest that omicron infections may be less severe than those caused by delta, particularly
    among vaccinated people. This means that despite causing more infections, it is possible that substantially
    fewer deaths will result from the omicron wave. We estimate that omicron will cause 1/3 as many deaths as
    were caused by delta.

  • Due to limitations in testing capacity, milder infections in vaccinees, and reduced sensitivity of some tests to
    the omicron variant, we believe that a smaller fraction of omicron infections will be detected as cases compared
    to previous waves.
  • We expect reported cases to peak in the first half of January 2022.
  • Preliminary data suggest that boosting may dramatically increase protection against disease caused by omicron
    infections [1]. We therefore recommend eligible people receive boosters as soon as possible.
  • Absenteeism among infected health care workers combined with a rapidly increasing number of COVID-19
    patients may substantially strain the health care system. This may be particularly serious for pediatrics, as
    children under 5 are not eligible for vaccination and may be more likely to experience severe omicron infections
    than adults [2]. We recommend particular care be taken to protect young children from exposure to the omicron
    variant.

                                                        1
Introduction
   The first known case of the omicron variant of concern (VOC) of SARS-CoV-2 in Florida was reported on
December 7, 2021 [3]. Since mid December, Florida has experienced extremely rapid spread of the omicron variant.
For this report, we have revised our transmission model to include a shorter time from infection to becoming infectious
(the latent period ) for omicron compared to previous variants [4]. Coupled with being highly infectious relative to
the delta variant, even among vaccinated people, assuming a shorter latent period allows our model to reproduce the
rapid spread of omicron that has been observed. Important omicron-specific parameters are summarized in Table 1.

                                Parameter                           Assumed value
                                Relative   transmission advantage           2.0
                                Relative   severity                        0.25
                                Relative   latent period                    0.5
                                Immune     escape probability              60%

        Table 1: Omicron parameter assumptions. Relative values are in comparison to the delta variant.

    We calculate omicron’s transmission advantage as the ratio of the basic reproduction numbers of omicron and
delta (i.e., R0o /R0δ ). Omicron’s immune escape capability is modeled as a reduction in the probability that existing
immune protection, whether infection- or vaccine-derived, will prevent infection. For comparison, we assume that
delta’s immune escape probability is 15%. “Severity” is the probability that a person with symptoms will develop
severe disease, a precondition we assume for hospitalization, ICU admission, or death. Similarly, we assume that
vaccine efficacy against onward transmission (V EI ) has also decreased (meaning vaccinated people are more able to
transmit omicron compared to delta—see Table 2).
    Because of how contagious omicron is, and how rapidly the omicron wave is progressing, we do not believe dynamic
changes to people’s personal-protective behaviors will play a major role in limiting transmission. Furthermore, as
the state government has not indicated a plan to substantially change policies in response to omicron, we do not
consider the possibility here.
    Booster vaccine doses may substantially increase vaccine protection against disease caused by omicron [1]. At
this time, 31.3% of Florida’s population has received a booster dose [5]. In these projections, we do not explicitly
include the effects of boosting on omicron dynamics. Nonetheless, we recommend eligible people receive boosters,
and we expect that an increase in booster uptake will result in more optimistic trajectories for the omicron wave in
Florida.

Results
    We characterize the omicron epidemic wave using several metrics (Figure 1): simulated reported cases (yellow) are
compared to empirical reported cases (black); simulated reported deaths (red) are compared to empirical reported
deaths (black); simulated viral strain prevalence over time; total simulated infections (including asymptomatic in-
fections and both reported and unreported cases); and time-varying reproduction number (Rt ) measured from the
simulation. For the forecast period (December 2021 onward), we show 100 realizations of the model, with the mean
trajectory overlaid as a bold line.

                                                          2
Figure 1: Projected reported cases, reported deaths, VOC prevalence, total infections, and reproduction number.

                                                      3
Methods
    We have developed a detailed simulation model to serve as a tool for assessing the COVID-19 epidemic in Florida.
The model is a data-driven, stochastic, discrete-time, agent based model with an explicit representation of people
and places [6]. Households in the model are sampled from census and survey data in order to establish a realistic
distribution of age, sex, comorbidity, employment and school-attendance status. Activities and interaction patterns
affect how likely someone is to be exposed in the model, and age, health status, and healthcare seeking behavior affect
how severe a person’s infection is likely to be. People go to work or school, visit friends, and patronize businesses in
the model. The simulation includes closure of non-essential businesses, reduced school attendance, and changes in
behaviors during the course of the pandemic. Our full Florida model represents 20.6 million people residing in 11.2
million households and 3.8 thousand long-term care facilities and who work in 2.3 million workplaces and attend
7.6 thousand schools. However, for this simulation study, we created a smaller, representative sample of the entire
synthetic population totalling 375,000 people. We rescale the output from the model in order to estimate the cases
and deaths for the entire state.
    During each simulated day, infectious and susceptible individuals can aggregate in households, workplaces (both
as employees and as customers), schools, long-term care facilities, and hospitals at different times in the day (Fig. 2).
When susceptible and infectious people come together at the same location, there are new opportunities for the
transmission of the virus.
    If an individual becomes infected, the progression of the infection follows an SEIRD model where people progress
through susceptible (S), exposed (E), infected (I), recovered (R), and dead (D) states. Additionally, infected
individuals can develop mild (IA ), severe (IM ), or critical (IC ) symptoms (Fig. 2. People who become ill can may
seek healthcare, resulting in that individual receiving hospital care (for severe symptoms) or ICU care (for critical
symptoms), which in turn lowers the risk of death.
    Beyond non-pharmaceutical interventions (e.g. business or school closures, social distancing, stay-at-home orders),
the model also represents vaccination of the synthetic population. In our model, we simulate a generalized mRNA
vaccine (Table. 2) that performs similarly to the BioNTech and Moderna mRNA vaccines that have been used in
Florida [7]. We simulate a rollout of vaccines that begins in January, 2021, with vaccine availability and campaign
phases reflecting the vaccine rollout that has occurred in Florida (i.e. starting with healthcare workers and older
members of the population and progressively widening eligibility to younger age groups).
    Since our last report, we have revised our model of immunity to account for new data on immune dynamics and
the effects of new variants. For vaccine-derived immunity, all people start with the same initial efficacy, whereas
infections generate variable initial protection against reinfection. Both infection- and vaccine-derived immunity is
modeled as leaky (in which every exposure has some chance of causing infection). We assume that efficacy against
susceptibility (V ES ) does not inherently wane, but does decrease due to changes in the circulating variants [8].
Efficacy against pathology (V EP ) and against severe outcomes (V EH ) remain constant over time. To calculate the
current protection an individual has against infection due to vaccination (V ES ) or infection (IES ), we use Equation 1
where ESi is the initial level of protection from either vaccination or infection, and Ω is the variant’s immune escape
probability. In Table 2, we document our modeled vaccine efficacy values given the assumption that delta is a 15%
immune escape mutant. Similar calculations are performed to determine a simulation’s V ES or IES for omicron
using immune escape assumptions.

                                                 ESV OC = ESi ∗ (1 − Ω)                                              (1)

                                                           4
Wildtype             Alpha               Delta             Omicron
                          Dose 1   Dose 2    Dose 1    Dose 2    Dose 1   Dose 2    Dose 1    Dose 2
                 V ES      0.4       0.8      0.4       0.8       0.34      0.68     0.4       0.8
                 V EP      0.67      0.75     0.67      0.75      0.67      0.75     0.67      0.75
                 V EH      0.9       1.0      0.9       1.0        0.9       1.0     0.45      0.9
                 V EI      0.4       0.8      0.4       0.8        0.4       0.8      0.2      0.4

Table 2: Vaccine efficacy (V E) values assumed in our model, based on estimates from multiple Phase III trials and
other published sources [7]. Delta V ES values assume 15% immune escape. Omicron V ES were calculated using
Equation 1 with Wildtype as V ESi and are reported above for the lower and upper immune escape assumptions in
Table 1. V EI for omicron is also assumed to decrease. Other V E parameters for omicron will match those for other
VOCs. V ES and V EP estimates have been revised since the October 08 report. Note on V E details: V ES refers to
vaccine efficacy against infection. V EP refers to vaccine efficacy against symptoms given infection. V EH refers to
vaccine efficacy against severity given symptoms. V EI refers to vaccine efficacy against onward transmission.

Figure 2: (A) Progression of the disease states in the model: susceptible (S) individuals may become exposed (E)
to the virus, then progress to being infected (initially asymptomatic [IA ], possibly progressing to mild [IM ], severe
[IS ] or critical [IC ]), and finally recovering (R) or dying (D). (B) Model locations of households and workplaces
in an urban region (Miami, FL). (C) An example household. People may contact others by socializing with other
households, by going to work or school, by going to the hospital, or by patronizing nearby businesses (not shown).
(D) Attributes of the people in this household.

                                                          5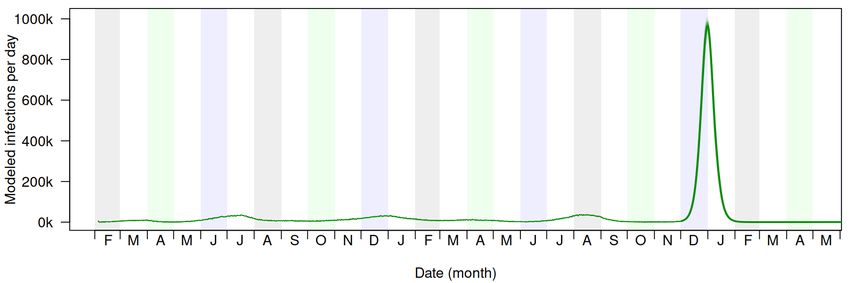
References
1.   Andrews, N. et al. Effectiveness of COVID-19 vaccines against the Omicron (B.1.1.529) variant of concern.
     medRxiv. doi:10.1101/2021.12.14.21267615 (2021).
2.   Health, D. Discovery Health, South Africa’s largest private health insurance administrator, releases at-scale,
     real-world analysis of Omicron outbreak based on 211 000 COVID-19 test results in South Africa, including
     collaboration with the South Africa https://discovery- holdings- ltd.mynewsdesk.com/pressreleases/
     discovery-health-south-africas-largest-private-health-insurance-administrator-releases-at-
     scale-real-world-analysis-of-omicron-outbreak-based-dot-dot-dot-3150697.pdf.
3.   Hodgson, I. & Mower, L. First omicron COVID cases detected in Florida, one at a Tampa VA hospital https:
     //www.tampabay.com/news/health/2021/12/07/first-omicron-cases-detected-in-florida-one-at-a-
     tampa-va-hospital/.
4.   Jansen, L. et al. Investigation of a SARS-CoV-2 B.1.1.529 (Omicron) Variant Cluster — Nebraska, Novem-
     ber–December 2021. MMWR. https : / / www . cdc . gov / mmwr / volumes / 70 / wr / mm705152e3 . htm ? s _ cid =
     mm705152e3_w (2021).
5.   CDC. COVID-19 Vaccinations in the United States https : / / covid . cdc . gov / covid - data - tracker /
     #vaccinations_vacc-people-additional-dose-totalpop.
6.   Shea, K. et al. COVID-19 reopening strategies at the county level in the face of uncertainty: Multiple Models
     for Outbreak Decision Support. medRxiv. doi:10.1101/2020.11.03.20225409. https://www.medrxiv.org/
     content/early/2020/11/05/2020.11.03.20225409 (2020).
7.   Shapiro, J. et al. Efficacy Estimates for Various COVID-19 Vaccines: What we Know from the Literature and
     Reports. en. medRxiv, 2021.05.20.21257461. doi:10.1101/2021.05.20.21257461. https://www.medrxiv.org/
     content/10.1101/2021.05.20.21257461v1 (2021) (May 2021).
8.   Rosenberg, E. S. et al. COVID-19 vaccine effectiveness in New York state. New England Journal of Medicine
     (2021).

                                                         6
You can also read