Use of Ashes from Lignite Combustion as Fillers in Rubber Mixtures to Reduce VOC Emissions
←
→
Page content transcription
If your browser does not render page correctly, please read the page content below
materials
Article
Use of Ashes from Lignite Combustion as Fillers in Rubber
Mixtures to Reduce VOC Emissions
Miroslawa Prochon * , Dariusz Bieliński                     , Paulina Stepaniak, Magdalena Makowicz, Dominik Pietrzak and
Oleksandra Dzeikala

                                          Institute of Polymer and Dye Technology, Faculty of Chemistry, Lodz University of Technology,
                                          Stefanowskiego 12/16, 90-924 Lodz, Poland; dariusz.bielinski@p.lodz.pl (D.B.); 200249@edu.p.lodz.pl (P.S.);
                                          198881@edu.p.lodz.pl (M.M.); dominik.pietrzak@p.lodz.pl (D.P.); oleksandra.dzeikala@p.lodz.pl (O.D.)
                                          * Correspondence: miroslawa.prochon@p.lodz.pl

                                          Abstract: This paper presents the use of ashes from brown coal combustion (BCA) as fillers in rubber
                                          mixtures, to reduce the emission of volatile organic compounds. Two types of ash, BCA1 and BCA2,
                                          were selected as fillers for styrene–butadiene rubber (SBR). The ashes were produced during the
                                          treatment of brown coal at the Bełchatów Power Plant in the years 2017 and 2018. The morphology
                                          and chemical composition of the ash were tested. Morphology studies using scanning microscopy
                                          showed differences in the grain sizes of the ashes, and EDS analysis showed a difference in their
                                          chemical compositions. Vulcanizates with different weight proportions of the individual ashes were
                                          produced. Mixtures were made with the addition of 10–30 pts. wt. ashes per 100 g of SBR. The
                                          addition of BCA1 ash at 10 and 30 pts. wt. reduced the emission of volatile organic compounds
                                (VOC) while maintaining the good strength properties of the mixtures.


Citation: Prochon, M.; Bieliński, D.;    Keywords: ash after lignite combustion; filler; rubber mixtures; volatile organic compounds (VOC)
Stepaniak, P.; Makowicz, M.; Pietrzak,
D.; Dzeikala, O. Use of Ashes from
Lignite Combustion as Fillers in
Rubber Mixtures to Reduce VOC             1. Introduction
Emissions. Materials 2021, 14, 4986.            During the process of coal combustion, significant amounts of by-products are formed,
https://doi.org/10.3390/ma14174986
                                          including fly ash, furnace slag, and harmful chemical compounds in the form of gases
                                          (including CO2 , NOx , and sulfur compounds) [1–7]. A large proportion of this furnace
Academic Editor: Avelino
                                          waste (ash and slag) is stored. The storage of ashes is not ideal due to the significant
Núñez-Delgado
                                          risk of atmospheric factors leading to the release of dust particles into the air. Some uses
                                          for ashes have been found. An interesting application of ashes is in the production of
Received: 17 July 2021
Accepted: 24 August 2021
                                          electrodes in lithium-ion batteries [8]. Energy waste is also used in mining (as flooring
Published: 31 August 2021
                                          components, to strengthen the rock mass) [9], agriculture (for the production of fertilizers,
                                          soil deacidification), civil engineering (for soil stabilization, construction of embankments,
Publisher’s Note: MDPI stays neutral
                                          flood sealing), and in environmental protection, where energy waste is used to neutralize
with regard to jurisdictional claims in
                                          sewage and purify exhaust gases [10].
published maps and institutional affil-         Ashes can also be used in construction, as additives in cement and concrete [11–14].
iations.                                  However, not all ashes can be exploited in this way, because their chemical composition is
                                          not in line with the relevant standards. For example, A. Michalik et al. [15] developed a
                                          method of improving the properties of fly ash as an additive for cements. However, some
                                          of the ash remains and is treated as waste. Limestone ash, after the separation of the carbon
                                          fractions and silica ash, is also used in the construction industry as a concrete mass.
Copyright: © 2021 by the authors.
Licensee MDPI, Basel, Switzerland.
                                                The possibilities of using all of an ash are quite limited, due to the problematic phase
This article is an open access article
                                          and chemical compositions of ashes, as well as their physicochemical properties. Finding
distributed under the terms and           a way to recycle ash could significantly reduce the amount of landfilled waste. The scale
conditions of the Creative Commons        of the problem can be seen in the case of the Bełchatów Power Plant (Poland), which is
Attribution (CC BY) license (https://     the largest thermal power plant in Europe. This power plant alone produces and stores
creativecommons.org/licenses/by/          approximately three million tons of ash and slag annually [14]. The ashes produced as a
4.0/).                                    result of various methods of coal combustion show significant differences in terms of their

Materials 2021, 14, 4986. https://doi.org/10.3390/ma14174986                                                https://www.mdpi.com/journal/materials
Materials 2021, 14, 4986                                                                                             2 of 18

                           phase and chemical compositions, degrees of dispersion, and particle morphologies. The
                           use of ashes in this form is difficult, requiring research to determine their specific properties
                           and identify suitable applications [6].
                                 An innovative idea may be to use ashes from brown coal combustion as fillers in elas-
                           tomeric blends. Plastics are widely used in many industries, including in the automotive
                           industry as car cabin accessories, everyday objects, interior fittings, etc., [16]. However,
                           plastics are a potential source of volatile organic compounds (VOCs), which are released
                           in the processes of degassing materials [17]. Volatile organic compounds are known to
                           adversely affect human health; they constitute about 73% of carcinogenic compounds on
                           the list of toxic compounds [18]. The highest concentrations of VOCs are recorded indoors.
                           It is estimated that adults spend about 80% of their time indoors, which puts them in
                           prolonged contact with these toxic compounds. Therefore, manufacturers should strive to
                           minimize VOC emissions both during the production process and from plastic products.
                                 Styrene–butadiene rubber (SBR) is a type of polymeric compound based on rubber
                           that is commonly used in the tire industry [19]. SBR rubber is also used as a waste material
                           for the growth of carbon nanomaterials, such as nanofibers or nanotubes. Small granules
                           of rubber are subjected to pyrolysis at a temperature of 1000 ◦ C. The pyrolysates are
                           mixed with gases containing burned SBR and oxygen. Combustion products are used
                           to synthesize carbon nanomaterials (CNMs) in the presence of catalysts. CNMs have a
                           characteristic structure of approximately 30–100 microns in diameter and 10 microns in
                           length. Due to their unique mechanical, electrical, and thermal properties, CNMs have a
                           number of potential added value applications [20].
                                 In a study by X. Ren and E. Sancaktar [21], by-products from the energy industry in the
                           form of ashes were used as a fly reinforcement, replacing typical fillers such as carbon black
                           and silica in rubbers. The partial addition of up to 10 pts. wt. of fly ash in combination
                           of 54 and 4 pts. wt. of carbon black and silica fillers, respectively, resulted in increased
                           elongation at break, better adhesion to the steel reinforcement cord, and improved wet grip.
                           Lower rolling resistance was also observed, which was attributed to the more effective
                           reinforcing effect of the silica contained in the fly ash.
                                 Here, we present a new method of using ashes as fillers for rubber mixtures. The
                           ashes were produced during combustion of lignite at the Bełchatów Power Plant in 2017
                           (BCA1] and 2018 (BCA2]. An additional aim was to reduce the emission of VOCs from the
                           mixtures produced during the vulcanization process.

                           2. Materials and Methods
                           2.1. Materials
                           2.1.1. Rubber and Other Ingredients
                                The rubber mixtures were made using SBR butadiene–styrene rubber (KER 1500,
                           Synthos S.A. Oświ˛ecim, Poland) as the matrix for each mixture. The cross-linking unit
                           included sulfur, as the cross-linking substance (S8 orthorhombic; density 2.07 g/cm3 ,
                           Siarkopol Tarnobrzeg Sp. z o.o., Tarnobrzeg, Poland), zinc oxide as the activator (zinc
                           white, ZnO, Huta B˛edzin, Poland), and CBS (Bestgum Polska Sp.z o.o., Rogowiec, Poland)
                           as the accelerator.

                           2.1.2. Ash after Burning Brown Coal (BCA)
                                 Technical carbon black N330 (75 × 103 m2 /kg, Fermintrade, Konin, Poland) and ash
                           from Elektrownia Bełchatów (PGE Górnictwo i Energetyka Konwencjonalna SA, Elek-
                           trownia Bełchatów, Poland) produced in 2017 (BCA1) and 2018 (BCA2) were used as the
                           fillers. The mixtures also included technical stearin (Torimex-Chemicals Ltd. Sp.z o.o.,
                           Konstantynów Łódzki, Poland).

                           2.2. Preparation of Composites
                                After the preparation step (see Section 2.1.2), the BCA filler was introduced at different
                           pts. wt. into the SBR. The rubber mixtures were prepared using a mixing mill (Bridge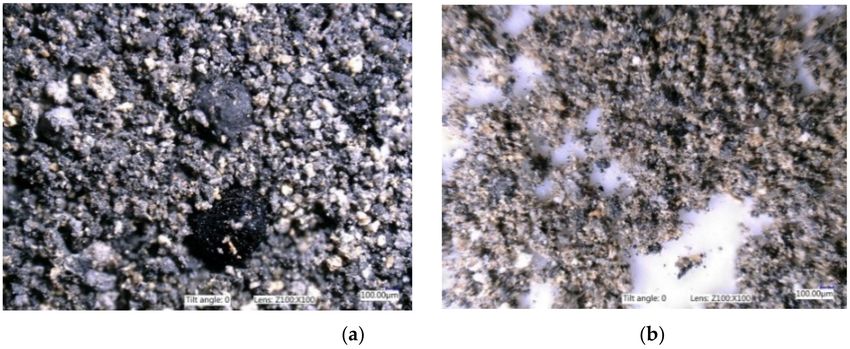
Materials 2021, 14, 4986                                                                                                   3 of 18

                                  mill, London, UK) with a roller temperature of 27–37 ◦ C and a friction/friction of 1.1. The
                                  rolling mill parameters were as follows: roll length L = 450 mm; roll diameter D = 200 mm;
                                  rotational speed of the front roller Vp = 20 (rpm); width of the gap between rollers 1.5–3 mm.
                                  The mixtures were prepared for 6 min and then wrapped in foil and stored at 2–6 ◦ C. Table 1
                                  compares the tested rubber mixtures. The mixtures were made with carbon black N330 or
                                  a mixture of carbon black with 10, 20, and 30 pts. wt. ashes. Tests were carried out at room
                                  temperature under normal pressure conditions.

                                             Table 1. Compositions of the elastomer blends.

       Symbol              SBR   SBR1 (10)         SBR1 (20)        SBR1 (30)        SBR2 (10)    SBR2 (20)       SBR2 (30)
     SBR [phr]                                                              100
    BCA1 [phr]             0        10                20               30                0            0                0
    BCA2 [phr]             0         0                0                 0               10           20               30
    N330 [phr]             50       40                30               20               40           30               20
   Stearin [phr]                                                             1
    ZnO [phr]                                                                3
     CBS [phr]                                                               1
   Sulphur [phr]                                                             2

                                  3. Research Techniques
                                  3.1. Researching Ashes
                                       To determine the structure of the ashes, microscopic pictures were taken using a
                                  Keyence VHX 1000 optical microscope (Keyence International, Mechelen, Belgium). To
                                  determine the share of particles of a given size in the tested ashes, a sieve analysis was
                                  performed. For this purpose, an AS200Control device (Retsch GMBH, Haan, Germany)
                                  with EasySieve software (Retsch GMBH, Haan, Germany) was used, consisting of eight
                                  sieves with decreasing mesh sizes: 4.00 mm; 2.00 mm; 1.00 mm; 0.50 mm; 0.25 mm;
                                  0.125 mm; 0.063 mm; 0.045 mm. The measurements lasted 3 min, during which the
                                  computer program processed the results from the testing device.

                                  3.2. Making Mixtures
                                        The ingredients were mixed together in the following order: rubber → ZnO → stearin
                                  → soot → CBS → sulfur. A rolling mill (Bridge type milling machine, London, UK) was
                                  used with a roll length of 150–300 mm, temperature 30 ◦ C, rotational speed 15–13 rpm.
                                  The cross-linking kinetics of the SBR compounds were tested using an ALPHA MDR 200
                                  rheometer with a moving nozzle (MonTech MDR 300, Buchen, Germany) at a temperature
                                  of 160 ◦ C for 30 min, in accordance with PN-ISO 3417:1994. Hardening (τ90) was performed
                                  in a standard electrically heated hydraulic press (PH-2PW90, ZUP Nysa Sp. z o.o. Nysa,
                                  Poska) at a temperature of 160 ◦ C, pressure 32 MPa, dimensions of heating plates 400 mm
                                  × 400 mm. After vulcanization, the samples were prepared for strength tests in accordance
                                  with the PN-EN ISO 3167:2014-09 standard. Paddle-shaped samples were cut out using a
                                  ZCP020 press (Zwick/Roell GmbH & Co. KG., Ulm, Germany).
                                        The mechanical properties of the prepared composites were tested on a universal
                                  testing machine Zwick model 1435 (Zwick/Roell, Radeberg, Germany), in accordance with
                                  the PN-ISO 37:2007 standard. Paddle-shaped samples were subjected to stretching at room
                                  temperature at a constant speed of 500 mm/min and with a preforce of 0.3 N. The tensile
                                  strength (TSb) and the percentage elongation at break (Eb ) were determined. A hardness
                                  test (H, ◦ Sh) was performed using an electronic Shore A hardness tester (Zwick/Roell,
                                  Herefordshire, UK) with a pressing force of 12.5 Nz, in accordance with PN-80C-04238 [22].
                                        The polymer–solvent interaction parameter was determined by the equilibrium
                                  swelling method according to PN ISO 1817:2001/ap1:2002 [23] (0.378 for SBR rubber in a
                                  toluene solvent). Samples were then allowed to evaporate in air for 72 h and reweighed.
                                        Cross-link density was calculated as the volume fraction of rubber in the swollen mate-
                                  rial, and vs. = 106.3 mol/cm3 for the molar volume of the solvent (toluene) solvent [24,25].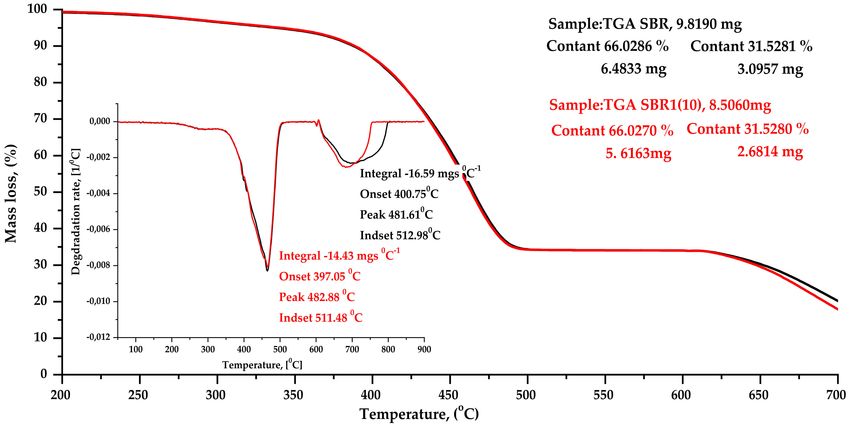
Materials 2021, 14, 4986                                                                                             4 of 18

                                Cross-link density (υ), was calculated on the basis of the Flory–Rehner equation:

                                                                 ln(1 − Vr ) + Vr + µVr3
                                                            v=          1                                             (1)
                                                                            3   Vr
                                                                     V0 Vr − 2

                           where µ is the Huggins parameter for the uncrosslinked polymer–solvent system and Vr is
                           the molar volume of the swelling solvent.
                                Rheological tests were performed using a rotational rheometer (ARES-G2 TA Instru-
                           ments, New Castle, DE, USA). Stress measurements were performed regardless of the
                           applied shear deformation, with a torque range from 0.05 µNm to 200 mNm, force range
                           of 0.001–20 N, temperature range from −150 ◦ C to +600 ◦ C, cooling with liquid nitrogen,
                           DETA module for dielectric measurements.
                                To test the effect of elevated temperature, the samples were placed in a thermal
                           chamber (Binder GmbH, Tuttlingen, Germany) at 70 ◦ C for 7 days. Three mixtures were
                           selected and subjected to 30-day biological aging in soil. The soil samples were placed
                           in a MEMMERT climate chamber (HPP 108 Memmert GmbH, Schwabach, Germany)
                           for 14 days at 30 ◦ C and 80% air humidity. The aged samples were then subjected to
                           strength tests. The results were compared with those for samples that had not been aged.
                           Examination of the surface morphology of the rubber mixtures was carried out using a Zeiss
                           Ultra Plus scanning electron microscope (ZEISS, Carl Zeiss AG, Oberkochen Germany).
                           A Nicolet 6700 FTIR spectroscope (Thermo Scientific, Waltham, MA, USA) with Fourier
                           transform was used to analyze the chemical bonds present in the ashes and the obtained
                           vulcanizates, using the total internal reflection method with the attenuated total reflection
                           (ATR) attachment. Measurements were carried out in the range of 400–4000 cm−1 for the
                           ashes and three selected vulcanizates.
                                The VOCs were studied using ion mobility spectroscopy with gas chromatography,
                           during vulcanization in a tightly closed reactor. The heating time of the mixture at 160 ◦ C
                           was 2 × t90 (two times optimum cure time) in order to be sure that the vulcanization
                           occured. The collected gases were diluted and sent to an MCC-IMS instrument (G.A.S.
                           Gesellschaft für Analytische Sensorsysteme GmbH, Dortmund, Germany). Tests were
                           carried out for a mixture without the addition of ash and for two mixtures with CBS1 ash
                           (addition of 10 or 30 pts. wt. ash). Thermal analysis by differential scanning calorimetry
                           (DSC) was carried out in order to determine the glass transition temperature (Tg) of
                           the selected vulcanizates. The tests were carried out using a DSC1 analyzer (Mettler
                           Toledo, Netzsch, Switzerland) calibrated with standards (indium, zinc) at a heating rate
                           of 10 ◦ C/min. The SBR samples were heated from −150 ◦ C to 350 ◦ C under nitrogen
                           atmosphere.

                           4. Results and Discussion
                           4.1. Characterization of BCA
                                It is known that the shape, particle size, and specific surface of a filler have a decisive
                           influence on the strength of rubber–filler connections. Ash morphology was assessed
                           on the basis of photographs taken with an optical microscope, shown in Figure 1. The
                           ash agglomerates are visible as irregularly structured spherical particles, with a wide
                           size distribution from several hundred nanometers to several micrometers. The grains in
                           the BCA2 ash are much finer. The older ash contained larger particles with greater size
                           variation.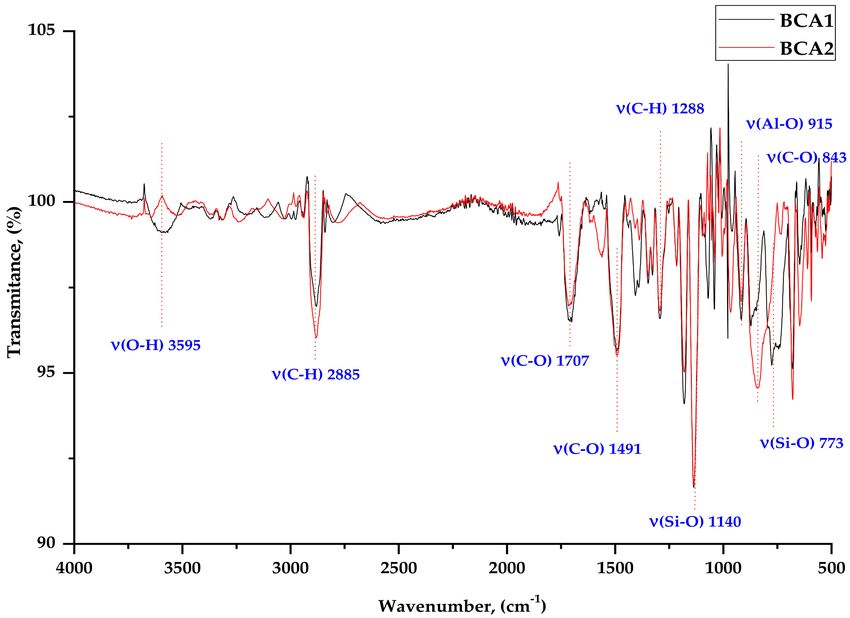
Materials 2021, 14, 4986                                                                                                            5 of 18

                           Figure 1. Images of BCA magnification ×1.00: (a) ash BCA1 and (b) ash BCA2.

                               Table 2 shows that the largest share of BCA1 ash (74.7%) was between 63–250 µm,
                           whereas BCA2 ash contained mostly fractions below 45–250 µm (76.9%).

                           Table 2. Ash sieve analysis BCA1 and BCA2.

                                                               BCA1                                            BCA2
                             Size Class
                                               ∆p [%]        q3 %[µm]         ∆m [g]          ∆p [%]         q3 %[µm]         ∆m [g]
                                [µm]
                                4000             0.1            0.00            0.05             0.0            0.00            0.00
                           Legend: ∆p—percentage distribution of the fraction share (%); q3 %—density of the grain class distribution (µm);
                           ∆m—particle mass distribution (g).

                           4.2. Characterization of SBR/BCA Composites
                           4.2.1. Vulcanization Kinetics
                                 Rheometric measurements were used to determine the vulcanization time and the
                           increase in the torsional moment ∆M. The results are presented in Table 3. The BCA fillers
                           clearly influenced the cross-linking properties of the SBR blends. The kinetic parameters of
                           the BCA-containing compounds were different from those of the blank compound. The
                           addition of ash to the SBR compound resulted in lower viscosity and stiffness, which
                           is reflected in the torque value (ML). The increase in torque decreases as the weight
                           fraction of ash increases, leading to a visible deterioration of the mechanical parameters of
                           vulcanizates. The unfilled sample showed a longer cure time than the filled composites.

                           Table 3. Influence of BCA on the rheometric properties of SBR compounds.

                                    Symbol                    ML [dNm]                    ∆M [dNm]                     τ90 [min]
                                     SBR                          2.22                       18.12                       11.35
                                   SBR1 (10)                      1.90                       17.11                        9.67
                                   SBR1 (20)                      1.25                       12.82                       10.84
                                   SBR1 (30)                      1.37                       12.68                       12.99
                                   SBR2 (10)                      1.53                       13.40                       11.08
                                   SBR2 (20)                      1.52                       13.03                       11.36
                                   SBR2 (30)                      1.48                       12.72                       12.06
                           LL—minimum torque moment (dNm); ∆L—the decrease of torque moment (dNm) (∆L = LHR—LL); τ02 —scorch
                           time (min); τ90 —time of vulcanization (min).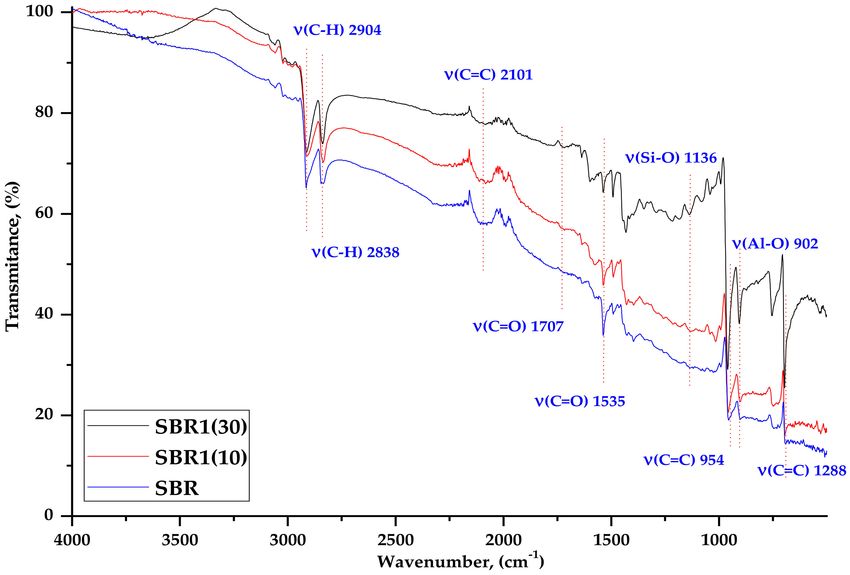
Materials
Materials 2021,
2021, 14, 4986 6 6ofof20
18
Table 3. Influence of BCA on the rheometric properties of SBR compounds. 210
The vulcanization times increased with increasing BCA1 concentrations, reaching
theSymbol
highest value at 30 phr (τ90M=L [dNm]
12.99). Subsequent ∆M [dNm]
studies τ90 [min]
clearly showed that the
ashSBR
belongs to the group of inactive 2.22fillers, with lower increases
18.12 of turbulent 11.35
moments
for the composition with the same content compared to the noninvasive composite. As a
SBR1(10) 1.90 17.11 9.67
consequence, it leads to a visible deterioration of the mechanical parameters of vulcanizates.
SBR1(20) 1.25 12.82 10.84
4.2.2. Rheological Analysis
SBR1(30) 1.37 12.68 12.99
Rheological analysis is applicable to all materials with visco-elastic properties and
SBR2(10)the relationship between 1.53
describes forces and deformation 13.40 as a function of time.11.08
Figure 2
shows the
SBR2(20) dependence of changes in
1.52stress viscosity on the shear
13.03 rate for individual
11.36 SBR
elastomer composites filled with ash. The dynamic viscosity values changed as a result of
SBR2(30) 1.48 12.72 12.06
introducing ash fillers into the SBR rubber matrix. Irrespective of the type of ash used, the
shear modulus torque
LL—minimum decreased as the
moment proportion
(dNm); ∆L—the of the introduced
decrease filler was
of torque moment increased
(dNm) from
(∆L = LHR - 10 211
LL); τ —scorch time (min); τ —time of vulcanization (min).
to 20 pts. wt. This correlates with the rheometric properties (Section 4.2.1).
02 90 212
The use of the ash as a filler changed the viscosity of the composites. The dynamic
Theofvulcanization
viscosity the mixtures wastimes increased
almost withofincreasing
half that the pure SBRBCA1 concentrations,
sample, which mayreaching
suggest 213
the highest value at 30 phr (τ 90 = 12.99). Subsequent studies clearly showed that the ash
the formation of connections between the mineral filler and the SBR matrix, creating a 214
belongs to
secondary the group
structure of inactive
containing mineral fillers, withassociated
particles lower increases
with theof turbulentcomponents
remaining moments 215
offor
thethe composition
mixtures. with the
As reported samethis
in [26], content
may becompared
caused bytochanges
the noninvasive composite.
in deformation caused 216
As a consequence, it leads to a visible deterioration of the mechanical
by the material microstructure, i.e., increased susceptibility to cracking and thus reduced parameters 217
of vulcanizates.
hardness, as well as the formation of weak physical interactions connecting adjacent filler 218
4.2.2. Rheological analysis
clusters. 219
G′ (kPa)
tan δ (−)
η* (kPaˑs)
(a)
Figure 2. Cont.
Materials
Materials    2021,
          2021, 14, 4986                                   7 7of
                                                               of 20
                                                                  18

                           G′ (kPa)

                                                           tan δ (−)
                           η* (kPaˑs)

                                                     (b)
                                 G′ (kPa)

                                                               tan δ (−)
                                        η* (kPaˑs)

                                                     (c)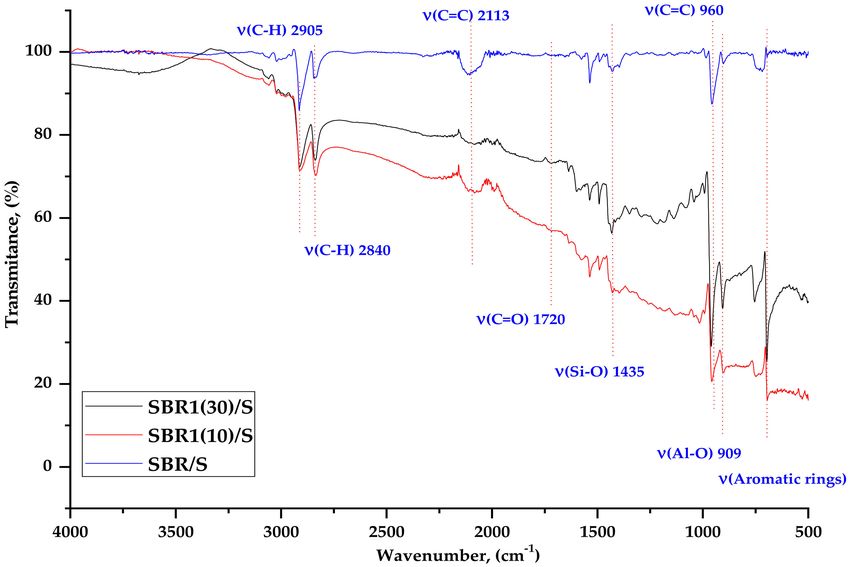
Materials 2021, 14, 4986                                                                                                          8 of 18
 Materials 2021,                                                                                                                8 of 20

                            G′ (kPa)

                                                                                                                                  tan δ (−)
                                 η* (kPaˑs)

                                                                             (d)
                            G′ (kPa)

                                                                                                                                   tan δ (−)
                              η* (kPaˑs)

                                                                              (e)

                           Figure 2. Dependence of viscosity and stress on the shear rate of the composites: (a) SBR; (b) SBR1
                           (10);
                            Figure(c) SBR2  (10); (d) SBR1
                                      2. Dependence          (20); (e) SBR2
                                                        of viscosity         (20). Sapphire
                                                                       and stress              curverate
                                                                                     on the shear    —complex     viscosity η* (kPa’s)
                                                                                                          of the composites:    (a) SBR;at     220
                            (b)◦ C
                           80    SBR1  (10); (c) SBR2
                                    (processing        (10); (d) for
                                                 temperature)     SBR1  (20);
                                                                      SBR     (e) SBR2
                                                                           mixtures;     (20). curve—storage
                                                                                       green    Complex viscosity      (kPaˑs) atG080°C
                                                                                                               shearη*modulus        (kPa)     221
                           of(processing   temperature)
                               uncured rubber     mixturesforSBR
                                                               SBR   mixtures
                                                                  at 80 ◦ C as a- function
                                                                                   sapphireofcurve,  storage
                                                                                                angular       shearωmodulus
                                                                                                        frequency     (rad’s − G′
                                                                                                                                1) (kPa)
                                                                                                                                   (linear     222
                            of uncured region);
                           viscoelastic   rubber redmixtures   SBR at 80°C loss
                                                        curve—mechanical        as atanfunction
                                                                                         δ (−) asofa angular
                                                                                                     functionfrequency
                                                                                                               of angularωfrequency
                                                                                                                             (radˑs−1 )ω       223

                           (rad’s − 1) (oscillation strain 100%).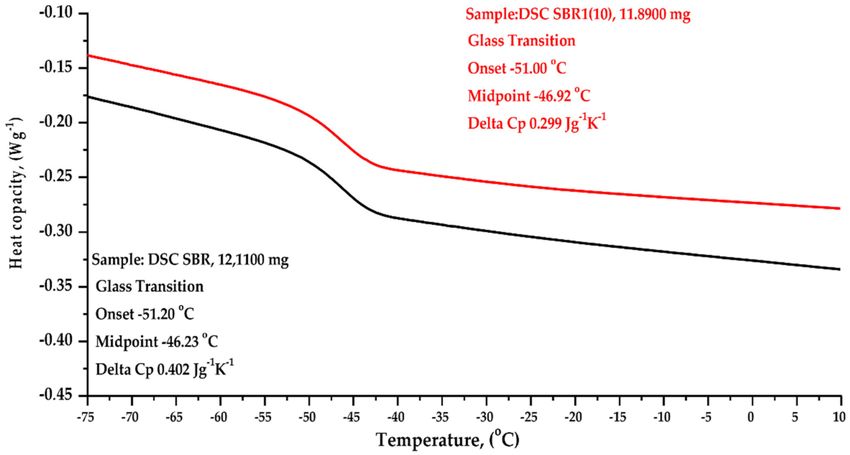
Materials 2021, 14, 4986                                                                                                  9 of 18

                               4.2.3. Cross-Linking Density
                                     The cross-linking densities of the prepared mixtures are presented in Table 4. The
                               reference sample had the highest cross-linking density. The samples doped with BCA1
                               ash did not show any particular tendency, while the cross-link densities of the polymers
                               filled with BCA2 ash increased with higher ash contents. The cross-linked density of the
                               SBR1 (20) and SBR2 (10) samples was 53% lower than the cross-link density of the reference
                               sample.

                                 Table 4. The cross-linking densities of the prepared mixtures.

            Symbol              SBR          SBR1 (10)     SBR1 (20)     SBR1 (30)      SBR2 (10)    SBR2 (20)     SBR2 (30)
   Total network density α
                             2.00 × 10⁻⁴     1.94 × 10⁻⁴   9.35 × 10⁻⁵   1.39 × 10⁻⁴   9.35 × 10⁻⁵   1.51 × 10⁻⁵   1.64 × 10⁻⁴
          [mol/cm3 ]

                               4.2.4. FTIR
                                    The composites were subjected to FTIR analysis to characterize the bonds present in
                               the ash samples and in the vulcanizates. Figure 3 shows a comparison of BCA1 and BCA2
                               ashes, while Figures 4 and 5 show examples of spectra for SBR, SBR1 (10), and SBR1 (30)
                               containing different amounts of ash.

                               Figure 3. FTIR spectra for ashes BCA1 and BCA2.

                                   The spectra presented in Figure 3 show valence vibrations of the bands coming from
                              the side chains and hydroxyl (–OH) groups in the region from 3200 to 3500 cm−1 . At
                              1706 cm−1 , a vibration band appears (C=O). The effect of silica on interactions with other
                              components of the BCA powder, and thus on other interactions, was manifested by shifting
                              of the absorption bands, reducing their intensity, etc. The characteristic absorption band at
                              1140 cm−1 can be attributed to the possible interaction of Si with the protein-like system
                              –Si–O. There is also a characteristic broad absorption band for BCA2 C-O powder at about
                              843 cm−1 . The bands between 780 and 650 cm–1 indicate the presence of Si–O–Si bonds.
                              A small band was observed in the range from 3600 to 3550 cm−1 , which is related to the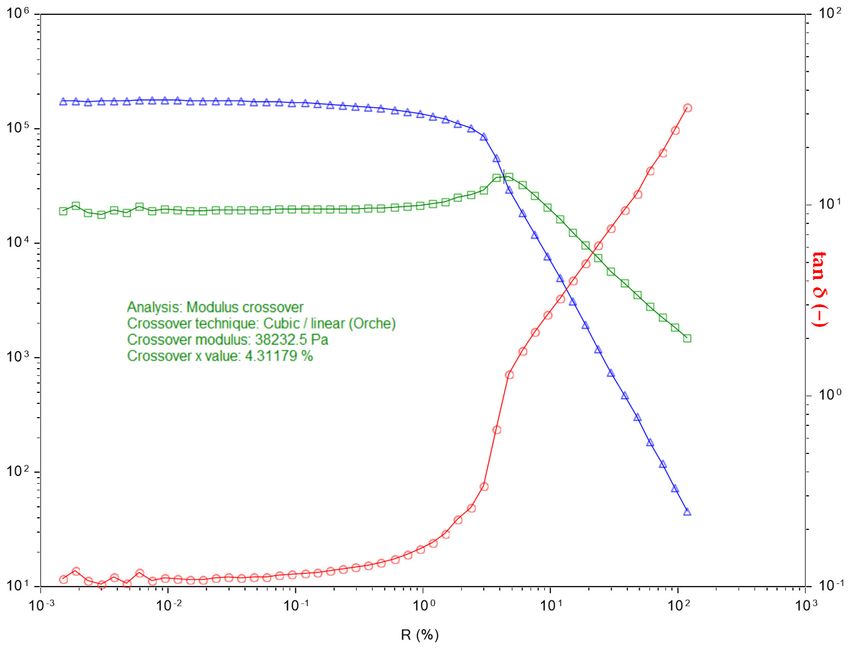
Materials 2021, 14, 4986                                                                                            10 of 18

                           vibration of the –OH group in the BCA1 sample. The Al-O compound appears in the range
                           of 920–910 cm−1 for both types of ashes.

                           Figure 4. FTIR spectra of SBR, SBR1 (10), and SBR1 (30) composites.

                           Figure 5. FTIR spectra for SBR, SBR1 (10), and SBR1 (30) after thermo-oxidative aging.

                                As shown in Figure 4, at 2885.07 cm−1 visible vibrations of the C–H groups are present
                           in the structure of the SBR aromatic styrene ring [27]. At 2100 cm−1 there is a C=C bond
                           derived from rubber butadiene. The intensity of the BCA bands changes with the amount
                           of ash, although these changes are not as significant. Small changes are visible in the
                           dactyloscopic area related to a slight increase in the intensity of the bands in the range
                           of 1500–1400 cm−1 and 500 cm−1 . The first are characterized by stretching vibrations of
                           the –C=C– aliphatic grouping and bending vibrations = C–H. However, the second is also
                           the confirmation of the occurrence of stretching vibrations of the aromatic ring v (C=C),
                           which come from styrene. Compared to the spectrum of BCA alone (Figures 4 and 5), the
Materials 2021, 14, 4986 11 of 18
intense band at 773 cm−1 derived from silicates significantly reduces in intensity, which
may indicate possible interaction with Si–O–C groups in the SBR aromatic rubber ring.
The band at 953 cm−1 is related to the absorption of stretching vibrations from the
C=C groups in the aromatic ring, which become much more intense as the amount of BCA
increases. This may indicate some interaction between the filler and the elastomer matrix.
The prominent peak at about 901 cm−1 indicates the presence of Al–O groups.
In the spectra of the mixtures after temperature aging (Figure 5), a change in the
intensity of certain peaks can be observed. In the case of the signal from the C=C groups,
as the share of ash in the mixture increased a decrease in the band intensity was observed
at the wavenumber of 2113 cm−1 and around 974 cm−1 . This was probably related to the
breaking of double bonds during aging.
4.2.5. Mechanical and Hardness Tests
The influence of BCA on the mechanical properties of the SBR vulcanizates is presented
in Table 5. A hardness test was performed to determine the effect of the amount of added
filler on the hardness of the rubber mixtures. The samples with the addition of ash showed
a decrease in hardness in the range of 8.7–14.8%. The smallest decrease was observed for
the SBR2 sample (20), and the largest decrease for the SBR2 sample (30). There was no
downward trend in hardness as a function of sample composition (addition of ash). This
parameter is related to the cross-linking density of composites and confirms the results of
the swelling measurements and rheometric tests.
Table 5. Influence of BCA filler on the mechanical properties of the SBR composites.
Symbol SBR SBR1 (10) SBR1 (20) SBR1 (30) SBR2 (10) SBR2 (20) SBR2 (30)
H [ºSh] 60.85 ± 1.69 55.29 ± 2.63 55.39 ± 1.55 52.71 ± 1.08 54.43 ± 0.62 55.54 ± 1.12 51.83 ± 1.35
SE100 [MPa] 3.37 ± 0.20 2.63 ± 0.23 1.53 ± 0.06 1.49 ± 0.06 1.79 ± 0.03 1.86 ± 0.05 1.51 ± 0.06
SE200 [MPa] 8.47 ± 0.44 5.78 ± 0.52 2.44 ± 0.13 2.22 ± 0.13 3.48 ± 0.09 3.31 ± 0.17 2.21 ± 0.10
SE300 [MPa] 15.57 ± 0.75 10.66 ± 0.96 3.98 ± 0.30 3.39 ± 0.26 6.51 ± 0.18 5.98 ± 0.37 3.36 ± 0.18
TS [MPa] 27.37 ± 0.32 18.5 ± 0.20 13.38 ± 0.66 11.86 ± 0.40 19.00 ± 0.35 15.95 ± 0.98 11.94 ± 0.54
Eb [%] 476 ± 24 441 ± 24 591 ± 25 619 ± 28 576 ± 15 535 ± 33 614 ± 14
Influence of theromoxidative and biological aging on the properties of SBR composites.
Symbol SBR SBR1 (10) SBR1 (20) SBR1 (30) SBR2 (10) SBR2 (20) SBR2 (30)
TS [MPa] 23.16 ± 1.65 12.87 ± 1.46 10.28 ± 0.98 9.34 ± 0.54 16.98 ± 1.65 14.24 ± 0.40 6.89 ± 1.75
Eb [%] 282 ± 23 287 ± 18 370 ± 25 400 ± 16 423 ± 23 368 ± 17 422 ± 4
Legend: SE100 (MPa)—stress modulus with elongation at 100%; SE200 (MPa)—stress modulus with elongation at 200%; SE300 (MPa)—stress
modulus with elongation at 300%; TS (MPa)—tensile strength; Eb (%)—elongation at break.
The results of the tensile strength tests show a decrease in breaking strength as a result
of doping the rubber mixtures with ash. The SBR control sample, without the addition of
ash fillers, had the highest tensile strength. The addition of ashes caused a decrease in the
tensile strength of the mixtures. The smallest decrease was observed for the SBR1 sample
(10). Elongation at break increased by between 12.6% and 30% following the addition
of ash fillers. The highest elongation was achieved by the SBR1 sample (30), with an
increase of 30% compared to the control (without filler). The only decrease in elongation in
comparison to the SBR control sample occurred in the case of SBR1 (10). The values for
this sample decreased with further additions of filler. This may be related to the lack of
the formation of permanent molecular interactions in the form of permanent bonds, for
example covalent or ionic bonds, although FTIR analysis indicated there may be weak
range metallic intermolecular interactions.
A strength test was carried out on the samples after thermo-oxidative aging. In the
case of thermo-oxidative treatment, the general trend remained unchanged. The highestMaterials 2021, 14, 4986 12 of 18
stresses were recorded for the SBR samples, and the lowest stresses for SBR1 (30). The
decreases in the elongation at break values were comparable for each of the samples. The
stress at break value for the reference sample decreased by 15% compared to the sample not
subjected to thermo-oxidative aging. The average reduction in tensile strength for samples
filled with ash was 23%. The elongation at break value for the reference sample decreased
by 41% after temperature aging. The mean decrease in elongation at break values for the
samples filled with ash was 33%. The lifetime of elastomers, including styrene–butadiene
rubber, is largely dependent on the aging processes. Physical and chemical properties
change, depending on the rubber content, the type of components used for the elastomer
mixture and the resulting internal network structure. In the presented cases (SBR2 (10),
SBR2 (20), SBR2 (30)) the decrease in tensile strength (TS) in relation to the samples not
subjected to aging, and thus the observed increase in the relative elongation Eb , may be
caused by changes in the viscoelastic properties caused by the introduction of the filler in
the form of ash BAC. The ash is characterized by a diverse mix of micro and macro elements
that influence the oxidation processes of the composite structure. In addition to elevated
temperature and humidity, oxygen, ozone, and light contribute to the aging processes.
During the aging processes, the cross-links are degraded, causing the relaxation of the tight
and more packed elastomeric structure, which, by changing the viscoelastic interactions,
leads to an increase in the elongation parameters at the moment of breaking Eb .
4.2.6. Carbonyl Index
The Carbonyl index (CI), based on changes in the carbonyl (C=O) band, is used for to
predict the lifespan and development of stabilizing additives [28–31]. The CI is used specif-
ically to monitor the absorption band of carbonyl species formed during photooxidation or
thermo-oxidation processes in the range from 1850 to 1650 cm−1 by measuring the ratio of
the carbonyl peak to the reference peak. The carbonyl index is the ratio of the band height
of the carbonyl groups to the band height of the C–H groups. An increase in CI indicates
more advanced degradation. One of the most common analytical techniques for monitoring
oxidation reactions, including CI, is Fourier transform infrared (FTIR) spectroscopy. FTIR
analysis is also able to monitor other chemical changes that occur over the lifespan of the
material, by detecting functional groups present in different bands.
The CI for the tested composites was calculated after temperature aging (Table 6).
The addition of ash lowered the CI, so it can be concluded that chemical reactions took
place in the vulcanizate structure, leading to the remodeling of individual bonds under
the influence of temperature. Increasing the amount of filler in the matrix thus caused the
matrix to degrade faster during processing. The lowest value (0.05) was recorded for the
SBR1 sample (10).
Table 6. Carbonyl index for samples after thermo-oxidative aging.
Wavenumber [cm−1 ]
Symbol Carbonyl Index (CI)
~1700 ~2800
SBR 0.92 6.30 0.15
SBR1 (10) 0.38 7.64 0.05
SBR1 (30) 0.91 8.80 0.10
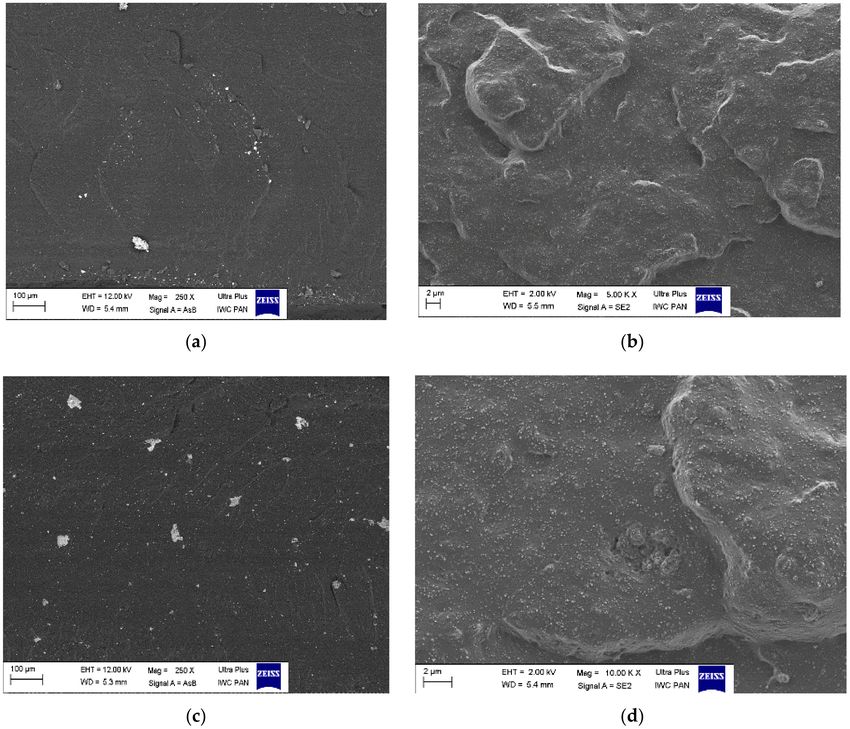
4.2.7. SEM Analysis
The morphology of the selected samples was assessed based on SEM photos taken at
the breakthroughs of individual materials (Figure 6). Photographs at 250 times magnifica-
tion revealed the diverse morphologies of the materials. In the case of the SBR reference
sample, a small number of fine agglomerates can be observed, which may represent, e.g.,
the grains of the crosslinker. On the other hand, in the case of samples with the addition of
ash, we can see an analogous increase in light agglomerates: the higher the addition of ash,Materials 2021, 14, 4986 13 of 18
the greater the proportion of particles with a regular structure, isolated from each other,
with a wide size distribution.
Figure 6. SEM photographs of composites (a,b)—SBR; (c,d)—SBR1 (10); (e,f)—SBR1 (20); left: photographs with ×250
magnification, right: photographs with ×5000 magnification.Materials 2021, 14, 4986 14 of 18
4.2.8. EDS Analysis
EDS analysis enabled qualitative and quantitative determination of the chemical
compositions of the studied composites. However, it should be remembered that EDS
provides only an approximate measure of individual minerals. The results are presented in
Table 7. Aluminum and calcium were not observed in the SBR mix but appeared in the
mixes with ash. This may indicate that these components were contained in the BCA1. The
reference mixture also had a very low silicon content, whereas in SBR1 (10) and SBR1 (20)
there was a significant increase in silicon content, which again leads us to the conclusion
that silicon was a component of the ash.
Table 7. Compositions of analyzed elastomer blends obtained by EDS analysis.
Designations of Mixtures
Chemical Elements, %
SBR SBR1 (10) SBR1 (20)
Oxygen 5.82 9.40 10.41
Sulfur 1.46 1.65 2.03
Zinc 1.27 0.58 1.74
Silicon 0.008 0.96 1.51
Aluminum - 0.78 0.96
Calcium - 1.54 1.59
Iron - - 1.28
4.2.9. DSC & TGA Analysis
The results of thermogravimetric analysis (TGA) and differential scanning calorimetry
(DSC) of selected SBR and SBR1 (10) composites are shown in Table 8, as well as in
Figures 7 and 8.
The addition of BCA filler did not significantly affect the temperature of thermal
decomposition of SBR. As seen from the standard deviation, the maximum decomposition
temperatures of all composites were the same. The total weight loss of the elastomers
tested during degradation was 97% for the reference sample and 91% for the BCA-filled
composites.
Figure 7. Thermogravimetric analysis (TGA) curves of SBR composites: reference sample SBR (black curve), SBR1 (10)
sample (red curve).Materials 2021, 14, 4986 15 of 18
Figure 8. Comparative analysis of DSC results: unfilled SBR (black curve) and SBR10 (10 phr of BCA,
red curve).
Table 8. Thermal characteristics of SBR and SBR1 (10).
T5% T peak 1 (DTG) T peak 2 (DTG) ∆m total Tg
Symbol
(◦ C) (◦ C) (◦ C) (%) (◦ C)
SBR 337 465 697 97.51 −46.23
SBR1 (10) 337 466.33 681 91.55 −46.92
T5% —decomposition temperature at 5% mass loss; Tp(DTG) —temperature of maximum conversion rate on the
DTG curve; ∆m total —total mass loss during thermal decomposition; Tg —glass transition temperature (standard
deviations: T5 , Tp (DTG ) ± 2 ◦ C; ∆m total ± 0.6%; Tg ± 2 ◦ C).
The glass transition temperature Tg of pure SBR is reported in the literature as
48/65 ◦ C [32]. DSC showed that the glass transition temperature Tg starts at the beginning
for the SBR composite, that is, at −46.23 ◦ C, while for SBR1 (10) Tg starts at −46.92 ◦ C
(Figure 8). This suggests that the BCA filler acts as a plasticizer in SBR compounds. This
effect is caused by certain amounts of macro- and microelements in the ashes obtained
from brown coal combustion. These undoubtedly include calcium and magnesium, as
well as silicon compounds. These elements, in combination with the components of the
elastomer mixture, such as stearin or oxide activators, vulcanization accelerators, can
impart plasticizing properties to rubber composites during cross-linking processes. The
heat capacity of the SBR composite was 0.402 Jg−1 K−1 , whereas for SBR1 (10) the heat
capacity decreased to 0.299 Jg−1 K−1
4.2.10. Testing Emission of VOCs from Vulcanizates
Ashes can adsorb different types of VOC’s, as well as gases or liquids in general.
Ashes, depending on their physicochemical properties, can effectively adsorb various
substances due to their high porosity, large surface area, suitable pore size and, for example,
unburned carbon [33]. The larger surface area and carbon content with a large micropore
volume results in higher adsorption capacity and longer penetration times. Additionally,
the adsorption effect is related not only to the physicochemical properties of the adsorbent
itself, but also to the physicochemical properties of the adsorbate, such as pore structure
and surface functional groups [34].
The use of MCC-IMS allowed us to observe the effect of the ash on the release of
chemical compounds from the mixture during the vulcanization process. The addition
of a small amount of ash was found to reduce the amount of VOCs released during
vulcanization, by approximately 48% on average (Table 9 and Figure 9). Ash as a highly
porous and high-surface-area filler, can successfully trap released VOCs from rubber. TheMaterials 2021, 14, 4986 16 of 18
observed effect can be reduced by the polymer matrix which surround the filler particles
“taking” their active groups on the surface, but also it can penetrate into the micro pores
of the filler, reducing its number of free voids. With higher proportions of ash, decreases
in emissions were also observed, but they were less significant. The reason for the higher
VOCs emissions of the SBR1 sample (30) compared to the SBR1 sample (10) may be the
amount of ash they contained.
Table 9. Comparison of the intensity of VOC signals released during the vulcanization process from
the tested rubber mixtures.
Benzothiazoles Benzothiazole Dimer Aniline X1 X2
SBR 1129 399 532 973 466
SBR1(10) 961 171 178 608 264
SBR1(30) 1102 192 423 888 371
Figure 9. Graphical representation of VOCs released during the vulcanization process.
Increasing the proportion of filler in the mixture causes agglomeration, which reduces
the active surface area and, as a consequence, the adsorbing properties of the filler. In
addition, agglomeration of the filler reduces its degree of dispersion, which may have a
direct negative impact on the amount of VOCs released.
Two VOCs that were identified in this analysis are known as decomposition by-
products of accelerators: benzothiazole and aniline. There was a reduction in the emission
of two other unknown chemicals, based on comparison with the reference blend.
5. Conclusions
In this study, we used ash produced during the combustion of lignite at the Bełchatów
Power Plant (Poland) in 2017 and 2018 as additives in SBR mixtures. The additives reduced
the emission of volatile organic compounds (VOCs) from the rubber mixtures during
vulcanization. Their use to fill elastomeric mixtures could reduce production costs, while
also contributing to waste management of the ash.
The incorporation of ash into the structures of the prepared mixtures was confirmed
by SEM, EDS, and FTIR spectroscopy. Differences in the morphology and chemical compo-
sition of the two analyzed ashes were also noted. These differences may result from theMaterials 2021, 14, 4986 17 of 18
origin of the ash, the conditions of its formation, the combustion processes used and the
place of sampling.
A decrease in the mechanical properties of the vulcanizates was observed following
the addition of the ashes, which proves that they are inactive fillers. The addition of a small
amount of BCA1 ash (10 pts. wt.) maintained the good mechanical properties of the SBR,
while also reducing VOC emissions during vulcanization. The presented solution opens
the way for doping with waste ash waste from the energy and mining industries, among
others. The produced vucanizates can be used in the automotive industry, among others,
for example in the production of rubber products used in closed spaces, e.g., car floor mats
or other elements of car cabin equipment.
Author Contributions: Conceptualization, D.B. and M.P.; methodology, M.P. and D.B.; software, D.P.,
D.B. and M.P.; validation, P.S., M.M. and O.D.; formal analysis, M.P. and D.B.; investigation, M.M.,
P.S. and D.P.; resources, M.M., P.S. and M.P.; data curation, M.P., D.B. and D.P.; writing—original
draft, M.P., P.S., M.M. and O.D. All authors have read and agreed to the published version of the
manuscript.
Funding: This research received no external funding.
Institutional Review Board Statement: Not applicable.
Informed Consent Statement: Not applicable.
Data Availability Statement: Not applicable.
Conflicts of Interest: The authors declare no conflict of interest.
References
1. Statistics and Balances, Wayback Machine, 2013.
2. Council of Europe. Parliamentary Assembly, Documents de Séance; Council of Europe, Parliamentary Assembly: Strasbourg,
Germany, 2004; pp. 5–6.
3. Council of Europe. Parliamentary, Documents: Working Papers, Ordinary Session (Fourth Part); Council of Europe: Strasbourg,
France, 2004; Volume VI, pp. 253–259.
4. Borenstein, S. Carbon-Emissions Culprit? Coal; The Seattle Times Company: 2007. Available online: http://seattletimes.nwsource.
com/html/nationworld/2003732690_carbon03.html (accessed on 16 July 2021).
5. US Environmental Protection Agency. Sulfur Dioxide. Available online: https://www.epa.gov/ (accessed on 16 July 2021).
6. Szponder, D.; Trybalski, K. Określanie właściwości popiołów lotnych przy użyciu różnych metod i urzadze ˛ ń badawczych.
Górnictwo i Geoinżynieria 2009, 33, 287–298.
7. Rajczyk, K.; Gasior,
˛ D. Innowacyjny sposób wykorzystania niespalonych czastek ˛ w˛egla zawartych w popiołach lotnych z w˛egla
brunatnego. Pr. Inst. Ceram. i Mater. Bud. 2017, 10, 7–21.
8. Esomba, S. The Book: Twenty-First Century’s Fuel Sufficiency Roadmap, Lulu. pp. 600–606. Available online: https://www.lulu.
com/shop/steve-esomba-dr/shop/steve-esomba-dr/twenty-first-centurys-fuel-sufficiency-roadmap/paperback/product-19
zzd294.html?page=1&pageSize=4 (accessed on 16 July 2021).
9. Tkaczewska, E.; Mróz, R.; Łój, G. Coal-biomass fly ashes for cement production of CEM II/A-V 42.5R. Constr. Build. Mater 2012, 1,
633–639. [CrossRef]
10. Formela, M.; Stryczek, S. Popioły fluidalne ze spalania w˛egla brunatnego jako dodatek do zaczynów uszczelniajacych ˛ wyko-
rzystywanych podczas prac wypełniania pustek w górotworze. Zesz. Nauk. Inst. Gospod. Surowcami Miner. i Energia˛ PAN 2017, 97,
117–134.
11. St˛epień, M.; Białecka, B. Inwentaryzacja innowacyjnych technologii odzysku odpadów energetycznych. Syst. Wspomagania w
Inżynierii Produkcji. 2017, 6, 108–123.
12. Faber, J.; Brodzik, K. Emisja LZO z tworzyw syntetycznych w komorze 1m3 - istotne źródła niepewności. Autobusy Tech. Eksploat.
Syst. Transp. 2017, 18, 857–864.
13. Zabiegała, B. Jakość powietrza wewn˛etrznego-Lotne zwiazki ˛ organiczne jako wskaźnik jakości powietrza wewn˛etrznego. Monogr.
Kom. Inżynierii Sr. PAN 2009, I, 303–315.
14. Blackley, D.C. Polymer Latices: Science and Technology Volume 3: Applications of Latices; Springer-Science + Business Mesia:
Berlin/Heidelberg, Germany, 2012; p. 242.
15. Alves, J.O.; Zhuo, C.; Levendis, Y.A.; Tenório, J.A.S. Microstructural analysis of carbon nanomaterials produced from pyroly-
sis/combustion of Styrene-Butadiene-Rubber (SBR). Mater. Res. 2011, 14, 499–504. [CrossRef]
16. Ren, X.; Sancaktar, E. Use of fly ash as eco-friendly filler in synthetic rubber for tire applications. J. Clean. Prod. 2018, 206, 374–382.
[CrossRef]Materials 2021, 14, 4986 18 of 18
17. Wysokiński, A.; Skład, S.; Kalembasa. Chemiczny popiołów z w˛egla brunatnego i kamiennego w aspekcie ich rolniczego
zagospodarowania. Rocz. Glebozn. 2008, 2, 93–97.
18. Gawlicki, M. Ostrowski, M. Aktywność wapiennych popiołów lotnych z Elektrowni ‘Bełchatów’ jako składnika cementów
powszechnego użytku. Pr. Inst. Ceram. i Mater. Bud. 2012, 5, 66–75.
19. Hycnar, E.; Jończyk, M.W.; Ratajczak, T. Popioły lotne i iły beidellitowe z Bełchatowa jako składniki mieszanin samozestalajacych ˛
si˛e. Zesz. Nauk. Inst. Gospod. Surowcami Miner. i Energia˛ Pol. Akad. Nauk. 2017, 100, 37–48.
20. Garcia, A.B.; Cameán, I. Graphite materials prepared by HTT of unburned carbon from coal combustion fly ashes: Performance
as anodes in lithium-ion batteries. J. Power Sources 2011, 196, 4816–4820.
21. Zapotoczna-Sytek, G.; Michalik, A. Badania nad zastosowaniem popiołów lotnych ze spalania w˛egli w kotłach fluidalnych do
wytwarzania autoklawizowanego betonu komórkowego. Pr. Inst. Ceram. i Mater. Bud. 2010, 3, 123–140.
22. Gum. Determination of Hardness according to the Shore Method; Polish Accreditation Center: Warsaw, Poland, 2014.
23. Liquid Resistance, Weight Method; Polish Accreditation Center: Warsaw, Poland, 2014.
24. Lew, A.; Kardelky, C.; Haupt, P. Theory and eksperymentach Rubber Chemistry and Technology. 2003, 533–547.
25. Przepiórkowska, A.; Prochon, M.; Zaborski, M.; Żakowska, Z.; Piotrowska, M. Biodegradable protein-containing elastomeric
vulcanizates. Rubber Chem. Technol. 2005, 78, 868–878. [CrossRef]
26. Polgar, L.; Kingma, A.; Roelfs, M.; van Essen, M.; van Duin, M.; Picchioni, F. Kinetics of cross-linking and de-cross-linking of EPM
rubber with thermoreversible Diels-Alder chemistry. Eur. Polym. J. 2017, 90, 150–161. [CrossRef]
27. Baeta, D.A.; Zattera, J.A.; Oliveira, M.; Oliveira, P.J. The use of styrene-butadiene rubber waste as a potential filler in nitrile rubber:
Order of addition and size of waste particles. Braz. J. Chem. Eng. 2009, 26, 23–31. [CrossRef]
28. Brandt, H.; Nentwig, W.; Rooney, N.; LaFlair, R.; Wolf, U.; Duffy, J.; Puskas, J.; Kaszas, G.; Drewitt, M. Rubber, Solution Rubbers,
Encyclopedia of Industrial Chemistry; Wiley-VCH: Hoboken, NJ, USA, 2012.
29. Mellor, D.; Moir, A.; Scott, G. The effect of processing conditions on the u.v. stability of polyolefins. Eur. Polym. J. 1973, 9, 219–225.
[CrossRef]
30. Andrady, A. Plastics and Environmental Sustainability; John Wiley and Sons: Hoboken, NJ, USA, 2015.
31. Santos, A.S.; Agnelli, J.A.; Trevisan, D.W.; Manrich, S. Degradation and stabilization of polyolefins from municipal plastic waste
during multiple extrusions under different reprocessing conditions. Polym. Degrad. Stab. 2002, 77, 441. [CrossRef]
32. Focke, W.W.; Mashele, R.P.; Nhlapo, N.S. Stabilization of low-density polyethylene films containing metal stearates as pho-
todegradants. J. Vinyl. Addit. Technol. 2011, 1, 21–27. [CrossRef]
33. Belviso, C. State-of-the-art applications of fly ash from coal and biomass: A focus on zeolite synthesis processes and issues. Prog.
Energy Combust. Sci. 2018, 65, 109–135. [CrossRef]
34. Wang, S.; Ma, Q.; Zhu, Z. Characteristics of coal fly ash and adsorption application. Fuel 2008, 87, 3469–3473. [CrossRef]You can also read