UTAH WOLF MANAGEMENT PLAN - Utah Division of Wildlife Resources Publication #: 05-17 Prepared by: The Utah Division of Wildlife Resources & The ...
←
→
Page content transcription
If your browser does not render page correctly, please read the page content below
UTAH WOLF
   MANAGEMENT PLAN

Utah Division of Wildlife Resources Publication #: 05-17

                     Prepared by:
        The Utah Division of Wildlife Resources
                           &
            The Utah Wolf Working Group
UTAH WOLF MANAGEMENT PLAN
Table of Contents
List of Tables ........................................................................................... i
List of Figures ......................................................................................... ii
Executive Summary ................................................................................ iii
Dedication ............................................................................................... iv
Introduction ............................................................................................ 1
Part I. Gray Wolf Ecology and Natural History .................................... 4
Description ............................................................................................... 4
Distribution ............................................................................................... 4
Sign .......................................................................................................... 5
Taxonomy ................................................................................................ 5
Reproduction ............................................................................................ 6
Mortality .................................................................................................... 6
Social Ecology .......................................................................................... 6
Population Dynamics ................................................................................ 7
Dispersal .................................................................................................. 8
Habitat Use and Home Ranges .................................................................8
Food Habits .............................................................................................. 9
Wolf-Prey Relationships ......................................................................... 10
Interactions with Non-Prey ..................................................................... 11
Ecosystem Level Impacts ....................................................................... 11
Ecological Values ................................................................................... 12
The Unknown ......................................................................................... 12
Part II. Historic and Current Status of Wolves in the
Intermountain West .............................................................................. 13
History .................................................................................................... 13
Current Status and Distribution ...............................................................13
Wolf Management in the Intermountain West ........................................ 14
Part III. Wolves In Utah .........................................................................20
Utah’s Environment and Wolves ............................................................ 20
Potential Economic Impact of Wolves .................................................... 20
Part IV. Stakeholders and Wolves ...................................................... 23
Background ............................................................................................ 23
Scoping Meetings ................................................................................... 23
Overall Summary of Top Issues .................................................. 23
Prioritized Top Issues ....................................................... 23
Overall Summary of Top Advice .................................................. 24
Prioritized Top Advice ....................................................... 24
Survey of Public Attitudes ...................................................................... 24Part V. Management Plan Purpose, Objectives and Strategies ....... 28
Purpose .................................................................................................. 28
Management Goal .................................................................................. 28
Management Objectives ......................................................................... 28
Management Strategies ............................................................................... 28
Strategy I: Develop and implement outreach programs ............... 29
Timeline ............................................................................ 29
Strategy II: Manage wolf/human interactions to benefit both
humans and wolves ..................................................................... 30
Nuisance and Chronic Nuisance Responses .................... 31
Human Safety Response .................................................. 31
Implementation ................................................................. 31
Strategy III: Develop and implement wolf monitoring and
research programs .......................................................................32
Training ............................................................................. 32
Programs .......................................................................... 32
Reporting and Expansion .................................................. 33
Strategy IV: Manage wolf/wildlife interactions to meet the
objectives of this plan .................................................................. 33
Influence on wildlife management ..................................... 34
Recommendations ............................................................ 34
Strategy V: Control livestock depredation and fully compensate
livestock owners for losses of livestock to wolves ........................35
Preventing Livestock Depredation .................................... 35
Depredation actions .......................................................... 36
Private lands .......................................................... 37
Public lands ............................................................ 37
Agency actions ....................................................... 37
Compensation Program .................................................... 39
Strategy VI: Provide funding for wolf management ...................... 39
Literature Cited ............................................................................................ 41
Appendix 1. House Joint Resolution 12 ................................................. 51
Appendix 2. Utah Wolf Working Group Charter...................................54
Appendix 3. Defenders of Wildlife Compensation Policy ...................57
Appendix 4. Public Scoping Process ...................................................59
Appendix 5. Summary Report: Utah Residents’ Attitudes
Towards Gray Wolves............................................................................63List of Tables
2.1 Minimum fall wolf population estimates by recovery area for
the Northern Rockies wolf population from 1979 – 2004 .........................15
2.2 Estimated number of breeding pairs, by recovery area, for
the Northern Rockies wolf population from 1979 – 2004 .........................16
2.3 Confirmed wolf depredation and wolf management actions in
the Northern Rockies by recovery area, 1987 – 2004 ............................ 17
3.1 Status of Utah’s wildlife communities and the potential impact
of wolves on these communities ............................................................ 21
3.2 Cattle and sheep abundance, trend and distribution in Utah ........... 22
4.1 Summary of Utahns’ attitudes toward wolves....................................25
iList of Figures
2.1 2004 distribution of wolves within the Northern Rockies ................. 18
2.2 Wolf population trend in the Northern Rockies, 1979 – 2004 .......... 19
iiExecutive Summary
This plan will guide management of wolves in Utah during an interim period from
delisting until 2015, or until it is determined that wolves have established1 in
Utah, or assumptions of the plan (political, social, biological, or legal) change.
During this interim period, arriving wolves will be studied to determine where they
are most likely to settle without conflict.
The goal of this plan is to manage, study, and conserve wolves moving into Utah
while avoiding conflicts with the wildlife management objectives of the Ute Indian
Tribe; preventing livestock depredation; and protecting the investment made in
wildlife in Utah.
Under this plan, wolves will be allowed to disperse into Utah, and be conserved,
except when or where:
• Wolves conflict with the wildlife management objectives of the Ute Indian
Tribe;
• Wolves cause unacceptable livestock depredation; or
• Wolves contribute to wildlife populations not meeting management
objectives as defined by the Utah Wildlife Board’s Predator Management
Policy.
Livestock owners will be fully compensated for losses of livestock to wolves.
Under this plan, six strategies are proposed:
• Develop and implement outreach programs.
• Manage wolf/human interactions to benefit both humans and wolves.
• Develop and implement wolf monitoring and research programs.
• Manage wolf/wildlife interactions to meet the objectives of this plan.
• Control livestock depredation and fully compensate livestock owners for
losses of livestock to wolves.
• Provide funding for wolf management.
1
“Established” is defined as “at least 2 breeding pairs of wild wolves successfully raising at least 2
st
young each (until December 31 of the year of their birth), for 2 consecutive years.” [USFWS,
Reintroduction of Grey Wolves into Yellowstone National Park and Central Idaho, Final EIS, May
1994, US Fish and Wildlife Service, Helena, MT; Pages 6-66 and 6-67 in Appendix 8:
Memorandum Regarding Definition of a Wolf Population. From EIS Team Wolf Scientist and
Northern Rocky Mountain Wolf Recovery Coordinator, March 11, 1994.]
iiiDedication
This plan is dedicated to Kevin Conway, our friend and our leader. Kevin was
the Director of the Utah Division of Wildlife Resources from 2002 until his
untimely death in 2004. He was the driving force behind this document, and its
chief proponent. He had faith in the Utah Wolf Working Group, and he held us
to his own high standards. He knew that there was no more contentious issue in
America than wolves, but he assembled a diverse group of people to work
together to complete a wolf management plan for Utah. Kevin had faith in us,
enduring enormous physical pain to cheer us on and to show his confidence in
the group. He never lost faith in what was right. He was a friend to Utah’s
wildlife and a model for all of us.
ivIntroduction
In 2003, the Utah Legislature passed House Joint Resolution 12 (HJR-12)
(Appendix 1), which directed the Division of Wildlife Resources (DWR) to draft a
wolf management plan for review, modification and adoption by the Utah Wildlife
Board, through the Regional Advisory Council process. In April of 2003, the
Wildlife Board directed DWR to develop a proposal for a wolf working group to
assist the agency in this endeavor. The DWR consulted with a professional
facilitator and numerous interests groups in an effort to identify a working group
capable of drafting a management plan within the framework established by
HJR-12 and the Utah Code.
The DWR created the Wolf Working Group (WWG) in the summer of 2003. The
WWG is composed of 13 members that represent diverse public interests
regarding wolves in Utah. The WWG includes representatives from academia
(USU faculty), wolf advocates (Utah Wolf Form), sportsmen representatives
(Rocky Mountain Elk Foundation and Sportsmen for Fish and Wildlife),
agricultural interests (Utah Farm Bureau Federation and Utah Wool Growers),
local government representatives (Utah Association of Counties), the Ute Indian
Tribe, two at-large conservation organization representatives, and a member of
the Utah Wildlife Board. Technical advisors from the DWR, the US Fish and
Wildlife Service, and the US Department of Agriculture Wildlife Services (USDA-
WS) assist the working group. A professional facilitation firm, Dynamic Solutions
Group, of Casper Wyoming, facilitated WWG meetings, and helped draft this
plan.
Members of the WWG include:
Jim Bowns (Utah Wildlife Board)
Sterling Brown (Utah Farm Bureau Federation)
Bill Burbridge (Utah Wildlife Federation)
Bill Christensen (Rocky Mountain Elk Foundation)
Karen Corts (Ute Tribe Fish and Game Department)
Debbie Goodman (Audubon)
Allison Jones (Utah Wolf Forum)
Don Peay (Sportsmen for Fish & Wildlife)
Robert Schmidt (Utah State University, Department of Environment and
Society)
Randy Simmons (Utah State University, Political Science Department)
Trey Simmons (Utah Wolf Forum)
Mark Walsh (Utah Association of Counties) - Did not attend any meetings
Clark Willis (Utah Wool Growers)
A number of alternate representatives also gave unselfishly of their time and
talents in developing this plan, as well:
Sterling Brown – alternate for Wes Quinton and Todd Bingham
Kirk Robinson – alternate for Allison Jones, Trey Simmons
1Byron Bateman – alternate for Don Peay
Bill Fenimore – alternate for Debbie Goodman, and Bill Burbridge
Charles Kay – alternate for Randy Simmons
Dr. Mike Wolfe – alternate for Dr. Robert Schmidt
Lee Howard – alternate for Dr. James Bowns
Jerry Mason (deceased) – alternate for Bill Burbridge
Ken Young – alternate for Bill Christensen
Technical Advisors included:
Kevin Bunnell (Utah Division of Wildlife Resources)
Craig McLaughlin (Utah Division of Wildlife Resources)
Jim Karpowitz (Utah Division of Wildlife Resources)
Mike Bodenchuk (USDA Wildlife Services)
Laura Romin (U.S. Fish and Wildlife Service)
The WWG met 13 times, beginning in November 2003 and concluding in April
2005. They considered a host of issues, concerns and ideas, presented by the
citizens and scientists who took the time to make themselves available to the
group. These discussions took the form of lively debate, and not infrequent
disagreement within the WWG. Yet the WWG persisted, and produced the
following management plan using a consensus minus 2 standard for resolving
disagreements (Appendix 2).
The plan is based on HJR-12 which urges that the objectives and strategies of
the plan, to the extent possible:
- Be consistent with the wildlife management objectives of the Ute Indian
Tribe;
- Prevent livestock depredation; and
- Protect the investments made in wildlife management efforts while
being consistent with U.S. Fish and Wildlife Service regulations and
other Utah species management plans.
This is that plan. The WWG has done all they can to provide a credible
conservation plan for wolves, which meets the above criteria. It is intended to be
an interim plan, covering that time period between delisting and the development
of naturally occurring wolf packs in Utah. It is intended to be adaptive in nature,
so that as conditions change, the plan may adapt to those changes.
The goal of the plan is to manage, study, and conserve wolves moving into Utah
while avoiding conflicts with the wildlife management objectives of the Ute Indian
Tribe; preventing livestock depredation; and protecting the investment made in
wildlife in Utah.
The majority of the WWG believes that this plan is fair, sustainable and flexible.
We believe it will, to the greatest extent possible, meet the needs of wolf
2conservation, prevent livestock depredation and protect the existing wildlife
resources of the State of Utah.1
1
This statement pertains to the Utah Wolf Management Plan as it was presented to the Utah Wildlife Board
(Board) by the WWG and some members of the WWG may not support the changes made by the Board
that are identified herein.
3Part I. Gray Wolf Ecology and Natural History
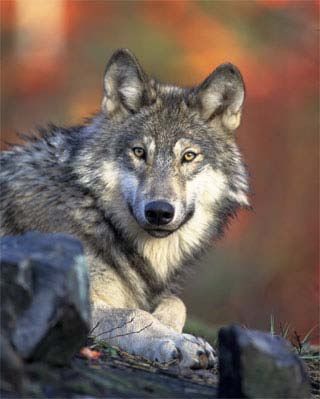
Description
The gray wolf (Canis lupus) is the largest species in the canid family and
resembles a large domestic dog (C. familiaris), such as a husky. Wolves can
usually be distinguished from domestic dogs by their proportionally longer legs,
larger feet and narrower chest (Banfield 1974). Wolves can also be
distinguished from other canids by wide tufts of hair that project down and
outward from below their ears (Mech 1970). Wolves also have straight tails that
do not curl up at the tip like some domestic dogs. Adult wolves, except black
individuals, have white fur around their mouths, whereas most domestic dogs
have black fur around their mouths (Paguet and Carbyn 2003)
Wolves are sexually dimorphic, with males being larger than females. Adult
males weigh 20-80 kg (50-175 lbs) and vary in length from 1.3-1.6 m (4.2-5.4 ft).
Shoulder height varies from 66-81 cm (26-32 in). Adult females weigh 16-55 kg
(35-121 lbs) and are 1.4-1.5 m (4.5-5.0 ft) in length (Young and Goldman 1944,
Mech 1970, Mech 1974). Wolf size follows Bergman’s rule with overall size
increasing with latitude (Mech 1970, Mech 1974).
Coloration of wolves is agouti (highly variable, ranging from pure white to coal
black). The most common coloration is light tan mixed with brown, black and
white. Black hair is usually concentrated on the back, while the forehead area
tends to be brown and the lower portions of the head and body are usually
whitish (Paquet and Carbyn 2003). The pelt consists of long coarse guard hairs
with a much shorter, thicker and softer under fur. Dorsal hair is longer than
ventral hair and the longest hair occurs in the mane, an erectile part of the coat
that extends along the center of the back from the neck to behind the shoulders.
Wolves undergo a single annual molt that begins in late spring (Paquet and
Carbyn 2003).
Distribution
The gray wolf is circumpolar throughout the northern hemisphere north of 15-20°
N latitude, and has one the most extensive native ranges of any terrestrial
mammal species. The historical range included nearly all of Eurasia and North
America. The present distribution is much more restricted with wolves found
mostly in remote undeveloped areas with sparse human populations (Paquet and
Carbyn 2003).
In North America the gray wolf historically occupied all habitats north of
approximately 20° N latitude except the southeast U.S. where the red wolf (Canis
rufus) was the dominant canine. During the nineteenth century the increase in
human population and the expansion of agriculture resulted in a general decline
in the abundance and distribution of wolves in North America. Subsequently,
intensive predator control efforts from 1900-1930 virtually eliminated wolves form
the western United States and adjoining parts of Canada. By 1960, wolves were
4virtually extirpated from all the United States except Alaska and northern
Minnesota.
Wolves were historically found throughout Utah, except the Great Salt Lake
Desert (Durrant 1952). In 1888, the Utah Territorial Legislature began the
extermination of wolves from the state by offering a $1 bounty. The government-
sponsored extermination of wolves continued in Utah until 1930 when the last
verified wolf was killed in San Juan County. Previous to this, the U.S. Bureau of
Biological Survey reported killing 162 wolves in Utah between 1917 and 1930,
with a high of 48 taken in 1918. In July and August of 2002 USDA-WS personnel
verified wolf predation on livestock in Cache Co. and in November of 2002 a wolf
was captured north of Morgan and then returned to Yellowstone National Park
(YNP) where it had been radio-collared as part of an ongoing reintroduction
effort. These instances marked the first verified occurrences of wolves in Utah in
74 years.
Sign
Wolves usually walk or trot in an alternating pattern but may also trot in a two-
print pattern or lope in a four-print gallop pattern. Young (1944) reported that wolf
tracks in the Rocky Mountains averaged 9 cm (3.5 in) in length and 7 cm (2.7 in)
in width for the front foot and 8.2 cm (3.2 in) in length and 6.4 cm (2.5 in) in width
for the hind foot. Recently transplanted wolves and their offspring have tracks
measuring nearly 5 in (12.7 cm) in length and 4 in (10.2 cm) in width (across the
toes) (Glazier, K. pers. comm.) Claw marks are almost always present; the foot
pad makes up approximately 1/3 of the entire print with one lobe on the leading
edge of the interdigital pad and the inside toe is slightly larger than the outside
toe. Trails are usually straight and direct rather than wandering. In comparison
with most dogs, wolf tracks are more elongated, have the front two prints closer
together and the marks of the front two claws are more prominent (Halfpenny
2001, Paquet and Carbyn 2003). Scat varies in color from pure black to almost
white and varies in consistency from toothpaste-like to almost entirely of hair and
bone. Scat averages approximately 10 cm (4 in) in length and 3.2 cm (1.25 in) in
diameter (Halfpenny 2001).
Taxonomy
The gray wolf is a member of the Canidae family in the order Carnivora and is
closely related the coyote (C. latrans) and the Simien jackal (C. simensis). The
closest relative of the wolf is the domestic dog (Wayne et al. 1995). Along with
the coyote, the wolf is generally considered morphologically primitive and is
typically placed at the beginning of systematic representations of the order
Carnivora. The genus Canis seems to have originated in the early to middle
Pliocence (Wayne et al. 1995). According to Wilson et al. (2000), North America
was inhabited by a common ancestor to modern canids 1-2 million years ago.
Some of these animals traveled across the Bering Land Bridge where they
evolved into the gray wolf in Eurasia. The remaining canids evolved in North
America, developing into the coyote, which adapted to preying on smaller
5mammals in the arid southwest and the red wolf (Canis rufus), which adapted to
preying on white-tailed deer (Odocoileus virginianus) in eastern forests. Gray
wolves later returned to North America and adapted to preying on large
ungulates throughout the western and northern United States.
Reproduction
Wolves mate from January to April, depending on latitude. Courtship takes place
between pack members or lone wolves that pair during the mating season and
estrus in breeding females lasts 5-7 days. Within a pack the dominant pair are
normally the only individuals to breed and subordinate females are held in a state
of behaviorally induced reproductive suppression (Harrington et al. 1982,
Packard et al. 1985). Young are born in the spring after a 62-63 day gestation
period. Birth usually takes place in a sheltered place such as a hole, rock
crevice, hollow log, or overturned stump. Young are blind and deaf at birth and
weigh an average of 450 g (14.5 oz). Litter size averages 6 pups but ranges
from 1-11 and may be correlated with the carrying capacity of the environment
(Mech 1970, Boertje & Stephenson 1992). Sex ratio of litters may be skewed
toward males in high-density populations (Kuyt 1972, Mech 1975).
Mortality
Significant natural causes of mortality in wolf populations include: starvation
(Mech 1972, Seal et al. 1975, Van Ballenberghe and Mech 1975, Fuller and
Keith 1980), disease (Murie 1944, Carbyn 1982a, Bailey et al. 1995), interspecific
conflicts (Ballard 1982, Nelson and Mech 1985, Mech and Nelson 1990, Weaver
1992), and accidents (Fuller and Keith 1980, Boyd et al. 1992). Research has
also shown that mortality resulting from intraspecific aggression, in addition to
starvation, increases when wolf populations are faced with low prey densities
(Van Ballenberghe and Erickson 1973, Messier 1985a, Mech 1977a). In
addition, human related mortality factors are significant for most wolf populations.
Common human related mortality factors include: harvest (Fuller and Keith 1980,
Ballard et at. 1987, Bjorge and Gunson 1989, Hayes et al. 1991, Plestcher et al.
1997), poaching (Fritts and Mech 1981, Fuller 1989, Plestcher et al. 1997),
vehicles (Berg and Kuehn 1982, Forbes and Therberge 1995, Paquet et al. 1996,
Forshner 2000), and introduced disease such as parvovirus (Bailey et al. 1995).
Annual mortality rates in exploited populations (essentially all aside from Isle
Royale) range from 15% to 68% (Fuller et al. 2003).
Social Ecology
Although some wolves are solitary, most are highly gregarious and live in packs
with complex social structures. Packs are usually comprised of a breeding pair
and their offspring of the previous 1-3 years, or occasionally two or three such
families (Murie 1944, Young and Goldman 1944, Mech 1970, Clark 1971, Haber
1977, Mech and Nelson 1989). Within a wolf pack, a strict dominance hierarchy
exists and the position of individuals within the hierarchy is reflected by status
and privilege (Paquet and Carbyn 2003). Pack size is largest in fall and early
winter when pups are integrated into the pack. Pack size normally ranges
6between 5-12 individuals, although larger packs have been reported (Mech
1974). Most offspring disperse at approximately 1-2 years of age with a few
remaining with the pack up to 3 years (Gese and Mech 1991, Mech et al. 1998).
The proximate and ultimate mechanisms regulating pack size are highly complex
and not perfectly understood; however, there is a growing body of evidence
against an earlier notion that wolves live in packs to facilitate predation on larger
prey (Thurber and Peterson 1993, Hayes 1995, Dale et al. 1995, Schmidt and
Mech 1997). There is evidence that an increase in prey abundance produces a
direct increment in the in-group recruitment and survival resulting in at least
temporarily larger packs (Keith 1983). Food limitation has also been shown to
be correlated with increased dispersal (Messier 1985b, Peterson & Page 1988)
Communication between wolves is accomplished through postures (Schenkel
1967, Crisler 1958, Fox 1973, Zimen 1976, Fox and Cohen 1977), vocalizations
(Harrington and Mech 1983, Harrington 1989, Coscia et al 1991, Coscia 1995)
and scents (Kleiman 1966, Theberge and Falls 1967, Peters 1978, Harrington
1981, Asa et al. 1985, Merti-Millhollen et al. 1986, Paquet 1989, Asa 1997, Asa
and Valdespino 1998). Innate recognizable patterns of behavior communicate
the inner state of a wolf to which other wolves respond. An elevated tail and
erect ears conveys alertness and sometimes aggression. Facial expressions,
especially the position of the lips and display of the teeth are the most dramatic
form of communication. Scent from urine, and possibly feces, is used to express
social status and breeding condition and to mark territorial boundaries (Peters
and Mech 1978, Asa et al. 1985). Vocalization (howling) is used by wolves to
maintain territories and communicate among themselves. Howls can be heard
for several kilometers under certain conditions and Joslin (1967) reported that
howling could advertise the presence of wolves to conspecifics over a 130 km2
(50 mi2) area. Howling may also be involved in coordinating pack activities
(Harrington and Mech 1978a & b). Harrington (1975) reported that howling plays
an important role in maintaining pack structure, especially in populations with
high mortality, helping to assemble the pack members after they have been
separated. Howling may also help coordinate hunting efforts (Peterson 1977).
Carbyn (1975a) reported that howling was most prominent during crepuscular
hours, which may be associated with the departure and arrival of adults at
rendezvous sites (Harrington and Mech 1978a&b).
Population Dynamics
Many processes influence wolf population dynamics, including: habitat limitations
and environmental variation that causes fluctuations in reproduction, dispersal,
age structure of the population, social system and genetics (Paquet and Carbyn
2003). The influence of prey abundance on wolf populations is mediated by
intrinsic social processes such as pack formation, territorialism, exclusive
breeding, deferred reproduction, intraspecific aggression, dispersal, and primary-
prey shifts (Packard and Mech 1980). However, the per capita availability of
ungulate prey is the primary factor influencing population dynamics (Keith 1983,
Messier and Crete 1985, Fuller 1989, Messier 1994, Eberhardt 1998, Eberhardt
7and Peterson 1999). Secondary influences on population dynamics include
disease and the level of human-induced mortality (Murie 1944, Keith 1983, Fuller
1989). Other important influences include habitat availability and arrangement
(e.g., an area large enough to support only 1 pack and that is isolated from
source populations will have different dynamics than an area large enough to
support many packs). Some of the specific findings regarding wolf population
dynamics include the following: productivity declines as per capita prey
availability declines, but significant declines in productivity do not occur until the
availability of prey falls below threshold levels (Boertje and Stephenson 1992).
Harrington et al. (1983) found in one population, where prey was scarce and the
wolf population was declining, there was an inverse correlation between pack
size and litter size, while in a separate population where prey was abundant and
the population was increasing, pack and litter size were positively correlated.
Dispersal
Dispersal movements are important for gene flow and aid in the establishment of
new packs. Dispersal in wolves appears to be a gradual dissociation process. A
study in Minnesota reported up to 6 exploratory moves prior to dispersal (Fuller
1989). As offspring mature, they usually disperse when 1-2 years of age with
few remaining with the pack longer than 3 years of age (Messier 1985b).
Dispersal movements may be directional or nomadic and some evidence
suggests that packs colonize areas that were first pioneered by dispersing lone
wolves (Ream et al. 1991, Plestcher et al. 1991, Plestcher et al. 1997). Yearling
and pup dispersal rates in Minnesota were highest when the population was
increasing or decreasing and low when the population was stable (Gese and
Mech 1991). Dispersing wolves typically establish new territories or join packs
within 50-100 km (31-62 mi) of their natal pack (Fuller 1989, Gese and Mech
1991, Boyd et al. 1995). The time of reported dispersals vary, although January-
February is most common (Paquet and Carbyn 2003). The fate of dispersing
wolves is probably related to their age, the density of the wolf population,
availability of prey, and presence of humans (Fuller 1989, Gese and Mech 1991,
Boyd et al. 1995). In northern Minnesota dispersing adults had the highest
denning and pairing success, yearlings had moderate pairing and low denning
success, and pups had low pairing and denning success (Gese and Mech 1991).
Habitat Use and Home Ranges
Gray wolves are considered a habitat generalist because they require large
home ranges and move long distances and don’t appear to have any habitat
requirements aside from water and prey. Wolves once occurred in all major
habitat types including forests, deserts, grasslands and arctic tundra (Mech 1970,
Fuller et al. 1992, Mladenoff et al. 1995). Although as a species wolves are
considered generalists, populations can be highly adapted to local conditions in
relation to prey selection, den-site use, foraging habitat, and physiography (Fritts
et al. 1995, Paquet et al. 1996, Alexander et al. 1997, Haight et al. 1998,
Mlandenoff and Sickley 1998, Mlandenoff et al. 1999, Callaghan 2002). Factors
that influence habitat use by wolves include: availability and density of prey
8(Carbyn 1974, Keith 1983, Fuller 1989, Huggard 1993, Weaver 1994, Paquet et
al. 1996), snow conditions (Nelson and Mech 1986a), availability of protected
and public lands (Woodroffe 2000), density of domestic livestock (Bangs and
Fritts 1996), road density (Theil 1985, Jensen et al. 1986, Mech 1988, Fuller
1989, Thurber et al. 1994, Alexander et al. 1996, Mlandenoff et al. 1999), human
presence (Mladenoff et al. 1995, Paquet et al. 1996, Callaghan 2002), and
topography (Paquet et al. 1996, Callaghan 2002).
Most wolf packs occupy and defend exclusive, stable home ranges (Mech 1970,
Peterson et al. 1984, Messier 1985b), however in some circumstances home
ranges can be dynamic and nonexclusive (Carbyn 1981, Potvin 1987, Mech et al.
1995, Forshner 2000). Generally, wolves locate their home ranges in areas with
adequate prey and minimal human disturbance (Mlandenoff et al. 1997,
Mlandenoff and Sickley 1998). In mountainous habitat, home range selection
and travel routes are influenced by topography and the use of valley bottoms and
foothills corresponds to the presence of wintering ungulates during periods of
deep snow at higher elevations (Singer 1979, Jenkins and Wright 1988, Paquet
et al. 1996). Territory and home range sizes are primarily a function of pack size,
and pack size increases with prey density (Peterson et al. 1984, Messier 1985b).
Colonizing packs are likely to have larger, more variable home ranges than those
surrounded by other packs (Boyd et al. 1995, Boyd and Plestcher 1999). Home
range sizes for wolf packs in the Rocky Mountains of Canada range from 408 –
1,303 mi2 (1,058 to 3,374 km2) (Paquet 1993), and home ranges of wolf packs in
the Greater Yellowstone Ecosystem range from 35 - 368 mi2 (90 - 953 km2)
(Smith, D. pers comm.).
Food Habits
Wolves are obligate carnivores that feed primarily on ungulates (Weaver 1994).
In addition, wolves will utilize beaver (Castor canadensis), snowshoe hares
(Lepus americanus), other small mammals, and scavenging to supplement
ungulate food sources. In general, wolves utilize prey according to abundance
and vulnerability and are known to prey on virtually every ungulate species in
North America (Paquet and Carbyn 2003). When there is more than one
ungulate species occupying an area, wolves usually preferentially select the
smallest or easiest to catch (Mech 1970, Paquet 1992, Weaver 1994, Paquet et
al. 1996). In general, wolves select individuals that are the most vulnerable (i.e.
old, young or debilitated) from the available ungulate populations (Fuller and
Keith 1980, Carbyn 1983, Paquet 1992). For example, the average age of cow
elk killed by wolves in Yellowstone National Park (YNP) between 1995 and 2001
was 14 years (compared to an average age of 6 years for hunter killed cow elk)
and data obtained by examining fat reserves in the femurs of wolf-killed elk
indicated that 34% had exhausted all fat reserves and likely would not have
survived (Smith et al. 2003). This is consistent with the generally low rate of
hunting success (10-49%) typical for wolves (Mech & Peterson 2003). Given a
low probability of success, it is intuitive that wolves preferentially target animals
that exhibit some vulnerability.
9Kill rates of wolves reported in scientific literature vary widely and Hebblewhite
(2000) concluded that the lack of standardized methods used to estimate kill
rates confounds attempts to compare rates between different studies. In Banff
National Park, Hebblewhite et al. (2003) estimated a kill rate of 0.33 kills / day /
pack with the majority of kills being elk (Cervus canadensis), which was also the
most abundant ungulate. Perhaps the most relevant data to Utah are the kill
rates that have been reported in YNP where Smith et al. (2003) reported that elk
are by far the preferred prey of wolves with an average kill rate of 1.4 elk / wolf /
30 days, or 1 elk every 21 days. A more recent analysis of the kill rates of elk in
Yellowstone covering 2000-2004 indicate that the rate has dropped to 1.1 elk /
wolf / 30 days, or 1 elk every 27 days. This later kill rate is comparable to the kill
rates reported in other studies including: 15-19 deer / wolf / year (Fuller 1989),
7.3 kills / wolf / year on moose and caribou (Ballard et al. 1987), 16 caribou / wolf
/ year (Ballard et al. 1997). Howerver, it is important to point out that almost all
kill studies (including Yellowstone’s) are conducted in winter to simplify tracking,
which corresponds to a time when ungulate condition is poorest. Therefore,
published kill rates are probably maxima, rather than annual means.
Wolf-Prey Relationships
Wolves are efficient predators that preferentially select vulnerable individuals of
large ungulate prey, but are adaptable enough to readily switch to more common
secondary prey species (Paquet and Carbyn 2003). As a species, wolves exhibit
a remarkable plasticity in their ability to use different prey and habitats (Mech
1991, Weaver et al. 1996). Ungulate biomass per wolf is highest in areas where
wolf populations are heavily exploited and lowest in unexploited wolf populations
(Keith 1983, Fuller 1989). Group size, landscape structure, and winter severity
may influence whether wolf predation is density dependent or density
independent, and therefore regulatory or limiting to prey populations. The
functional and numerical responses of wolf populations to prey populations are
complex and are likely influenced by many factors including: availability of
alternative prey, presence of other predators (Messier 1994, Eberhardt 1997,
Eberhardt and Peterson 1999), the size of ungulate herds, and ungulate behavior
(Huggard 1993, Weaver 1994, Hebblewhite 2000). In addition to the influence of
wolf predation on ungulate populations several studies have also documented
impacts of wolves on ungulate behavior, including movement patterns, habitat
use, and spatial distribution (Carbyn 1975a, Mech 1977b, Rogers et al. 1980,
Nelson and Mech 1981, Bergerud et al. 1984, Messier and Barrette 1985, Ballard
et al. 1987, Messier 1994).
Smith et al. (2003) summarized wolf prey relationships in YNP for the first 6
years following reintroduction. Elk are the primary prey of wolves in YNP
accounting for 92% of the kills recorded between 1995 and 2001. Wolf predation
on elk in winter has been highly selective, with calves representing 43% of the
kills while representing only 15% of the elk population. As mentioned above,
wolves have selected very old adults with an average age of cow elk killed of 14
10years (Mech et al. 2001). In addition, wolves in YNP prey on bison (Bison bison)
and moose (Alces alces) although each species represents < 2% of the total
winter diet (Smith et al. 2000). Preliminary results indicate that pronghorn
(Antilocapra americana) fawn survival in YNP is positively correlated with wolf
densities, probably resulting from reduced coyote densities (Smith et al. 2003).
Only one kill of a bighorn sheep (Ovis canadensis) by wolves has been
documented in YNP and very little impact is anticipated because wolves spend
little time in the steep rocky terrain occupied by bighorn sheep. In addition,
wolves in YNP have had very little impact on mule deer (Odocoileus hemionus)
populations, probably because mule deer largely migrate out of the park during
winter months, escaping the period when wolf predation is most intense, and
many mule deer winter in areas that are close to human development, which are
avoided by wolves (Smith et al. 2003).
Interactions with Non-Prey
As top carnivores, wolves likely have substantial influences on other carnivores
in the areas they occupy. However, except for coyotes (Fuller and Keith 1981,
Carbyn 1982b, Meleshko 1986, Paquet 1991, Thurber et al. 1992, Peterson
1995, Arjo and Pletscher 1999) and red foxes (Vulpes vulpes) (Peterson 1995)
interspecific competition between wolves and other carnivores has been the
subject of very little investigation. Smith et al. (2003) summarized the observed
impacts that wolves have had on predators and scavenger populations in YNP
following reintroduction. The presence of wolves in Yellowstone has had
profound impacts on coyote populations including reducing the density by 50%
and reducing pack sizes. Besides coyotes, nine other species have been
observed using wolf kills in Yellowstone; ravens (Corvus corax) and magpies
(Pica pica) visit all kills and many non-winter kills are visited by both black (Ursus
americanus) and grizzly bears (Ursus arctos). Wilmers and Getz (2004)
concluded that the presence of wolves in YNP would benefit scavengers by
providing a more tractable food resource. Cougar (Puma concolor) populations
on the northern range of YNP have been intensively monitored throughout the
period of wolf reintroductions, during which time the cougar population appears
to have been slowly increasing. Interactions between wolves and cougars in
Yellowstone have been rare, probably as result of differences in preferred
habitats, but limited data indicates that cougars avoid wolves and are
subordinate to wolves at kills (Smith et al. 2003).
Ecosystem Level Impacts
Carnivores affect prey directly and indirectly, and ultimately exert an influence
that cascades through the trophic levels of an ecosystem (Estes et al. 2001,
Miller et al. 2001). Through predation, carnivores can reduce numbers of prey
(Schoener and Spiller 1999) and, because prey animals change their behavior to
avoid predation, carnivores also have an indirect effect (Schmitz 1998, Brown
1999). Long-term monitoring data from Isle Royale has shown that predation
affects the number and behavior of moose, which consequently affects forest
11species composition and soil nutrient dynamics (McLaren and Peterson 1994,
Post et al. 1999).
The published literature on wolves demonstrates the complexity of inter-
relationships between wolves, other carnivores, prey species, and the biotic and
abiotic environment. Wolves can function as a “keystone species,” which exists
at relatively low abundance and whose effect on its ecosystem is relatively large
and involves multiple trophic levels (Power et al. 1996, Estes 1996, Soulé et al.
2003). Further, the absence of wolves from their former range may result in
simplification of ecosystems (loss of species diversity) (Soulé et al. 2003).
Recent studies in YNP suggest that wolves have a direct effect upon the
abundance, distribution and age class of aspen and willows because wolf
presence increases the vigilance and movement of large herbivores (Ripple and
Beschta 2004).
Ecological Values
Large predators, such as the gray wolf, may add to the integrity of many
ecosystems (Estes 1996). Interactions between top-level carnivores and prey
species through evolutionary time have shaped and fine-tuned each one
morphologically and behaviorally into what they are today. In the absence of
those functional relationships, ecological systems may be incomplete.
Top-level carnivores may speed up nutrient cycling, provide carrion for other
species, cull sick or weak animals, influence the way prey species use the
landscape (Bescheta 2003, Ripple et. al 2001), and contribute to biological
diversity as exhibited in YNP (USFWS et al. 2003). Broader habitat management
and conservation purposes may also be served by the presence of large
carnivores such as the gray wolf (Fritts et al. 1994).
The Unknown
One of the most fundamental challenges of wolves returning to Utah is the
uncertainty of the outcome. Biologists can only predict the effects of restored
wolf populations on prey populations or other wildlife based on what is known
from other places. The current uncertainty about the nature, cause, magnitude,
and mechanisms of wildlife population fluctuations will be further complicated by
the presence of wolves. Today, wolf-prey relationships are influenced by many
factors, including habitat modification and fragmentation by humans, land
management activities, changes in prey species distribution and numbers,
economics, and social and political factors - all of which, individually, are highly
dynamic. Predator-prey relationships generally, and wolf-prey relationships have
been studied extensively in North America (Mech and Peterson 2003, NRC
1997); yet the results of each study were unique to the study area, as were the
conditions prevailing at the time the research was conducted (e.g. predator
species present, predator density, prey species present, prey density, winter
severity, drought, etc.). Most of the western studies of wolf-prey relationships
have been in situations where elk are the dominant ungulate. The situation in
12Utah will be quite different with our relatively high population of mule deer.
Consequently, obtaining Utah-specific information will be critical to the success of
this plan.
Part II. Historic and Current Status of Wolves in the Intermountain West
History
The gray wolf historically occupied all of the Intermountain West; however, wolf
populations were extirpated from the western U.S. by the 1930s. During 1940-
1973, wolves from Canada occasionally dispersed south into Montana and Idaho
but failed to survive long enough to reproduce. Subsequently, wolves received
legal protection with the passage of the Endangered Species Act (ESA) in 1973
and began to successfully recolonize northwest Montana in the early 1980s. By
1995, there were six wolf packs in northwestern Montana. In 1995 and 1996, 66
wolves from southwestern Canada were reintroduced to Yellowstone National
Park (YNP) (31 wolves) and central Idaho (35 wolves) (USFWS et al. 2004).
These areas were selected for reintroduction due to their remote characteristics,
low levels of human activity, and relatively large populations of wild ungulates.
Current Status and Distribution
The Northern Rocky Mountain wolf population contains three recovery areas: the
Northwest Montana Recovery Area (NWMT) includes northern Montana and the
northern Idaho panhandle. The Greater Yellowstone Recovery Area (GYA)
includes Wyoming and adjacent parts of Idaho and Montana. The Central Idaho
Recovery Area (CID) includes central Idaho and adjacent parts of southwest
Montana. Wolves in the three recovery areas are managed under different
guidelines, depending upon their designated status under the ESA. In 2003,
NWMT wolves were reclassified from endangered to threatened. However, a
recent district court ruling in Oregon reversed the reclassification making wolves
outside of the 10(j) area endangered again. GYA and CID wolves are classified
as nonessential experimental (10(j)) populations; this status allows more flexible
management than an endangered / threatened population. The USFWS,
responsible for administering the ESA, believes that 30 or more breeding pairs of
wolves, with an equitable distribution among the three states for three successive
years, would constitute a viable and recovered wolf population. That criterion was
met at the end of 2002 (Tables 2.1 and 2.2). The current distribution and
population trend of wolves in the three recovery areas is depicted in figures 2.1
and 2.2. If other provisions required for delisting are met, primarily adequate
regulatory mechanisms in the form of state wolf management plans that would
reasonably assure that the gray wolf would not become threatened or
endangered again, the USFWS will propose delisting (removal from protection
under the ESA) of wolves in Idaho, Wyoming & Montana (USFWS et al. 2004).
An additional 10(j) area has been designated for the Mexican gray wolf (Canis
lupus baileyi) in Arizona and Mexico. The reintroduction of Mexican Gray wolves
into their historic range in Arizona and New Mexico began in 1998 with their
current numbers reaching more than 50 animals in the wild. Outside of the
13designated 10(j) area the Mexican gray wolf is listed as endangered under the
ESA.
Prior to the recent court ruling in Oregon the Northern Rocky Mountain wolf
population and the Mexican wolf population were separated into distinct
population segments (DPS) with the boundary following I-70 through Utah. The
court ruling dissolved the DPS designations erasing the I-70 boundary. This
situation may ultimately delay the delisting of wolves and therefore the
implementation of this management plan. Until delisting, any wolves entering
Utah are under the management authority of the USFWS and not subject to this
management plan. Under State regulation wolves are currently listed as a Tier I
(highest level of protection) sensitive species in Utah.
Wolf Management in the Intermountain West
Wolf management in the Intermountain West essentially equates to management
of livestock depredation and the success of wolf management will, in a large part,
be judged by our ability to manage this inevitable conflict. In addition, the
coordination of wolf management with the management of big game will be a
significant factor relative to the success of wolf management in Utah. To a great
extent, the success that managers have had in reestablishing wolves in the
Northern Rockies is a result of a straightforward approach towards managing
wolf-livestock conflicts that both compensates producers for their losses and
provides managers a wide array of tools, ranging from non-lethal deterrent
techniques to lethal control to deal with individual situations. Non-lethal
techniques available to reduce wolf depredation on livestock include: (1) the use
of guarding animals (i.e. dogs, donkeys, mules or llamas) (2) radio-activated
guard (RAG) boxes which are programmed to make loud noises and set-off lights
when a radio-collared wolf is near (3) the use of fladry (perimeter rope of vertical
flagging that in some cases provides a temporary barrier) and (4) the use of non-
lethal ammunition such as rubber bullets or bean bag rounds to haze wolves.
Information on the relative success of these methods is largely anecdotal.
From 1987-2004 there have been 1,600 reported, confirmed wolf depredations
on livestock (429 cattle, 1,074 sheep) and other animals (72 dogs, 25 other),
which have resulted in 117 wolf translocations and 292 lethal wolf removals
(Table 2.3) (USFWS et al. 2004). From 1987-2004, Defenders of Wildlife has
paid $475,771 in 373 separate reimbursements to ranchers for livestock losses
caused by wolves (Defenders of Wildlife 2004) (Appendix 3). However, the
Defenders’ compensation program is not universally accepted and some
livestock producers have opted not to participate. In an effort to better address
the concerns of affected landowners caused by wolves in what USFWS
considers a “biologically recovered wolf population” USFWS has proposed a new
10(j) rule that would provide States and Tribes, that complete federally-approved
management plans, lead management authority for wolves in the experimental
non-essential populations. Currently, Montana and Idaho have approved wolf
management plans.
14Table 2.1 Minimum fall wolf population estimates by recovery area for the Northern Rockies wolf population from
1979 – 2004 (USFWS et al. 2005)
Year: 79 80 81 82 83 84 85 86 87 88 89 90 91 92 93 94 95 96 97 98 99 00 01 02 03 04
Recovery Area
NW Montana 2 1 2 8 6 6 13 15 10 14 12 33 29 41 55 48 66 70 56 49 63 64 84 108 92 59
Yellowstone 21 40 86 112 118 177 218 271 301 324
Central Idaho 14 42 71 114 156 196 261 284 368 452
Total 2 1 2 8 6 6 13 15 10 14 12 33 29 41 55 48 101 152 213 275 337 437 563 663 761 835
15Table 2.2 Estimated number of breeding pairs, by recovery area, for the Northern Rockies wolf population from
1979 – 2004 (USFWS et al. 2005)
Year: 79 80 81 82 83 84 85 86 87 88 89 90 91 92 93 94 95 96 97 98 99 00 01 02 03 04
Recovery Area
NW Montana 1 2 1 1 3 2 4 4 5 6 7 5 5 6 6 7 12 4 6
Yellowstone 2 4 9 6 8 14 13 23 21 30
Central Idaho 3 6 10 10 10 14 14 26 30
Total 1 2 1 1 3 2 4 4 5 8 14 20 21 24 30 34 49 51 66
16Table 2.3 Confirmed wolf depredation and wolf management actions in the Northern Rockies by recovery area,
1987 – 2004 (USFWS et al. 2005)
1987 1988 1989 1990 1991 1992 1993 1994 1995 1996 1997 1998 1999 2000 2001 2002 2003 2004 Total
Northwest Montana
Recovery Area:
Cattle 6 0 3 5 2 1 0 6 3 9 16 9 13 10 8 9 6 6 112
Sheep 10 0 0 0 2 0 0 0 0 0 30 0 19 2 5 13 3 1 85
Other 0 0 0 0 0 0 0 0 0 0 0 0 0 0 4 5 0 1 10
Dogs 0 0 0 1 0 0 0 0 3 1 0 0 2 3 1 4 0 0 15
Wolves
0 0 4 0 3 0 0 2 2 10 7 0 4 0 5 0 0 0 37
Moved
Wolves
4 0 1 1 0 0 0 0 0 4 14 4 9 4 3 9 14 1 68
Killed
Yellowstone Recovery Area:
Cattle 0 0 5 3 4 7 22 33 45 100 219
Sheep 0 13 67 7 13 39 117 71 90 99 516
Other 0 0 0 0 1 0 0 0 10 4 15
Dogs 1 0 0 4 7 8 4 1 0 6 31
Wolves
6 8 14 0 0 6 8 0 0 0 42
Moved
Wolves
0 1 6 3 9 6 9 23 38 54 149
Killed
Central Idaho Recovery
Area:
Cattle 0 2 1 9 16 15 10 10 3 22 98
Sheep 0 24 29 5 57 39 16 15 118 170 473
Other 0 0 0 0 0 0 0 0 0 0 0
Dogs 0 1 4 1 6 0 1 4 6 3 26
Wolves
0 5 0 3 15 10 5 0 0 0 38
Moved
Wolves
0 1 1 0 5 10 7 14 7 30 75
Killed
Total, All 3 Recovery Areas:
Cattle 6 0 3 5 2 1 0 6 3 11 22 21 33 32 40 52 64 128 429
Sheep 10 0 0 0 2 0 0 0 0 37 126 12 89 80 138 99 211 270 1074
Other 0 0 0 0 0 0 0 0 0 0 0 0 1 0 4 5 10 5 25
Dogs 0 0 0 1 0 0 0 0 4 2 4 5 15 11 6 9 6 9 72
Wolves
0 0 4 0 3 0 0 2 8 23 21 3 19 16 18 0 0 0 117
Moved
Wolves
4 0 1 1 0 0 0 0 0 6 21 7 23 20 19 46 59 85 292
Killed
17Figure 2.1 2004 distribution of wolves within the Northern Rockies (USFWS et
al. 2005)
18Figure 2.2 Wolf population trend in the Northern Rockies, 1979 – 2004 (USFWS
et al. 2005)
19Part III. Wolves In Utah
Utah’s Environment and Wolves
Switalski et al. (2002) evaluated potential dispersal corridors for wolves into Utah
from Idaho and Wyoming and potential habitat for wolves in Utah through a
geographic information systems (GIS) analysis. This analysis identified high
connectivity of intact habitat between occupied wolf habitat and the both the Bear
River Range and Flaming Gorge National Recreation Area. The analysis of
potential wolf habitat in Utah concluded that most forested, mountainous habitat
in Utah has the potential to support wolves. However, high road densities
resulted in many areas being classified as only marginal habitat. Despite this, a
number of relatively large potential core areas were identified. Although
valuable, this analysis did not include the potential for conflict with livestock in the
model of potential wolf habitat; wolf-livestock conflict has been the most
significant factor restricting the expansion of wolf populations and the
establishment of new packs in the northern Rocky Mountains.
Wolves moving into Utah will inevitably impact wildlife populations. However the
level and direction of these impacts will likely vary by species. Table 3.1
documents the current trend, status (in relation to management objectives) and
potential impacts of wolves on Utah’s wildlife populations. In addition, wolf
–livestock conflicts are a potential limiting factor to wolf establishment in Utah.
Table 3.2 documents the abundance, trend and distribution of sheep and cattle in
the State.
Potential Economic Impact of Wolves
Switalski et al. (2002) also looked at the potential economic impacts of wolves in
Utah and although the analysis is admittedly incomplete some generalizations
were made. First, other studies (Rosen 1997, Gaillard et al. 1999) suggest that
the presence of wolves in Utah might have a beneficial impact on Utah’s tourism
industry. Second, direct costs associated with having wolves in Utah include: (1)
agencies costs associated with management, (2) livestock losses due to
depredation, and (3) costs associated with reduced hunting opportunities.
Switalski et al. (2002) estimated that the costs associated with wolf management
in Utah would not exceed $130,000 annually and the costs associated with
livestock depredations would be about $47,000 annually based on a wolf
population of 200 animals. However, it is anticipated that there will not be more
than 25 wolves in Utah during the life of this management plan so if these
estimates are accurate, actual costs will substantially lower.
20Table 3.1 Status of Utah’s wildlife communities and the potential impacts of wolves on these communities.
Limiting Factors / Conservation
Species Abundance Distribution Trend Management Objectives Potential Impacts of Wolves
Issues
Ungulates
Little population level impact
Statewide in Habitat loss / degradation, Winter Population: 426,100 expected based on the results of
montane and Kill, Predation, Drought, 5 year: Down Habitat: Conserve / Improve wolf reintroductions in YNP and
Deer 268,180*
shrub-steppe Sagebrush die offs, Private 20 year: Down Recreation: Increased Idaho (Smith et al. 2003), however
habitats property depredation, Disease opportunity and quality local herds could experience
reductions
Statewide in Habitat loss / degradation, Local population reductions
montane and Predation, Drought, Sagebrush die 5 Year: Down assuming wolves in Utah prey
Elk 58,025* Population: 68,400
shrub-steppe offs, Private property depredation, 20 Year: Up primarily on elk as they have in the
habitats Disease Northern Rockies
Little population level impacts
expected although may be a
Habitat availability / suitability, Population: 4,100
Uinta and locally important food source
Habitat loss / degradation, 5 Year: Stable Habitat: Conserve
Moose 3,400** Wasatch based on results in YNP and Idaho
Predation 20 Year: Up Recreation: Increased
Mountains following wolf reintroduction
opportunity and quality
(Husseman and Power 1999,
Smith et al. 2003)
Population: 5,300 Little to no impact expected
Bighorn Statewide within Disease, Predation, Habitat loss / 5 Year: Up Habitat: Conserve / Improve because wolves avoid the rugged
3,460***
Sheep suitable habitat degradation, 20 Year: Up Recreation: Increased habitats inhabited by bighorn
opportunity and quality sheep (Smith et al. 2003)
Population: None
Statewide within 5 Year: Down Habitat: Conserve / Improve
Pronghorn 12,000* Drought, Sagebrush die offs Little to no impact expected
suitable habitat 20 Year: Up Recreation: Increased
opportunity and quality
Predators/ Scavengers
Drought, Habitat loss /
Statewide in Maintain populations and Long term positive impact because
degradation, Livestock conflicts, 5 Year: Stable
Black Bear 3,000 most suitable increase distribution into of increased scavenging
Human conflicts / nuisance, 20 Year: Up
habitat unoccupied suitable habitat opportunities (Smith et al. 2003)
Harvest
Maintain healthy populations
Statewide in Habitat loss / degradation, 5 Year: Down
Cougar 3,000 within existing occupied None expected
suitable habitat Livestock conflicts, Harvest 20 Year: Up
habitat
Statewide in Habitat availability, Prey density, 5 Year: Down
Bobcat No estimate Maintain healthy populations None expected
suitable habitat Harvest 20 Year: Stable
Possible negative impact as a
5 Year: Down
Coyote 100,000 Statewide None None result of interspecific aggression
20 Year: Stable
(Smith et al. 2003)
Positive long term impact as a
5 Year: Unknown
Scavengers No estimate Statewide None identified None result of increased scavenging
20 Year: Unknown
opportunities (Smith et al. 2003)
* 2003 Population estimate, ** 2000 Population estimate, ***1999 Population estimate
21You can also read