Valmet - unique offering with process technology, automation and services - Roadshow presentation February 2022
←
→
Page content transcription
If your browser does not render page correctly, please read the page content below
Valmet – unique offering with
process technology, automation
and services
Roadshow presentation
February 2022

Important notice
The following applies to this presentation, the oral presentation of the information in this presentation by Valmet Oyj (“Valmet” or the “Company”) or any person on
behalf of Valmet, and any question-and-answer session that follows the oral presentation (collectively, the “Information”). In accessing the Information, you agree to
be bound by the following terms and conditions.
Securities laws in the United States and in other jurisdictions restrict Valmet from discussing or disclosing information with respect to the contemplated merger with
Neles Corporation (“Neles”). Information regarding the contemplated merger can be found at www.valmet.com/merger. Until the completion of the merger Valmet and
Neles will carry out their respective businesses as separate and independent companies. The information contained in this presentation concerns only Valmet.
The merger of Valmet and Neles and the merger consideration securities have not been and will not be registered under the U.S. Securities Act of 1933 (the “U.S.
Securities Act”), and may not be offered, sold or delivered within or into the United States, except pursuant to an applicable exemption of, or in a transaction not
subject to, the U.S. Securities Act.
The Information in this presentation is not directed to, or intended for distribution to or use by, any person or entity that is a citizen or resident of, or located in, any
locality, state, country or other jurisdiction where such distribution or use would be contrary to law or regulation or which would require any registration or licensing
within such jurisdiction and it does not constitute an offer of or an invitation by or on behalf of, Valmet, or any other person, to purchase any securities.
The Information contains forward-looking statements. All statements other than statements of historical fact included in the Information are forward-looking statements.
Forward-looking statements give Valmet’s current expectations and projections relating to its financial condition, results of operations, plans, objectives, future
performance and business. These statements may include, without limitation, any statements preceded by, followed by or including words such as “target,” “believe,”
“expect,” “aim,” “intend,” “may,” “anticipate,” “estimate,” “plan,” “project,” “will,” “can have,” “likely,” “should,” “would,” “could” and other words and terms of similar
meaning or the negative thereof. Such forward-looking statements involve known and unknown risks, uncertainties and other important factors beyond Valmet’s control
that could cause Valmet’s actual results, performance or achievements to be materially different from the expected results, performance or achievements expressed or
implied by such forward-looking statements. Such forward-looking statements are based on numerous assumptions regarding Valmet’s present and future business
strategies and the environment in which it will operate in the future.
The Information, including but not limited to forward-looking statements, applies only as of the date of this presentation and is not intended to give any assurances as
to future results. Market data used in the Information not attributed to a specific source are estimates of the Company and have not been independently verified.
Prospective investors are required to make their own independent investigations and appraisals of the business and financial condition of the Company before taking
any investment decision with respect to securities of the Company.

2    February 2022       © Valmet | Roadshow presentation

Agenda
    Valmet roadshow presentation

      1              Valmet in brief

      2              Investment highlights

      3              Financials

      4              Conclusion

3    February 2022       © Valmet | Roadshow presentation
Valmet in brief
We have strong market shares, unique offering and over 220 years
of history
                        Paper                                                 Pulp and                                         Automation                                  Services
                                                                              Energy
                              Market position                                     Market position                                 Market position                             Market position

                                   #1                                               #1–3                                            #1–3                                        #1–2

                               Market share                                        Market share                                    Market share                                Market share

                               ~50%                                              ~20–45%                                            ~25%                                     ~17–18%

    Valmet’s road to becoming a global market leader
      1797 onwards                1951          1968–1996                                         1999                    Key acquisitions            End of 2013          Acquisitions
      Tamfelt, Beloit, KMW,       Valmet        Several M&As, e.g.                                Metso created           Beloit Technology (2000),   Demerger to create   Automation (2015)
      Sunds Defibrator                          KMW (1986),                                       through the merger of   Kvaerner Pulping &          Valmet and Metso     GL&V (2019)
                                                Wärtsilä paper finishing machinery (1987),        Valmet and Rauma        Kvaerner Power (2006),                           J&L (2019)
                                                Tampella Papertech (1992)                                                 Tamfelt (2009)                                   PMP (2020)

5    February 2022       © Valmet | Roadshow presentation
Valmet’s development since 2013

    Orders received                                                     Net sales                                         Comparable EBITA                         Comparable EBITA margin
    (EUR billion)                                                       (EUR billion)                                     (EUR million)                            (%)

    5.0                                                                 5.0                                               500                                      12%

    4.5                                                                 4.5                                               450
                                                                                                                                                                   10%
    4.0                                                                 4.0                                               400

    3.5                                                                 3.5                                               350
                                                                                                                                                                   8%
    3.0                                                                 3.0                                               300

    2.5                                                                 2.5                                               250                                      6%

    2.0                                                                 2.0                                               200
                                                                                                                                                                   4%
    1.5                                                                 1.5                                               150

    1.0                                                                 1.0                                               100
                                                                                                                                                                   2%
    0.5                                                                 0.5                                                50

    0.0                                                                 0.0                                                 0                                      0%
           2013        2015       2017    2019       2021                      2013     2015     2017     2019     2021         2013   2015   2017   2019   2021         2013      2015   2017    2019    2021

          Pulp and Energy, and Paper business lines                           Pulp and Energy, and Paper business lines                Comparable EBITA                         Comparable EBITA margin
          Services and Automation business lines                              Services and Automation business lines

2013 figures on carve-out basis

6         February 2022              © Valmet | Roadshow presentation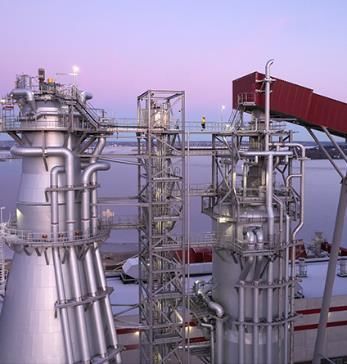
Key figures in 2021

                                                        Orders received by business line   Orders received by area
    Orders received
                                                                                                  11%
    EUR 4,740 million                                                                                               15%

    Net sales                                                                       31%
                                                        36%
    EUR 3,935 million                                                                      16%
                                                                                                                          15%
    Comparable EBITA
    EUR 429 million
    Comparable EBITA margin                                                         8%
    10.9%
                                                                    25%                                 43%
    Order backlog
    EUR 4,096 million
                                                                  Services                          North America
    Employees                                                     Automation                        South America
    14,246                                                        Pulp and Energy                   EMEA
                                                                  Paper                             China
                                                                                                    Asia-Pacific

7    February 2022   © Valmet | Roadshow presentation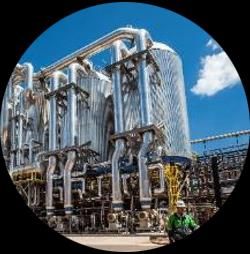
Strong, global presence is a good platform for growth

                                                                   EMEA
                                                                                                                       ~100                98
                                                                   9,296 employees                                 service centers     sales offices

                                                                                               China
                                                                                               1,911 employees

    North America
    1,500 employees
                                                                                                                         43                16
                                                                                                                   production units   R&D centers

                                                                                     Asia-Pacific
                                                                                     935 employees                        8
        South America                                                                                            Performance Centers
        604 employees

Personnel as at December 31, 2021

8       February 2022               © Valmet | Roadshow presentation
Process technology, services and automation
Valmet’s unique offering differentiates the company from its competitors

                                                           Process
                                                         technology

                                                         Customer

                                              Services                Automation

9   February 2022   © Valmet | Roadshow presentation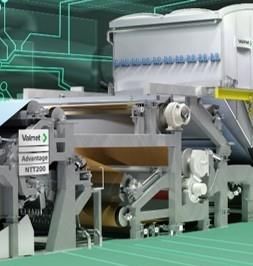
Significant, customer focused research and development work

      R&D focus areas

      •     Advanced and competitive technologies and services
      •     Raw material, water and energy efficiency
      •     Promotion of renewable materials

                     16                              EUR     82    million   ~1,300
            research and                             R&D spending              protected
            development                                in 2021                inventions
               centers                                (2.1% of net sales)

10   February 2022        © Valmet | Roadshow presentation
Acknowledged leader in sustainability
360° approach to sustainability
Good sustainability ratings
In Dow Jones Sustainability
Corporate Sustainable
Index for the eighth citizenship supply chain
consecutive year We are a trusted We develop sustainable
partner and respected supply chain practices
AAA rating in the MSCI ESG corporate citizen
Ratings assessment 2021
Bronze Class 2021
Sustainability Award
Achieved B rating in CDP’s
Sustainable
solutions
360° Health, safety
and environment
climate program ranking 2021 We develop and provide We protect the safety
solutions that support of our people and
In Ethibel Sustainability Index sustainability partners and minimize
our environmental
Excellence Europe impact
People and
performance
We are a responsible
employer and promote
diversity
11 February 2022 © Valmet | Roadshow presentationValmet´s Climate Program: Forward to a carbon neutral future
Targets by 2030 for the entire value chain
SUPPLY CHAIN OWN OPERATIONS USE PHASE OF VALMET’S TECHNOLOGIES
-20% -80% -20% 100%
CO2 emission reduction CO2 emission reduction Further reduced energy use Carbon neutral production
of Valmet’s current technologies
Valmet´s new Climate Program sets credible targets and concrete actions for 2030 for the entire value chain
Program is aligned with the Paris Climate Agreement´s 1.5-degree pathway and UN Sustainable Development Goals and approved
by the Science Based Targets Initiative (SBTi)
Main actions to reach targets by 2030
Target CO2 emission reductions from supply chain
Reduce energy usage and use renewable fuels and CO2 free electricity and district heating in own locations
Improve energy efficiency of our existing process technology offering by 20%
Develop existing and new technologies to enable carbon neutral production for our customers
12 February 2022 © Valmet | Roadshow presentationFinancial targets
Growth Profitability ROCE Dividend policy
Net sales for stable Comparable EBITA: Comparable return on Dividend payout at least
business to grow over 10–12% capital employed (ROCE) 50% of net profit
two times the market before taxes1: >20%
growth
Net sales for capital
business to exceed
market growth
1) Comparable ROCE before taxes = (profit before taxes + interests and other financial expenses +/- items affecting comparability) / (balance sheet total - non-interest-bearing liabilities (average for the period))
13 February 2022 © Valmet | Roadshow presentationInvestment highlights
Investment highlights

     1         Strong position in the growing market of converting renewables

     2         Widest technology and services offering combined with automation excellence

     3         Services: The widest offering and strong geographical presence

     4         Automation: Maximizing efficiency and safety of our customers

     5         Paper: World-class technology for packaging and hygiene needs

               Pulp and Energy: Strong business with high market share and flexible cost
     6
               structure

     7         Systematically building the future

15       February 2022   © Valmet | Roadshow presentation
Strong position in the growing market of converting renewables 1
Paper Board Tissue Pulp Energy Automation Services
#1 0.4 ~ -2% #1 1.0 ~ 2-3% #1 0.7 ~ 3-4% #1-2 1.5 ~ 1% #1-3 2.0 ~ 1% #1-3 2.1 ~ 1% #1-2 8.0 ~ 1-2%
EUR bn p.a. EUR bn p.a. EUR bn p.a. EUR bn p.a. EUR bn p.a. EUR bn p.a. EUR bn p.a.
Increasing role of digital World trade, e-commerce Rise in purchasing power Growing demand for Decarbonization in energy Aging machines and Increasing pulp, tissue,
media decreases demand for and emerging markets and living standards sustainable packaging, production installed automation board and energy
print papers growth drive packaging Urbanization and improved tissue, hygiene products Biomass and residual systems production
Demand for technology Demand for light weight hygiene and textiles waste used in heat and Investments in new pulp Customer demand for
driven efficiency board Fast economic growth in Increasing environmental process steam production and paper production lines resource efficiency,
improvements Shift from plastic packaging emerging markets awareness and stricter Tightening air emissions and industrial productivity, end-product
Need for specialty papers to renewable materials regulations legislation and stricter decarbonization quality, industrial internet
Demand for higher quality services and reduced
Conversions from paper to Fiber-based plastic directives Demand for raw material
Consumers’ higher hygiene replacement savings, process environmental impact
board habits
Demand for second efficiencies and Customer focus on core,
generation bioethanol sustainability decreasing own resources
Demand for Industrial and outsourcing of non-
Internet based solutions core operations
driven by customer Size and gradual aging of
digitalization installed base and capacity
increases
Closures and conversions
of non-competitive
production lines
5% of net sales 16% of net sales 9% of net sales 19% of net sales 8% of net sales 9% of net sales 35% of net sales
# Market positon | Estimated market size for current offering (EUR) | Anticipated long-term market growth For paper, board and tissue market position and estimated market size calculated as average during 2018-2020.
For pulp, energy and automation the market position and estimated market size calculated based on 2020 figures.
For services, the market position calculated from 2020 and estimated market size once the market recovers from the
16 February 2022 © Valmet | Roadshow presentation temporary negative impact of COVID on customer operations and services demandWidest technology and services offering combined with 2
automation excellence
Paper Pulp Energy
• Board, paper and tissue production lines • Wood and pulp handling • Heat and power generation
• Rebuilds • Fiber processing • Air emission control
• Stand-alone products • Recovery • Biofuels
Process
technology
Services Customer Automation
• Spare parts and components • Distributed Control Systems (DCS)
• Maintenance and shutdown services • Quality Management Systems (QMS)
Services Automation
• Outsourcing services • Analyzers and measurements
• Production consumables • Industrial Internet solutions
• Process support and optimization
17 February 2022 © Valmet | Roadshow presentationServices: The widest offering and strong geographical presence 3
Services business line
Widest offering to support customers’ all service needs Services business line
Orders received (EUR million)
Benefits from growing installed base
Strong geographical presence close to customers 1,459 1,488
Organic
1,315 1,356 growth
Steady increase in market share from 13% in 2014 to 1,182
1,242 ~4%
17-18% in 2020 1,119 CAGR in
1,055 2014-2019
Targeting to grow with the market and by winning further
market share
Opportunities to win new customers and increase share
of wallet with existing customers
2014 2015 2016 2017 2018 2019 2020 2021
18 February 2022 © Valmet | Roadshow presentationAutomation: Maximizing efficiency and safety of our customers 4
Automation business line
Solutions range from single measurements to plant-wide Automation business line
process automation systems Orders received (EUR million)
Designed to maximize safety, sustainability and efficiency 468 Organic
of customers’ businesses 416 415
growth
386 85 ~7%
Securing future competitiveness with R&D 368 57 81 CAGR
337 56
51
Strong track record since acquired to Valmet in 2015 38
Several drivers for future growth
– Increasing direct sales to customers
359 381
– Package sales with Valmet’s capital equipment 317 330 334
299
– Replacing competitors’ installed base and entering new industries
– Growing in automation services
2016 2017 2018 2019 2020 2021
19 February 2022 © Valmet | Roadshow presentation Includes internal orders received and net sales from other Valmet business lines (in light green).Paper: World-class technology for packaging and hygiene needs 5
Paper business line
Offering includes world-leading technology and products Paper business line
for board, tissue and paper making Orders received (EUR million) Net sales (EUR million)
Long-term growth supported by favorable 1,694
megatrends 1,195
1,035 1,077 1,043 1,029
– Growing e-commerce and packaging needs 937 913
1,076
784
– Increasing demand for hygiene products 671 673 718 659 647
528
High market share
Technological advantage and excellent
2014 2015 2016 2017 2018 2019 2020 2021 2014 2015 2016 2017 2018 2019 2020 2021
references
R&D targeted to introduce new products and improve the Capacity
2015 2020
Market Market
costs share position
existing offering
EUR million 270 301 Board ~50% #1
Flexible organization and low capacity cost % of net sales 41% 28% Tissue ~35% #1
provides resilience to market fluctuations Paper ~50% #1
20 February 2022 © Valmet | Roadshow presentationPulp and Energy: Strong business with high market share and 6
flexible cost structure
Pulp and Energy business line
Offering includes full pulp mills and energy solutions for Pulp and Energy business line
biomass and emission control Orders received (EUR million) Net sales (EUR million)
Long-term growth supported by favorable 1,344
1,125
1,178
megatrends 939
1,000
934 956 913 919
1,003 1,036
864 826 800 863
– Growing demand for sustainable packaging and hygiene products and
678
textiles
– Replacing plastic with fiber-based materials
High market share
Technological advantage by focusing on R&D 2014 2015 2016 2017 2018 2019 2020 2021 2014 2015 2016 2017 2018 2019 2020 2021
Flexible organization and low capacity cost provides
Capacity Market Market
resilience to market fluctuations costs
2015 2020
share position
Yearly variations in orders received are typical due to EUR million 218 196 Pulp ~45% #1-2
% of net sales 24% 20% Energy ~20% #1-3
timing of large orders
21 February 2022 © Valmet | Roadshow presentationSystematically building the future 7
Customer Technology Process People
Valmet’s way to serve: Develop new products Continue to improve Continuous development
Lifecycle collaboration and technologies project management of employees through
between the customer and project execution training programs
and Valmet Improve product cost
competitiveness Valmet’s climate Building capabilities
Add value to customers program targeting to globally
through Industrial Increase material and reduce emissions in the Continue to improve
Internet solutions energy efficiency and whole value chain safety and lower LTIF1
further develop solutions
Ensure strong market to reduce carbon
position in capital footprint
business
Continue to increase
market share in the
stable business
1) LTIF = Lost time incident frequency.
22 February 2022 © Valmet | Roadshow presentationFinancials
Key figures

 EUR million                                                                   Q4/2021            Q4/2020            Change             2021   2020    Change

 Orders received                                                                  1,093                940               16%           4,740   3,653     30%

 Order backlog1                                                                   4,096              3,257               26%           4,096   3,257     26%

 Net sales                                                                        1,199              1,167                3%           3,935   3,740      5%

 Comparable EBITA                                                                   147                146                0%             429    365      18%

        % of net sales                                                           12.2%              12.5%                              10.9%   9.8%

 EBITA                                                                              155                147                6%             448    355      26%

 Operating profit (EBIT)                                                            143                135                6%             399    319      25%

        % of net sales                                                           11.9%              11.6%                              10.1%   8.5%

 Earnings per share, EUR                                                            0.67              0.67               -1%            1.98    1.54     28%

 Return on capital employed (ROCE) before taxes2                                                                                        24%     22%

 Cash flow provided by operating activities                                           96               114              -15%             482    532      -9%

 Gearing1                                                                                                                               -7%     13%

Items affecting comparability: EUR 8 million in Q4/2021 (EUR 0 million in Q4/2020), EUR 19 million in 2021 (EUR -10 million in 2020)
Valmet’s investment in Neles had a positive impact on EBITA of EUR 4.3 million in Q4/2021 and EUR 14.2 million in 2021
Valmet’s investment in Neles had a positive impact on operating profit of EUR 1.8 million in Q4/2021 and EUR 1.1 million in 2021
1) At end of period
2) Annualized
24    February 2022         © Valmet | Roadshow presentation
Comparable EBITA margin1 at target level
Net sales and Comparable EBITA (EUR million and %)1
3,935
3,740
3,547 10.9%
3,325 Target 10–12%
3,058 9.8%
2,928 2,926 8.9%
2,473 7.7% Capital Business
7.1%
6.7%
6.2%
Stable business
1,832 2,079 2,230
4.3% 1,473 1,584 1,799
1,572 1,715 1,705 Comparable
1,661
1,484 1,453 1,474 1,525 EBITA %
1,357
989
2014 2015 2016 2017 2018 2019 2020 2021
Comparable EBITA,
106 182 196 218 257 316 365 429 (EUR million)
• In Q4/2021, net sales and Comparable EBITA remained at the previous year’s level compared with Q4/2020
1) Valmet implemented IFRS 15 – Revenue from Contracts with Customers as of January 1, 2018 by applying full retrospective method. Thus, figures presented are not fully comparable.
25 February 2022 © Valmet | Roadshow presentationGuidance and short-term market outlook
Guidance for 2022
Guidance Valmet estimates that net sales in 2022 will increase in comparison with 2021 (EUR 3,935 million)
and Comparable EBITA in 2022 will increase in comparison with 2021 (EUR 429 million).
Short-term market outlook
Q1/2021 Q2/2021 Q3/2021 Q4/2021
Services Satisfactory Good / Satisfactory Good Good
Automation Good Good Good Good
Pulp Good Good Good Good
Pulp and Energy
Energy Weak Weak Weak Satisfactory
Board and Paper Good Good Good Good
Paper
Tissue Good Good Satisfactory Satisfactory
The short-term market outlook is based on customer activity (50%) and Valmet’s capacity utilization (50%) and is given for the next six months from the end of the respective quarter. The scale is ‘weak–satisfactory–good’.
26 February 2022 © Valmet | Roadshow presentationDividend proposal
Dividend policy
• Dividend payout at least 50% of net profit
Board of Directors’ dividend proposal to the Annual General Meeting
• EUR 1.20 dividend per share, which represents 61% payout ratio
Dividend per share (euro)
1.20
0.80 0.90
0.55 0.65
0.35 0.42
0.15 0.25
2013 2014 2015 2016 2017 2018 2019 2020 2021
(proposal
by the BoD)
27 February 2022 © Valmet | Roadshow presentationConclusion
Conclusion

     1         Strong position in the growing market of converting renewables

     2         Widest technology and services offering combined with automation excellence

     3         Services: The widest offering and strong geographical presence

     4         Automation: Maximizing efficiency and safety of our customers

     5         Paper: World-class technology for packaging and hygiene needs

               Pulp and Energy: Strong business with high market share and flexible cost
     6
               structure

     7         Systematically building the future

29       February 2022   © Valmet | Roadshow presentation
Important notice It should be noted that certain statements herein which are not historical facts, including, without limitation, those regarding expectations for general economic development and the market situation, expectations for growth, profitability and investment willingness, expectations for company development, growth and profitability and the realization of synergy benefits and cost savings, and statements preceded by “anticipates”, “believes”, ”estimates”, “expects”, ”foresees” or similar expressions, are forward-looking statements. Since these statements are based on current decisions and plans, estimates and projections, they involve risks and uncertainties which may cause the actual results to materially differ from the results currently expressed. Such factors include, but are not limited to: 1) general economic conditions, including fluctuations in exchange rates and interest levels which influence the operating environment and profitability of customers of the company or economic growth in the company’s principal geographic markets. 2) industry conditions, intensity of competition situation, especially potential introduction of significant technological solutions developed by competitors, financial condition of the customers and the competitors of the company, 3) the company’s own operating factors, such as the success of production, product development and project management and the efficiencies therein including continuous development and improvement 4) the success of pending and future acquisitions and restructuring. 30 February 2022 © Valmet | Roadshow presentation
You can also read