Water Resource Collaboration Group - 2021 Water Conservation Recommendations for the City of Spokane
←
→
Page content transcription
If your browser does not render page correctly, please read the page content below
Water Resource
Collaboration Group

2021 Water Conservation
Recommendations for the City of
Spokane
Introduction
The Water Resource Collaborations Group (WRCG) is a technical advisory group consisting of
volunteer community members with a background in water resource management,
hydrology, and ecology. City Council authorized the WRCG by resolution on July 27th, 2020.
In that same resolution, 2020-0051, the City adopted its first Water Conservation Master
Plan which set a per capital water reduction target of 5% over a period of 10 years.
At the time, City Council envisioned that the next version of our conservation plan would
include more robust conservation goals as well as both voluntary and mandatory drought
response measures. To make this vision possible for the City, Council tasked the WRCG to put
forth a series of recommendations.
Specifically, City Council asked the WRCG to form recommendations in three areas: the City’s
ten-year conservation targets, additional conservation measures to be included in the next
version of the Water Conservation Master Plan, and mandatory drought reduction measures
to prepare for the possibility of future droughts.
In order to maximize public input on water conservation, the WRCG established public
outreach and education priorities early in their process. WRCG recommendations are based
on a series of public workshops and survey responses conducted over a four-month period
in early 2021.

Why We Conserve Water
We conserve to…
1. Protect the health of our river
     ◦   Community identity
     ◦   Economic vibrancy for our community
     ◦   Recreational benefits
     ◦   Preserve the ecological integrity of the river ecosystem

2. Ensure a sustainable supply of drinking water
3. Protect people and wildlife
4. Avoid water waste
5. Save money on infrastructure and at the meter.
Water efficiency is reducing water
  waste and protecting water quality

 A lot of hard work goes into providing the water coming out of
our tap every day. Wasteful water practices are unnecessary and
can have significant direct and indirect costs. By reducing waste,
we are reducing the costs required to pump the water to our
homes and businesses as well as the costs to treat the water.
 By making just a few small changes to daily routines, we can
save a significant amount of water, money, and preserve water
supplies for the future by simply reducing waste.
Wasted water on the roadways picks up surface pollutants from
cars and other sources and may be carried into our aquifer and
river.
The Aquifer & Our River

                     Photo Credit: Charlie Gurche
The Spokane Valley
Rathdrum Prairie
Aquifer
“The sole source of water for most people in
Spokane County, Washington and Kootenai
County, Idaho, is a large underground rocky
formation containing high-quality water called
the Spokane Valley-Rathdrum Prairie Aquifer
(Aquifer), and it is also commonly known as
the “Rathdrum-Spokane Aquifer.” Discovered
in 1895, this Aquifer has become one of the
most important resources in the region,
supplying drinking water to more than 500,000
people.
“Our Aquifer underlies about 370 square miles in two states. It has one of the fastest flow rates in the United States, flowing as
much as 60 feet per day in some areas. In comparison, a typical aquifer has a flow rate between 1/4-inch and five feet per day.
The volume of the entire Aquifer is about 10 trillion gallons, making it one of the most productive aquifers in the country ”

                                                                                                 - The SVRP Aquifer Atlas
While the aquifer is prolific it is limited by many factors which
we will explore throughout this report.
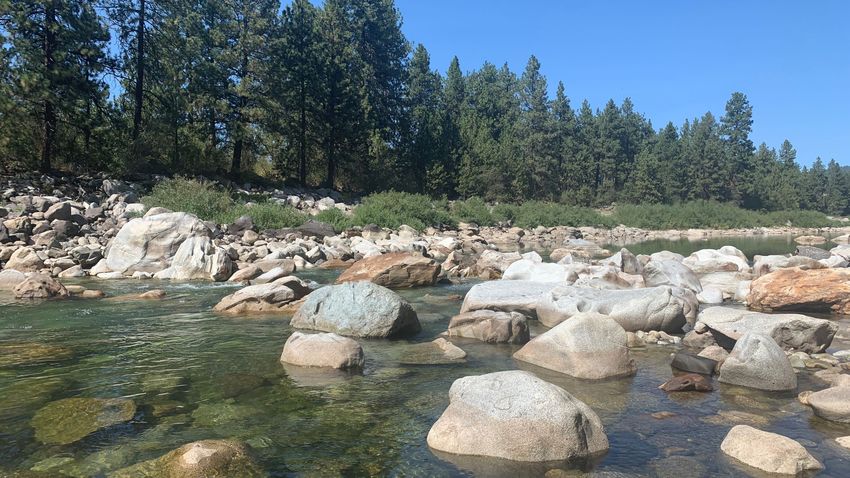
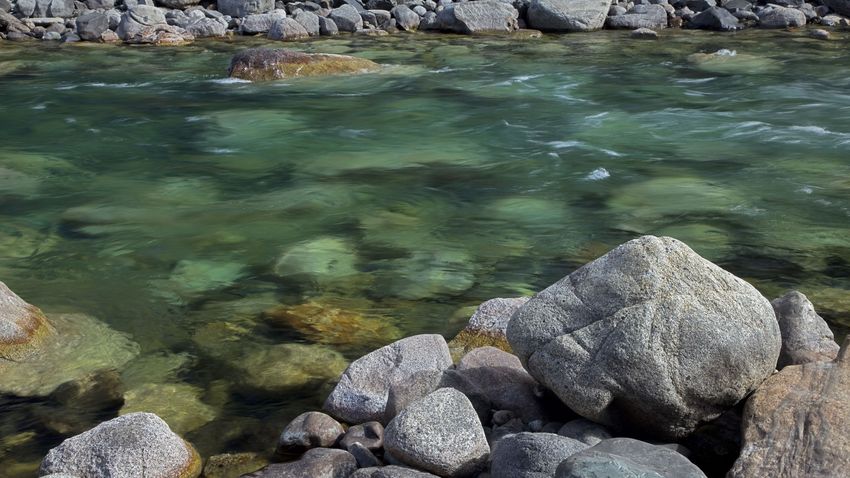
The Spokane River
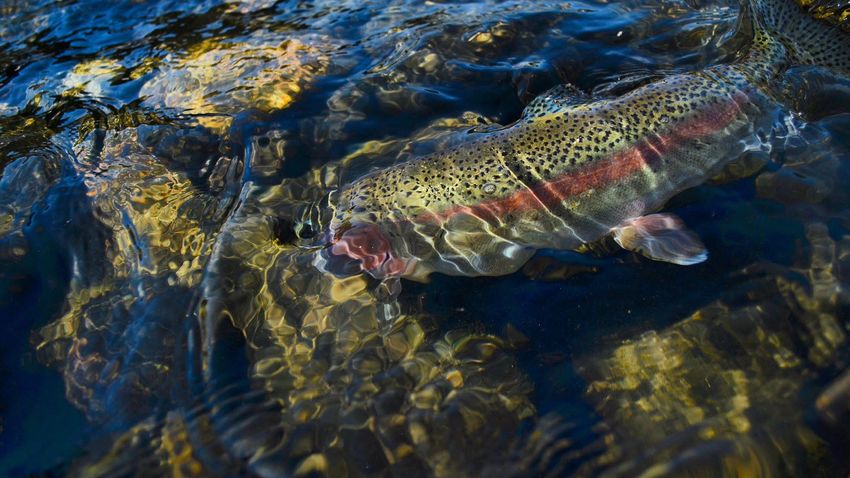
“From Lake Coeur d'Alene to its confluence with the Columbia, the Spokane
River travels 111 miles of varied and often spectacular terrain-rural, urban, in
places wild. The river has been a trading and gathering place for Indigenous
peoples for thousands of years. With bountiful trout, accessible swimming holes,
and challenging rapids, it is a recreational magnet for residents and tourists
alike.”
– Paul Lindholdt, “The Spokane River”
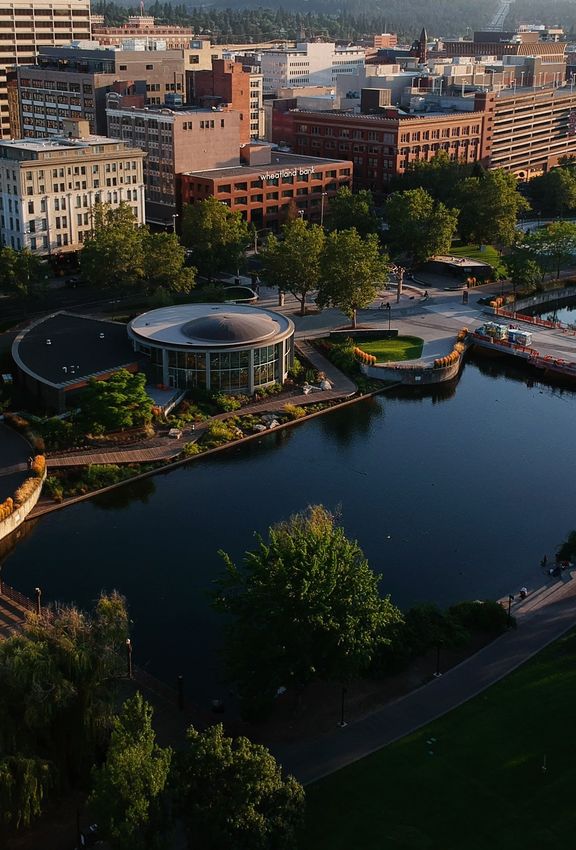
The Spokane River defines our region. It provides an aesthetic beauty cherished
by residents and visitors alike. The river also provides life to a variety of native
wildlife and ecosystems while providing a myriad of recreational opportunities
throughout the year. The social, economic, and environmental health of our
region depends on protecting this valuable natural resource.
Photo Credit: Austen Frostad
The Aquifer and the River are Interdependent

Image Source: Spokane
Valley Rathdrum Prairie
Aquifer Atlas
                                                                                                                                                          aquifer

   aquifer

   The Spokane River sits on top of the aquifer as it runs from Lake Coeur d’Alene west towards the Columbia. At times along the river’s journey, the river
   gains water from the aquifer where the water table is high. At other times, the river loses water into the aquifer at places along the river’s path where
   the water table is below the riverbed.

   From the time the river exits Lake Coeur d’Alene until approximately Flora Road in Spokane Valley, the river loses water to the aquifer, this is called the
   ‘losing reach’. A losing reach is where the water table of the aquifer is lower than the bottom of the river. Gravity together with the porous ground of the
   riverbed pulls the water into the aquifer and less water flows on the surface. The river starts gaining water from the aquifer as it flows through the
   center of Spokane. However, over the last several decades, increases in groundwater pumping and growth in population throughout the aquifer area is
   reducing river gains during critical times of the year where temperatures and pumping are at their seasonal high.

   Pumping water intercepts ground water that would otherwise feed the river, reducing the amount of water the river gains. This means less water in the
   river for fish, wildlife, and people living in the Spokane region and downstream.

   Sources: USGS and WA Dept of Ecology
Conservation & Economics
Conservation reduces
                                                                                                                         infrastructure costs
                                                                                                                         Water utilities face growing water demand due to population growth,
                                                                                                                         higher operating costs, and aging infrastructure.
Peak Demand Capacity

                                                                                                                         In addition, the City provides water to customers in the water service area
                                                                                                                         while maintaining reliable service, high water quality, and managing
                                                                                                                         wastewater discharge.

                                                                                                                         Water -efficiency programs are a sound return on investment for water
                                                                                                                         utilities. Using water more efficiently saves money, reduces stress on
                                                                                                                         water systems and the environment, and preserves water supplies for
                                                                                                                         future generations.

                                                                                                                         For just about every water supplier, it is a matter of when—not whether—
                                                                                                                         to add capacity. In this context, water-efficiency measures taken today
                                                                                                                         help communities defer capacity investments and/or reduce the size of
                                                                       Year                                              the expansion needed. This reduces costs for everyone.

                       Source: Water Conservation Programs – A Planning Manual (M52), American Water Works Association
Using less water keeps costs down over time The costs of updating aging water systems and investing in new technologies are the primary drivers of most rate increases. Using less water keeps those costs down over time. By stretching the lifespan of supply sources, water agencies can avoid or delay the costs of securing new supplies; building and maintaining new infrastructure; and treating more water and wastewater. Tucson, AZ: Thirty years of conservation reduced per-person-per-day use from 188 gallons to 130 gallons. Without this reduction, Tucson would have needed to invest $350 million in new infrastructure to deliver and treat more water and wastewater. Because these costs were avoided, rates are at least 11.7 percent lower today, and customers save an average of $112 annually on their water bills. Gilbert, AZ: Two decades of water conservation brought water use down by 29 percent from 244 gallons to 173 gallons per person per day. Gilbert and its ratepayers have avoided just under $341 million in water and wastewater treatment expenses. Thanks to conservation, Gilbert customers pay rates that are 5.8 percent lower than they would be without conservation. Westminster, CO: Thanks to conservation, the volume of water used per person per day declined by 17%, even as the population more than doubled from roughly 52,570 to 106,114 people. If the peaking factor had not been reduced by 30%, Westminster would have had to expand system to accommodate an extra 52 million gallons per day. Developing the additional water treatment infrastructure to meet these higher demands would have required a capital investment by the City of approximately $130,000,000.
Washington State Water Rates

                                                                                   Purveyor website Data, Residential Single Family Within City Rates, 2019
           WA DOH Water System Data
                                                                                                         Consumption Charge Tiers by Increasing Usage
                                                           Bi-                    Units                                          3rd
                                                         monthly Monthly Meter included in 1st Step 1st Step 2nd Step 2nd Step Step 3rd Step 4th Step 4th Step Example month
                                                 Total    Basic   Basic   size,   Basic     Usage, Rate, Usage,        Rate, Usage,       Rate,    Usage, Rate, bill, ERU 359 gpd
      WS Name          Region       County       Conn    Service Service inches Service?     units   $/unit    units   $/unit   units    $/unit     units $/unit     ~ 15 units
SEATTLE PUBLIC
UTILITIES **         Northwest KING             173833               $ 17.15     3/4        No    0-5     $ 5.41   6 - 18   $ 6.69    > 18   $11.80                      $ 111.10
TACOMA WATER
DIVISION CITY OF     Northwest PIERCE           138239               $ 24.76     5/8        No    0-5     $ 2.01      >5    $ 2.51                                        $ 59.92

VANCOUVER CITY OF Southwest      CLARK          104798               $ 8.53      5/8        No     >0     $ 2.22                                                          $ 41.83
SPOKANE CITY OF * Eastern        SPOKANE         85259               $ 17.72                No    0-6     $ 0.34   7 - 12   $ 0.72 13 - 25   $ 0.96   26-45   $ 1.24      $ 25.92
ALDERWOOD WATER
DISTRICT          Northwest      SNOHOMISH       76297    $ 31.73    $ 15.87     5/8         4   5 - 14   $ 2.51 15 - 30    $ 3.04    > 30   $ 3.66                       $ 52.74
BELLEVUE CITY OF  Northwest      KING            66090    $ 48.11    $ 24.06     5/8        No   0 - 11   $ 3.77 11 - 17    $ 4.79   17-45   $ 6.29    > 45   $ 8.98      $ 90.30
YAKIMA WATER
DIVISION CITY OF  Eastern        YAKIMA          27638    $ 21.68    $ 10.84     3/4        No      >0    $ 1.80                                                          $ 37.84
WHITWORTH WATER
DISTRICT 2        Eastern        SPOKANE         11849               $ 21.00                10 11 - 37    $ 0.38 37 - 140   $ 0.50   > 140   $ 0.61                       $ 22.90
PULLMAN WATER
DEPARTMENT, CITY
OF **             Eastern        WHITMAN         11637               $ 24.25     3/4         5    6-8     $ 2.56   9 - 20   $ 2.76    > 20   $ 4.58                       $ 51.25

      * City of Spokane rates are up to date as of Dec 2021; all other data is from 2019
     ** Summer Rates
Economic Impact of
Recreation
Few cities can claim a natural asset that puts the business district in touch with fishing,
biking, hiking, and paddling within face-washing distance of a thundering waterfall. A
healthy Spokane River supports a thriving recreation industry.
A study by ECONorthwest quantified the economic impacts of the Centennial Trail, a
nearly 40-mile paved trail located in Spokane County in eastern Washington. It follows the
Spokane River and extends from the Washington/Idaho border, through Liberty Lake, City
of Spokane Valley, City of Spokane, Riverside State Park, and Nine Mile Falls. Washington
State Park visitor statistics estimate that approximately 1.5 million pedestrian and biking
trips occur on the Centennial Trail every year, many of which are likely repeat users, such
as commuters or neighborhood residents.
Trail users support local economies by spending money on transportation, lodging, and
equipment. An economic model of local economies was used to produce estimates of the
total economic contributions and jobs supported by the Centennial Trail. These results
include both the direct impacts of spending, as well as the indirect and induced impacts
of increased local economic activity.
A clean, healthy river provides residents much needed refuge from summer heat. The
dozens of public access points along the river offer Spokane area residents and visitors
equitable access to the river and the health benefits it provides.
Values are realized
annuallyTrends & Impacts
Photo Credit: Sean ZenishekClimate Trends
Spokane’s climate is warming. In 2021, the National Weather Service measured a 0.4 degree
Fahrenheit increase above the thirty-year average from the previous decade in Spokane.
Climate projections indicate that Spokane temperatures will continue to increase throughout
this century, with greater increases experienced over the summer months. Additionally,
climate data in our region is showing a trend of increasing summer drought.
Analysis of climate data by the Spokane Climate Project indicates that shifts in timing and type
of precipitation, particularly in the winter months, will have a significant impact on our River
throughout the year.
“When precipitation falls as snow it can contribute to snowpack, a critical natural water storage
system for our region. Snowpack, especially mountain snowpack, delays the timing of the water
entering a stream system. Conversely, when winter precipitation falls as rain, that water enters
the stream system immediately. This leads to a decrease in the amount of water stored in the
mountains as snow that would otherwise enter the stream system later during the spring and
summer months. As a result, more water flows out of the watershed earlier in the year, leading
to earlier and longer summer-low flows in rivers and streams.”
Spokane River - 8/23/05
Upstream from Sandifur Bridge
600 cubic feet per second (CFS)
Sources: National Weather Services, Spokesman Review, Spokane Climate ProjectPer capita Water Use This graph illustrates per capita water use throughout the U.S..
Per capita water use is a measure of how many gallons each
person uses daily, on average.
The axis on the bottom indicates the per capita daily water use in
gallons.
The left axis shows frequency, or the number of counties that fall
into a particular per capita use. The blue bars show the number of
counties in each per capita water use range. The most common
Spokane County water usage is 80 gallons of water per person per day. The second
235 gallons per person most common water use average is 70 gallons per person per day.
per day In other words, people in the U.S. use 80 gallons of water per day,
on average.
98th percentile
nationally Spokane County per capita water use is 235 gallons per person
per day. Within the city of Spokane, people use, on average,
202 gallons per day.
The cumulative percentages on the right, where the orange line
and red line cross, indicates that residents of Spokane County use
more water than 98% of the country, and 155 gallons more per
day per person than the national mean.
Source: Version 2.0: Dieter, C.A., Linsey, K.S., Caldwell, R.R., Harris, M.A., Ivahnenko, T.I., Lovelace, J.K., Maupin, M.A., and Barber,
N.L., 2018, Estimated use of water in the United States county-level data for 2015 (ver. 2.0, June 2018): U.S. Geological Survey data
release, https://doi.org/10.5066/F7TB15V5.Pumping Impacts River Health
Just as we are pumping more water from the SVRP aquifer to water
our lawns during the summer, the river flows are at their lowest. It is
during this time that the river needs water the most.
Sources: Washington Dept. of Ecology datasets for the SVRPA Modelling Team, 2007 and
Spokane at Spokane gaging data, USGS NWIS, extracted 2020Pumping Impacts the River
The relationship between water withdrawals from the Aquifer and flow
rates in the Spokane River (Summer 2015)
• Light blue line shows summer fluctuation in air temperature
• Dark blue line shows rate of pumping from the Aquifer due to
summer peak demands for irrigation
• Green line shows decreasing flow rate in the Spokane River
during summer months as measured in downtown Spokane. You
can see that when pumping increases in June, river flows
decrease; when pumping slows in late August, flows begin to
increase.
• Red line shows discharge from the Post Falls Dam. In drought
years like 2015, Avista maintains the minimum 500 cubic feet per
second (cfs) flow rate in the river
• Pink arrow shows how reduced pumping from the aquifer is
associated with increased flows in the Spokane River, despite
constant discharge from Post Falls Dam
The pink arrow on this graph highlights as city pumping decreases at the
end of August, flows in the Spokane River increase. This is because the
Aquifer and the Spokane River are connected. With wise water use, we Graph credit: John Covert. (2018, Feb 27). Healthy River Healthy Spokane [Conference
can keep water in the river and improve river health. presentation]. Water Quality Forum, Spokane, WA, United States.
https://vimeo.com/257950229Pumping Trends
As we grow and demand more water, late summer
River flows get less water from the aquifer. The
September average shows:
• Prior to 1960, in dry years, late summer flows
in the Spokane River gained 400 cfs from the
Aquifer.
• Since 1960, the River seldom gains as much as
400 cfs from the aquifer.
• Since 2000, it’s quite common that the River
gets zero flow (as indicated by the red dotted
Source: USGS data analyzed by Guy J. Gregory, L.G., L.Hg. line) from the Aquifer.WRCG Recommendations
Amplify the
     Existing Plan
In 2020, the City of Spokane adopted its first Water
Conservation Master Plan. The 2020 plan contains all the
elements of a good water conservation plan, however,
due to limited resources dedicated to conservation
efforts, the plan’s reduction targets were extremely low.

In a region where water use is higher than 98% of the
United States, we think Spokane can do better! The
following pages outline the WRCG recommendations to
increase conservation within the city to ensure long-term
sustainability of our natural ecosystems and to lessen
additional economic impacts to our residents.

This donut chart shows the primary strategies of our
existing plan. The four strategies below the graphic
highlight key components of the existing plan the WRCG
wants to see amplified by increases capacity and
resources into the program.
                                                                                                       Expand on
                                                                            Provide free   Expand on
                                                                                                        existing
                                                            Focus on high      water        existing
                                                                                                        Spokane
                                                             water users    consults and   WaterWise
                                                                                                         Scape
                                                                             incentives     program
                                                                                                        program
New Conservation Target: 25% by 2030 Achieve annual pumping reduction of 25% from 2015-2019 average by 2030. City of Spokane Per capita daily National percentile Percent Reduction Water Use use (in gallons) ranking * from baseline Baseline* 202 97 Existing Target 191 97 5% Proposed Target 151 94 25% Baseline refers to the 2020 per capita daily water use within the city limits. The county per capita daily use is 235 gallons which is in the 98th percentile nationwide; the city per capita daily use is 202 and is in the 97th percentile nationwide. County data is from a 2015 US Geological Survey report. City data provided by the City of Spokane Water Department. * Source: Version 2.0: Dieter, C.A., Linsey, K.S., Caldwell, R.R., Harris, M.A., Ivahnenko, T.I., Lovelace, J.K., Maupin, M.A., and Barber, N.L., 2018, Estimated use of water in the United States county-level data for 2015 (ver. 2.0, June 2018): U.S. Geological Survey data release, https://doi.org/10.5066/F7TB15V5.
Staffing Recommendations
The 2020 conservation target of 5% reduction over ten years is based on existing staffing resources of 2
fulltime employees. Currently, the City employs one full time Water Conservation Coordinator and one
Water Efficiency Specialist who focuses on providing support for SpokaneScape. For the City of Spokane
to make meaningful progress on water conservation, the City will need more staff capacity. The WRCG
recommends:
    •     1 FTE Water Conservation Coordinator
    •     2 FTE Water Efficiency Technicians – expertise in both residential and commercial systems is
          needed
    •     1 FTE Education and Outreach Specialist

For comparison, the City of Flagstaff has 1/3 of Spokane’s population and staffs 5-6 full time employees
in their Water Conservation office. Their water consumption is currently 84 gallons/per person/per day
compared to Spokane’s 202 gallons. Over the past ~30 years, Flagstaff has reduced their water
consumption by 50%.

For Spokane, a 25% reduction in pumping will result in cost savings to the City in terms of energy and
resource use, and in infrastructure avoidance costs. More analysis needs to be done to identify more
accurate cost benefits to the City.
Policy Recommendations
The WRCG recommends the following City policy changes be made in order to effectively reduce water
consumption.
1. Adopt efficient irrigation and landscaping design standards for new construction and large
renovations
2. Adopt drought response measures
3. Require highest water users in each sector (residential, commercial, municipal) participate in
City’s free water audit program or to provide alternative conservation plan
4. Consider updating plumbing code standardsResidential Program Recommendations
1. Create program for on-site technical assistance:
Prioritize top 10-20% of high water uses
Provide free water audits
Offer on-site solutions for leak detection and repairs
Create program for low-income residents to repair leaks
2. Improve reporting on water bill
Make it easier for customers to truly understand their monthly water usage
Add messaging that compares water use in the neighborhood, city, country
3. Accelerate smart water meter roll-out for real-time system monitoring
4. Offer incentives for Flume or similar leak detection devices, including purchase via water bill –
Flume program – might be good for Spokane (Water Dept is already exploring this).
5. Offer incentives for on-demand water heaters at hot water fixturesCommercial Program Recommendations
1. Develop a Commercial Water Efficiency Program to provide technical guidance with primary focus
on Top 50 Commercial Water Users
Expand current strategy to include technical water audits
Provide custom incentives/rebates based on water audit findings
2. With current staffing levels, it is recommended the City seek the assistance of a technical
consultant to work with City staff to initiate an effective program. The consultant should:
Develop a Commercial Water Efficiency Program framework and methodology.
Provide technical water audit training to City Conservation staff.
Apply the Program methodology to key properties.
Fine tune the Program methodology based on Program outcomes.
Transition a fully functional Program to City Conservation staff for inhouse operation.
3. Increase Water Conservation Staffing levels to maintain Water Efficiency Program as a City service.
Successful conservation programs typically have 1 manager to oversee and direct
conservation programs and between 2-4 technicians to provide program services.Ongoing Education & Outreach
1. Ensure E&O messaging includes education on the following key points:
a. How pumping impacts our aquifer and river
b. More emphasis on the following solutions:
Simple, easy to follow irrigation & landscaping suggestions – current suggestions are overwhelming for people who are
not looking to remove turf or make major changes
Leak detection devices (indoor & outdoor)
Weather-based irrigation devices
2. Update e-bill messaging (new system coming fall 2021) – this is a big opportunity. Many people who attended the water workshops
said that messaging was not reaching them. The e-bill program should include solutions for higher water users and to provide visibility
on where people fit within their neighborhood or the city in terms of water use.
a. Make water data available for download – this allows people to import their water use into software/apps to track their
conservation over time
b. Consider purchasing or creating software to make usage more visible. You cannot improve what you cannot measure
c. Automatically include the following in all bills:
River flows – build awareness on current river flow status using USGS flow status from Spokane Gage
If you are a high-water user, you automatically get sent information on how to conserve, check for leaks, participate in
free water audit, rebates, etc.
3. The WRCG has gathered dozens of recommendations on conservation E&O. A comprehensive list of feedback and ideas will be
provided to the Water Conservation Coordinator to consider for implementation into their current messaging.Drought Response Measures
Drought Response Option 1

                            Option 1 incrementally curtails outdoor water
                            use depending on the drought type, with the
                            goal of changing citizens behavior to
                            voluntarily adopting water conservation
                            practices. River flows and determinations
                            from the WA Dept. of Ecology (ECY) are used
                            as triggers to define drought type. All river
                            flows (cubic feet per second, CFS) are
                            measured at the USGS gauge located near
                            Monroe St. Bridge (USGS 12422500 Spokane
                            River at Spokane, WA).
Drought Response Option 2
Option 2 is the same as option 1 but with
greater consideration given to river flows,
adding a mid-summer trigger at 1250 CFS.
Fewer actions are “required” until the
drought type is severe or extreme. River
flows and determinations from the WA
Dept. of Ecology (ECY) are used as triggers
to define drought type. All river flows
(cubic feet per second, CFS) are measured
at the USGS gauge located near Monroe
St. Bridge (USGS 12422500 Spokane River
at Spokane, WA).
This is the WRCG’s preferred option.Drought Response Option Option 3 uses simplified definitions of drought type. This option encourages citizens to change water use behavior, recognizing that Spokane is more likely to experience drought conditions more frequently into the future. River flows and determinations from the WA Dept. of Ecology (ECY) are used as triggers to define drought type. All river flows (cubic feet per second, CFS) are measured at the USGS gauge located near Monroe St. Bridge (USGS 12422500 Spokane River at Spokane, WA)
Success Stories

                  Photo Credit: chooseflagstaff.com
Flagstaff, AZ – 50% Conservation
Flagstaff shares many similarities to Spokane in terms of climate and water resources.
Key Points The city of Flagstaff has four distinct seasons and is home to the largest contiguous
ponderosa pine forest in the United States. As cities of the intermountain west, both rely
• Per capita daily water use = 84 on snowpack for much of their drinking water. Under a changing climate, both cities are
gallons expected to see diminishing snowpack and hotter, drier summers that will impact human
health, increase wildfire risk, and stress water demand.
• Since 1988, residents of Flagstaff Since 1988, Flagstaff has reduced water use by 50%! Some of that reduction is attributed
have reduced their water use by to changes in plumbing code and building upgrades over time. However, the City was
50% able to avoid costly infrastructure upgrades due to decreases to outdoor water use.
• Permanent every other day In the 1980s, Flagstaff established an every-other-day watering code which went into
effect permanently in 2000. At first, watering every other day was a drought response,
watering and daytime water ban but it proved too confusing when the City tried to implement it during a crisis.
in place
In addition to the every-other-day watering restriction, people cannot water from 9am -
• Flagstaff has approximately 1/3 5pm. Those two things have drastically reduced outdoor water use. Since 2000,
the population of Spokane yet Flagstaff’s water system has never been near capacity. Before 2000, they were close to
employs 3 times as many water capacity (90%) nearly every summer. This drastic reduction in water use avoided millions
of dollars of infrastructure costs to the City and ultimately the residents.
conservation staffSalt Lake City, UT Much like Spokane, single-family homes in SLC consume the largest amount of water in comparison with other subclassifications. Over the last twenty years, conservation efforts in the residential sector have been primarily voluntary, Key Points and account for a 29% reduction in residential water use since 2001. Currently, the city is working to upgrade meters with Advanced Metering Infrastructure • Per capita daily water use = 206 that will provide more real-time water usage data for customers to guide and gallons track effectiveness of conservation efforts. Several outreach and educational programs have been ongoing, including a best management practices guide • Since 2000, residents of SLC have for water efficient and low impact landscaping, low-water plant database, and lawn sprinkler check-ups. reduced their water use by 28% Policies that have contributed to SLC’s water conservation efforts include two • SLC’s irrigation audit program key ordinances. A Water Shortage Contingency Ordinance and Plan were provides site-specific irrigation enacted in 2003, which allows the mayor to enact water shortage stages based on projected water supply. Stages include both voluntary and schedules, systems, and activities mandatory actions for municipal customers to meet specified reduction to improve landscape watering targets. A water efficient landscaping ordinance for all new or expanded development was established in 2014, including best management practices efficiency, typically resulting in a to reduce water waste in landscaping and park strips. 30% reduction in water use Economic incentives, including water audits and rebates, are were introduced following implementation of in 2021 to encourage further water conservation for both commercial and recommendations residential water use.
Santa Barbara, CA
                                      Santa Barbara’s water conservation program began in the 1970s as a drought response
                                      and has been augmented many times since as a result of prolonged drought. A city
            Key Points                ordinance adopted in 1989, prohibits the waste of water including activities that cause
                                      runoff beyond a property’s boundaries, failure to repair leaks within 72 hours after
•   In 2020, per capita daily water   notice by the city, and irrigating during the 48 hours following a measurable rainfall
    use = 91 gallons                  event. A tiered rate structure was also introduced in 1989, to incentivize reduced water
                                      use. Standardized allotments for residential customers are based on type of building
•   Since 2009, residents of Santa    (single- or multi-family) and number of dwelling units. Allotments for commercial and
                                      industrial customers are based on historical off-peak usage. In 2016, the city enacted a
    Barbara have reduced their        Water Shortage Contingency Plan that contains four stages of action to reduce water
    water use by 30%                  consumption during times of drought or water shortages.

•   Warm-Summer Mediterranean         Like Spokane, over 70% of the City of Santa Barbara water service area are residential
                                      customers. Santa Barbara provides the public with information on how to conserve
    Climate (semi-arid); average      water. The city provides free Water Checkup appointments to assess water usage on
    annual precipitation 19 inches    residents’ properties, evaluate irrigation systems, check for leaks, and provide
                                      recommendations on improving water efficiency indoors and outdoors.
    compared to Spokane’s 16.5
    inches in a similar climate       Santa Barbara provides water budgets for customers with dedicated irrigation meters.
                                      Budgets are based on landscaped area, water requirements of plants, and current
                                      weather conditions. Customers going over budget are billed at a higher rate. The city
                                      also provides multiple rebates for water efficient fixtures, appliances, irrigation systems;
                                      and water wise landscaping or mulching.
Gilbert, AZ – Residential Water Audits
In an effort to reduce water usage and make conserving water an easier process,
the Gilbert water conservation team has a water efficiency checkup program free
of charge for residents. As part of the program, a trained water conservation
Key Points
specialist evaluates the irrigation system, checks for water leaks, and offers • Per capita daily water use = 173
customized recommendations for increased water savings at your home. Learn gallons
more here: https://www.gilbertaz.gov/departments/public-works/water-
conservation
• A Water Efficiency Checkup saves
Initial savings: Prior to an efficiency checkup, the average water consumption per an average of almost 50,000
home was 250,000 gallons per year (gpy). After one year in the program, the gallons.
average water consumption dropped to 205,000 gpy. Keep in mind, 250,000
gpy does not reflect the typical home water use in Gilbert. Most residents who • The savings continue for at least
request a Water Efficiency Checkup do so because their water consumption is 5 years.
higher than usual. The Water Department also reaches out to homes that have a
high water use occurrence to help reduce waste.
• Gilbert's Water Checkup program
The Gift that Keeps Giving: In addition, an assessment of the water usage at includes site-specific irrigation
homes in the program for five years found that, on average, 9,081 kgals of water schedules, systems, and activities
was saved consistently per year, following the Water Efficiency Checkups. to improve landscape watering
efficiency.Next Steps (2022)
The City of Spokane adopted an update to their Sustainability
Action Plan (SAP) in October of 2021. Many of the
recommendations outlined in this report are included in this
plan. The SAP can be found at https://my.spokanecity.org/sas
Members of the WRCG have been invited to continue providing
recommendations on City water policy through participation in
the Sustainability Action Subcommittee
The WRCG will have an opportunity to provide input into the
City’s water systems planning that is underway in 2022-2023
Spokane City Council will continue seeking recommendations on
water stewardship – any comments or questions can be directed
to sas@spokanecity.orgYou can also read