Water Resources Program - Delaware River Basin Commission FY 2020- 2022 March 11, 2020
←
→
Page content transcription
If your browser does not render page correctly, please read the page content below
Delaware River
Basin Commission

Water Resources
   Program

 FY 2020- 2022

     March 11, 2020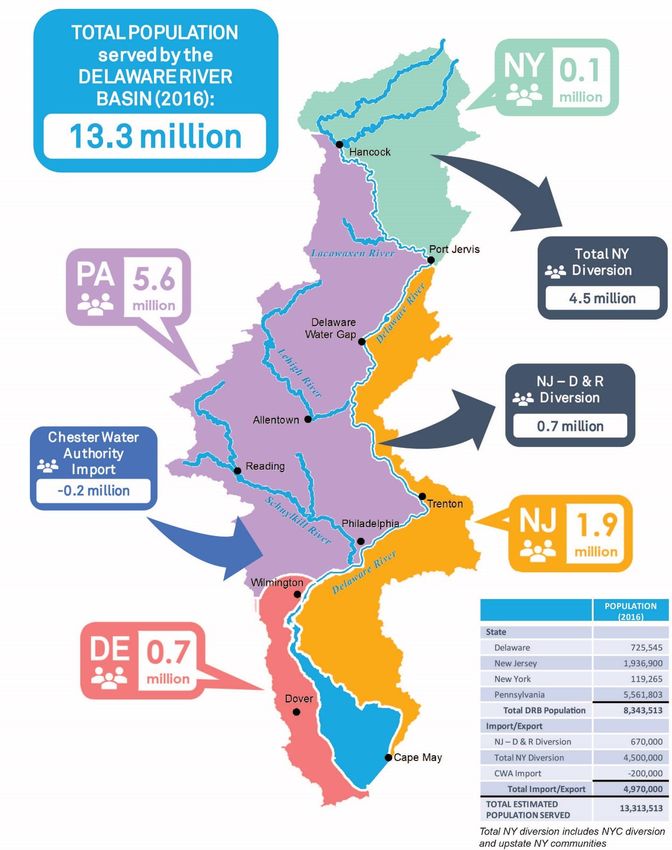
DRBC Water Resources Program FY 2020 - 2022

Authorization
The Delaware River Basin (DRB) Compact states:
The commission shall annually adopt a water resources program, based upon the comprehensive plan,
consisting of the projects and facilities which the commission proposes to be undertaken by the commission
and other authorized governmental and private agencies, organizations and persons during the ensuing six
years or such other reasonably foreseeable period as the commission may determine. (§ 3.2 DRB Compact,
1961)
According to the Compact, "Project" shall mean any work, service or activity which is separately planned,
financed, or identified by the commission, or any separate facility undertaken or to be undertaken within a
specified area, for the conservation, utilization, control, development or management of water resources
which can be established and utilized independently or as an addition to an existing facility, and can be
considered as a separate entity for purposes of evaluation (§1.2.(g)).

Vision, Mission and Values
Vision:
The Delaware River Basin Commission (DRBC) will provide trusted, effective, and coordinated
management of our shared water resources.
The vision of the Delaware River Basin Commission is built upon the Compact signed in 1961 by Delaware,
New Jersey, New York, Pennsylvania, and the federal government. It is defined in the Delaware River
Basin Compact as, “the conservation, utilization, development, management and control of water and
related resources of the Delaware River Basin under a comprehensive multipurpose plan will bring the
greatest benefits and produce the most efficient service in the public welfare.”

Mission:
The DRBC will “develop and effectuate plans, policies and projects relating to the water resources of the
Basin” through:
    •     Watershed-based planning and management
    •     Effective, efficient, and coordinated regulatory programs
    •     Policies and practices informed by science
    •     Collaboration with and among our state and federal signatory partners
    •     Adaptive and innovative water resource management
    •     Public education and outreach
    •     Public and stakeholder input
    •     Dedicated and engaged staff in a high performing workplace

To accomplish this mission, the Commission will continue to lead and collaborate with the signatory parties
to: protect and improve water quality; manage river flows to meet diverse and at times conflicting Basin
needs; reduce damage caused by floods; provide for the reasonable and sustainable development and use
of surface and ground water; and promote water conservation and efficiency.

Values:
The DRBC will be guided in its mission by the following core values:
•   Service: to the public, the regulated community and our DRBC colleagues.
•   Respect: for each other, the public and the Basin’s water resources.
•   Professionalism: defined by high ethical standards, integrity, continuous improvement, and
    accountability.

Adopted March 11, 2020                           2
DRBC Water Resources Program FY 2020 - 2022

Scope and Organization
The Water Resources Program (WRP) covers fiscal years (FY) 2020 through 2022 (July 1, 2019, through
June 30, 2022) and is an element of strategic planning for DRBC program direction over the next three
years. The architecture is based on the requirements of the Delaware River Basin Compact (Compact) and
the goals of the Key Result Areas of the Water Resources Plan for the Delaware River Basin (Basin Plan
2004).

The Program is presented in two parts:

Section l: Conditions summarizes water resource conditions in the Basin, including hydrologic conditions,
water use and sufficiency, overall assessment of water quality, landscape conditions, and emergent issues
that could affect long-range water resource planning and management in the Basin.

Section II: Work Program notes the key issues that focus the Commission’s programs and summarizes
by Key Result Area the initiatives the Commission plans to undertake over the next three years.

Adopted March 11, 2020                         3
DRBC Water Resources Program FY 2020 - 2022

List of Acronyms/Abbreviations
7Q10          7-day average, one-in-ten years
AA            Administrative Agreement
ACCC          Advisory Committee on Climate Change
ACWA          Association of Clean Water Administrators
AEMR          Annual Effluent Monitoring Report
AWRA          American Water Resources Association
AWWA          American Water Works Association
BG            billion gallons
C&D           Chesapeake and Delaware (Canal)
CA2           Critical Area 2
CaCO3         calcium carbonate
CBOD          carbonaceous biochemical oxygen demand
CCMP          Comprehensive Conservation and Management Plan
cfs           cubic feet per second
CWMS          Corps Water Management System
CY            calendar year
CZM           Coastal Zone Management
D&R           Delaware and Raritan
DGS           Delaware Geological Survey
DNREC         Delaware Department of Natural Resources and Environmental Control
DO            dissolved oxygen
DOC           dissolved organic carbon
DRB           Delaware River Basin
DRB-PST       Delaware River Basin Planning Support Tool
DRBC          Delaware River Basin Commission
DWCF          Delaware Watershed Conservation Fund
ECL           Environmental Conservation Law
EFDC          Environmental Fluid Dynamics Code
EIC           Estuary Implementation Committee
EPA           Environmental Protection Agency
EWQ           Existing Water Quality
EWS           Early Warning System
FAC           Flood Advisory Committee
FFMP          Flexible Flow Management Program
FY            fiscal year
GIS           Geographic Information System
GWPA          Groundwater Protected Area
HEC-HMS       Hydrologic Engineering Center - Hydrologic Modeling System
HUC           Hydrologic Unit Code
IBI           Index of Biological Integrity
ICWP          Interstate Council of Water Policy
IWA           International Water Association
IWAAs         Integrated Water Availability Assessments
LNG           liquefied natural gas
MACC          Monitoring Advisory and Coordination Committee
mg/L          milligrams per liter
MGD           million gallons per day
mi            mile
MLR           multiple linear regression
mm            millimeters
MWh           megawatt hour
NBOD          nitrogenous biological oxygen demand
NFWF          National Fish and Wildlife Foundation
NGWMN         National Ground-Water Monitoring Network
NJDEP         New Jersey Department of Environmental Protection
NJWSP         New Jersey Water Supply Plan
NOAA          National Oceanic and Atmospheric Administration
NOAA-CSC      National Oceanic and Atmospheric Administration - Coastal Services Center
NPDES         National Pollutant Discharge Elimination System
NPS           National Park Service
NRDA          Natural Resource Damage Assessment
NWS           National Weather Service
NYC           New York City
NYSDEC        New York State Department of Environmental Conservation

Adopted March 11, 2020                              4
DRBC Water Resources Program FY 2020 - 2022

PADEP              Pennsylvania Department of Environmental Protection
PAFBC              Pennsylvania Fish and Boat Commission
PAS                Planning Assistance to States
PCB                polychlorinated biphenyls
PFC                perfluorinated compound
PFAS               perfluoroalkyl and polyfluoroalkyl substances
PFNA               perfluorononanoic acid
PFOA               perfluorooctanoic acid
PFOS               perfluorooctanesulfonic acid
PMP                Pollution Minimization Plan
ppb                parts per billion
PPL                Pennsylvania Power and Light
PRM                Potomac-Raritan-Magothy (aquifer system)
PWS                Public Water Supply
RFAC               Regulated Flow Advisory Committee
REF-DSS Riverine   Environmental Flow Decision Support System
RFP                Request for Proposal
RSM                Regional Sediment Management
SAN                Schuylkill Action Network
SEF                Subcommittee on Ecological Flows
SEPA GWPA          Southeast Pennsylvania Groundwater Protected Area
SPW                Special Protection Waters
SRMP               Scenic Rivers Monitoring Program
STAC               Science and Technical Advisory Committee
TAC                Toxics Advisory Committee
TDS                total dissolved solids
TMDL               Total Maximum Daily Load
TNC                The Nature Conservancy
USACE              United States Army Corps of Engineers
USEPA              United States Environmental Protection Agency
USFWS              United States Fish and Wildlife Service
USGS               United States Geological Survey
WAUSP              Water Availability and Use Science Program
WMAC               Water Management Advisory Committee
WPF                William Penn Foundation
WQAC               Water Quality Advisory Committee
WQM                Water Quality Management
WRP                Water Resources Program
WRRDA              Water Resources Reform and Development Act
WSCC               Water Supply Coordinating Council
WSSF               Water Supply Storage Fund
WTP                water treatment plant

Adopted March 11, 2020                                  5
DRBC Water Resources Program FY 2020 - 2022

Table of Contents
AUTHORIZATION ................................................................................................................................................... 2
VISION, MISSION AND VALUES .............................................................................................................................. 2
SCOPE AND ORGANIZATION .................................................................................................................................. 3
LIST OF ACRONYMS ............................................................................................................................................... 4
TABLE OF CONTENTS.............................................................................................................................................. 6
I.         GENERAL STATEMENT OF CONDITIONS IN THE BASIN .................................................................................... 8
      A.     HYDROLOGIC CONDITIONS : JULY 2018 – JUNE 2019 ...................................................................................................8
           i.            Rainfall ..........................................................................................................................................8
           ii.           Reservoir Conditions and Management .........................................................................................8
           iii.          Groundwater Conditions ................................................................................................................9
      B. WATER USE AND SUFFICIENCY ................................................................................................................................13
        i.               Population Served ........................................................................................................................13
        ii.              Water Withdrawals and Trends ...................................................................................................15
        iii.             Cumulative Thermoelectric Withdrawals and Consumptive Use .................................................16
        iv.              Public Water Supply Withdrawals ................................................................................................18
        v.               Industrial Withdrawals ................................................................................................................20
        vi.              Seasonal Variation in Withdrawals and Consumptive Use ..........................................................20
        vii.             Ecological (Instream) Flow Needs ................................................................................................21
        viii.            Conditions in Special Groundwater Management Areas .............................................................21
        ix.              Areas of Concern: PRM and Bayshore Watersheds .....................................................................25
        x.               National Groundwater Monitoring Network ...............................................................................28
        xi.              General Statement of Basin Supply Sufficiency ............................................................................28
      C. SURFACE WATER QUALITY......................................................................................................................................29
        i.               Surface Water Quality Assessment ..............................................................................................29
        ii.              State of the Basin 2019: Water Quality .......................................................................................29
        iii.             2018 Delaware River and Bay Water Quality Assessment ...........................................................30
      D. POPULATION AND LANDSCAPE.................................................................................................................................34
      E. EMERGENT ISSUES ................................................................................................................................................37
        i.               Hydraulic Fracturing ....................................................................................................................37
        ii.              Linear Infrastructure (Pipelines, Electric Transmission Lines) ......................................................37
        iii.             Other Energy Issues ......................................................................................................................37
        iv.              Changing Climate .........................................................................................................................37
        v.               Perfluorinated Compounds ..........................................................................................................37
        VI.              Atlantic sturgeon (Acipenser oxyrinchus) .....................................................................................38
        vii.             Increasing Chloride Trends ...........................................................................................................38
        viii.            Micro Plastics ...............................................................................................................................38
        ix.              Cyanobacteria ..............................................................................................................................39
II.        WATER RESOURCE MANAGEMENT .............................................................................................................. 40
      A.     GOALS AND PRIORITIES ..........................................................................................................................................40
      B.     WATER RESOURCE MANAGEMENT WORK PROGRAM ..................................................................................................41
           Special Section: Hydraulic Fracturing ...................................................................................................................41
           Section 1:     Ensuring the Sustainable Supply of Suitable Quality Water.........................................................42
           Section 2:     Waterway Corridor Management................................................................................................58
           Section 3:     Linking Land and Water Resource Management .........................................................................61

Adopted March 11, 2020                                                           6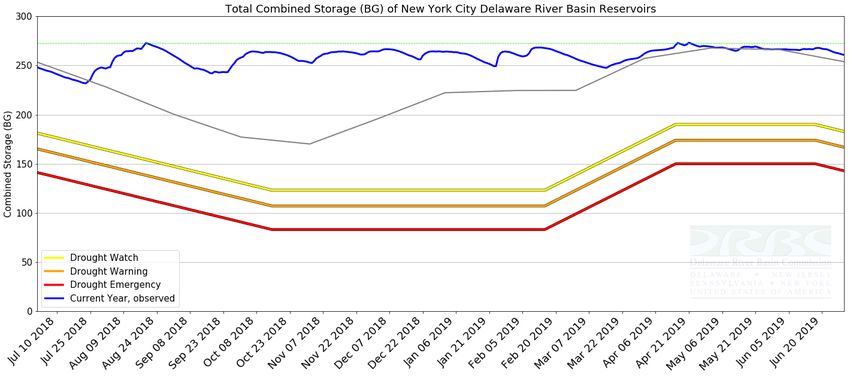
DRBC Water Resources Program FY 2020 - 2022

    Section 4:   Institutional Coordination and Cooperation ................................................................................63
    Section 5:   Education and Outreach for Stewardship ....................................................................................68

Adopted March 11, 2020                                     7
DRBC Water Resources Program FY 2020 - 2022
I. General Statement of Conditions in the Basin
A. HYDROLOGIC CONDITIONS : JULY 2018 – JUNE 2019
i. Rainfall
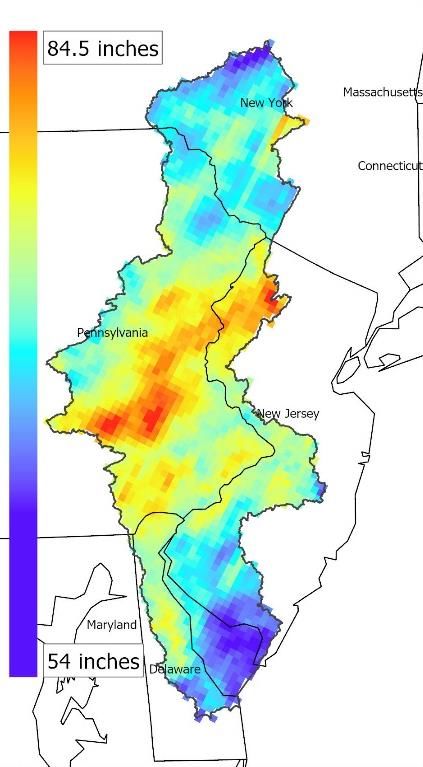
Throughout the basin, rainfall for the period from July 2018 through June
2019 ranged from 54 inches to 84.5 inches. Figure 1 presents the range
of rainfall amounts in the Basin. The higher amounts were more
concentrated in the middle of the basin. These rainfall amounts were
above normal for the entire basin. Some areas in the middle of the basin
received over 80 inches of rain. Departures from normal ranged from 9 to
40 inches.
ii. Reservoir Conditions and Management
Combined storage in the three New York City (NYC) reservoirs, located
in the upper basin, is presented in Figure 2 below. In July of 2018, the
storage was below the median value. By the middle of August 2018, the
reservoirs were at capacity due to high amounts of precipitation. The
storage then remained above the median for the remainder of 2018
through June of 2019.
Due to the high flows throughout much of the year, water was not required
to meet the Montague Flow Objective, except for a short period in July
of 2018. The volume of water that was required was 3,945 million
Figure 1. Rainfall in the Delaware gallons. No releases were required from the NYC DRB reservoirs to
River Basin, July 2018-June
2019. meet the Trenton Equivalent Flow Objective.
In the Lower Basin, Beltzville and Blue Marsh Reservoirs maintained
normal storage during the 365-day period ending June 30, 2019. The DRBC was not required to make
releases from Lower Basin reservoirs to maintain the streamflow objective of 3,000 CFS at Trenton, NJ.
Figure 2. New York City’s Delaware River Basin Storage, July 2018-June 2019.
Adopted March 11, 2020 8
DRBC Water Resources Program FY 2020 - 2022

iii. Groundwater Conditions

Pennsylvania

Groundwater levels in five selected USGS county observation wells were used to represent Pennsylvania’s
groundwater conditions during July 2018 - June 2019. The individual wells were selected based on their
geographic locations in the Pennsylvania portion of the DRB: Wayne County WN 64 (northern), Schuylkill
County SC 296 (western), Lehigh County LE 644 (central), Bucks County BK 1020 (eastern), and Chester
County CH 10 (southern).
The Wayne County and Schuylkill County observation wells (Figures 3 and 4) were below the historical
median at the start of July 2018. Groundwater levels then rose in August and remained above normal
through January of 2019. Levels remained normal or just above normal for the remainder of the report
period. In mid-April, the water levels in the Schuylkill well were close to being below normal.
Water levels in both the Lehigh County and Bucks County observation wells (Figures 5 and 6) were above
normal for most of the report period, with the exception of June 2018 when levels were in the low end of
the normal range. The Bucks County well levels had large fluctuations throughout the year and approached
below normal conditions for most of April 2019.
The water level in the Chester County well (Figure 7) was in the normal range for July and then reached
and remained above normal through June of 2019.

Figure 3. USGS well in Wayne Co., PA. July 2018-June 2019 Observed Daily Mean (black line) vs. Historical Statistics.

Adopted March 11, 2020                                  9
DRBC Water Resources Program FY 2020 - 2022

Figure 4. USGS well in Schuylkill Co., PA. July 2018-June 2019 Observed Daily Mean (black line) vs. Historical Statistics.

Figure 5. USGS well in Lehigh Co., PA. July 2018-June 2019 Observed Daily Mean (black line) vs. Historical Statistics.

Adopted March 11, 2020                                  10
DRBC Water Resources Program FY 2020 - 2022

Figure 6. USGS well in Bucks Co., PA. July 2018-June 2019 Observed Daily Mean (black line) vs. Historical Statistics.

Figure 7. USGS well in Chester Co., PA. July 2018-June 2019 Observed Daily Mean (black line) vs. Historical Statistics.

New Jersey

The water level in the Cumberland County coastal plain well (Figure 8) was normal from July through
September of 2018. The ground water level then increased to above normal for the remainder of the report
period.

Adopted March 11, 2020                                 11
DRBC Water Resources Program FY 2020 - 2022

Figure 8. USGS well in Cumberland Co., NJ. July 2018-June 2019 Observed Daily Mean (black line) vs. Historical Statistics.

Delaware

Groundwater levels in Delaware (Figure 9) were similar to those in the rest of the basin, starting off below
average. After October of 2018, levels greatly increased and remained above average for the remainder of
the year, decreasing slightly towards the end of the period. The well finished out the report period around
normal conditions.

Figure 9. USGS well in New Castle County, DE. July 2018 – July 2019 Observed Depth. (Data Source: Delaware Geological
Society)

Adopted March 11, 2020                                 12
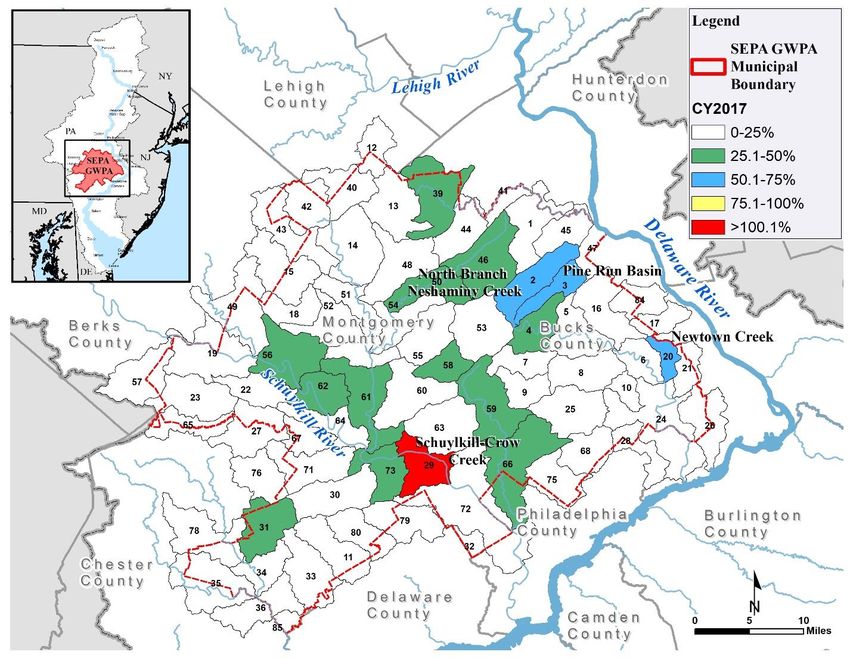
DRBC Water Resources Program FY 2020 - 2022

New York

In the USGS well in the New York portion of the upper basin (Figure 10), water levels varied throughout the
year, similar to the Wayne and Schuylkill County, PA wells. As with the other wells, groundwater levels
were low at the start of the period, but quickly increased to above normal. The well had a slight decrease
in water level in late spring.

Figure 10: USGS well in Woodbourne, Sullivan County, NY. July 2018 – June 2019 Observed Depth. Data source: USGS.

B. WATER USE AND SUFFICIENCY
i.   Population Served
The Delaware River Basin (DRB) provides water to portions of the four states located in the basin: New
York, New Jersey, Pennsylvania and Delaware. As of 2016, the total population served by DRB water is
estimated at 13.3 million. The total population served includes those within the Basin boundaries as well
as populations of the basin states located outside of the DRB, which are served through exports. Estimates
of population served through exports are based on daily use by “equivalent” populations outside the basin.
Although water from the Basin is mixed with other sources for New York City, the “equivalent” population
served for New York City is estimated by multiplying the DRB portion of the water supply by the 2016
population. A summary of the data below is presented graphically in Figure 11.

Adopted March 11, 2020                              13
DRBC Water Resources Program FY 2020 - 2022

      Figure 11. Population Estimates for 2016 in the Delaware River Basin by State

Adopted March 11, 2020                  14
DRBC Water Resources Program FY 2020 - 2022
ii. Water Withdrawals and Trends
Understanding water withdrawals, water use, and supply is integral to the management of water resources.
In recent years, our understanding of the ways in which water is withdrawn and used has improved greatly,
as have the underlying systems in place to manage the data, meaning that more timely and comprehensive
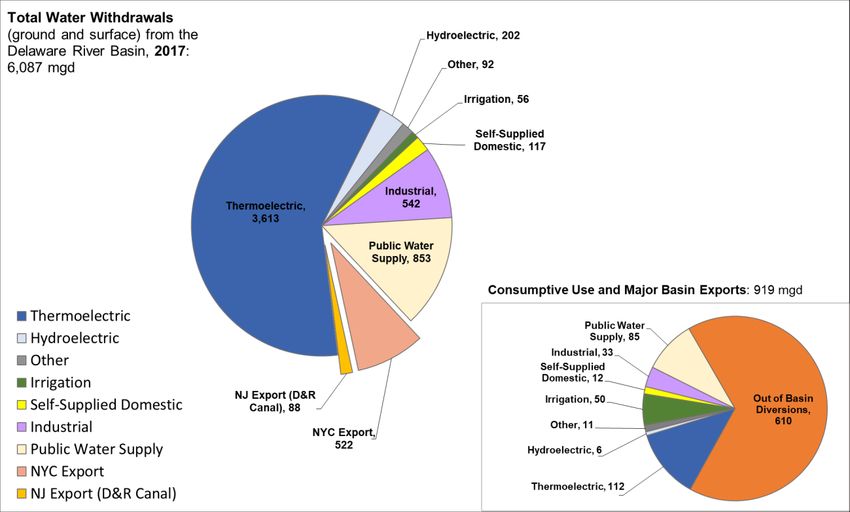
assessments can be made. Figure 12 shows the basin-wide picture of water withdrawals, exports, and
consumptive use, by sector, based on 2017 calendar year water use data; the data shown represent daily
average withdrawals.
Figure 12. Total Water Withdrawals and Consumptive Use / Major Exports from the Basin 2017. (Note: for Self-supplied
domestic estimates from other reporting years have been used as more recent data were not readily available.)
Key Delaware River Basin water use facts:
• Based on 2016 data, an estimated 13.3 million people rely on water from the Basin for their daily
water needs (see Section 1.B.i). Approximately 8.3 million people live in the Basin, and the volume
of exports to New York City and northeastern New Jersey is sufficient to supply water to an
additional 5 million people;
• Based on 2017 data, total ground and surface water withdrawals from the Basin: 6,087 mgd (6.1
Billion gallons per day);
• Major Exports from the Basin: 610 mgd;
• Consumptive Use in the Basin: 309 mgd;
• Approximately 95% of all water used in the Basin is obtained from surface waters; and
• Three dominant use sectors account for over 80% of total water withdrawals; these sectors are:
power generation (“Thermo,” 59%), public water supply (“PWS,” 14%), and industrial use
(“Industrial,” 9%).
DRBC tracks withdrawals and water use in these three dominant water-using sectors closely. Currently,
data for these key sectors extend through calendar year 2017 and provide a monthly time series of data
spanning a period of over 20 years. Although Figures 13 and 14 contain some data gaps, an overall pattern
and trend in water withdrawals and consumptive use is apparent. The public water supply sector displays
Adopted March 11, 2020 15DRBC Water Resources Program FY 2020 - 2022 neutral trends in total water withdrawn as well as water consumptively used; this is primarily attributed to the influence of conservation practices neutralizing population increases. The industrial sector displays a historically decreasing trend with some fluctuations, likely the result of facilities entering or exiting the industrial sector. The thermoelectric sector displays an overall decreasing trend in total water withdrawals with an increasing trend in consumptive use. Figure 13. Monthly Water Withdrawals for Three Key Sectors in the Delaware River Basin. No data are shown for months where data were incomplete to avoid visually skewing the trends. iii. Cumulative Thermoelectric Withdrawals and Consumptive Use Water withdrawals for thermoelectric power generation are primarily used for cooling purposes. The cooling process is typically achieved by either highly evaporative cooling towers or a once-through cooling process that uses a condenser to absorb heat. The two types of cooling use water in different ways. Evaporative cooling towers require a smaller volume of withdrawal but consume most of the water (typically >90% consumptive use). Once-through cooling requires much greater volumes of water at the intake, but the rate of loss to evaporation is very small (typically
DRBC Water Resources Program FY 2020 - 2022

Figure 14. Monthly Consumptive Water Use for Three Key Sectors in the Delaware River Basin. No data are shown for
months where data were incomplete to avoid visually skewing the trends.

Figure 15. Trend in Monthly Consumptive Use for Thermoelectric Power Generation in 1994-2017. The trendline is calculated
as a 12-month moving average.

Adopted March 11, 2020                                17
DRBC Water Resources Program FY 2020 - 2022

Increases in demand for withdrawals for thermoelectric power generation are likely to occur in the future.
Any new capacity is likely to be cooled using evaporative methods (e.g., cooling towers) as required under
USEPA regulations, potentially increasing consumptive water use further.

iv. Public Water Supply Withdrawals
Historic data for public water supply (PWS) withdrawals show a neutral trend (see Figure 16) largely driven
by water conservation measures in the form of changes in plumbing codes, enacted in the early 1990s,
which require use of more efficient plumbing fixtures and fittings. In addition, education and awareness of
water conservation practices have played a role in decreasing water use for this sector despite increases
in population (shown by the red line in Figure 16). Although neutral in the aggregate, withdrawals have
increased in several systems where there are population growth regions (i.e., where water conservation
practices cannot offset the more rapid increase in population). Over the past 30 years, DRBC has been a
leader in enacting regulations to promote water conservation in the areas of source and service metering,
leak detection and repair, plumbing fixtures and fittings, and water rate structures. The trend shown in
Figure 16 indicates that these regulations have been successful and have contributed to flat trends in PWS
water withdrawals. Figure 16 also shows the consumptive use portion (light green) of the total withdrawals;
the non-consumptive portion (dark green) reflects those volumes returned to the basin after withdrawal.
(Note that DRBC does not receive or calculate consumptive use data for the public water sector, but rather
uses a basinwide “consumptive use factor” of 10% for public water supply systems).

Figure 16. Monthly withdrawals of Public Water Systems in the Basin 1990-2017. No data are shown for months where data
were incomplete to avoid skewing the displayed trend line. The population values are reflective of the population residing
within the Basin boundary, not the population served.

In 2009, as part of DRBC’s effort to ensure its regulations reflect the latest thinking in the field of water
efficiency, the Commission amended its Comprehensive Plan and Water Code to implement an updated
water audit approach to identify and manage water loss in the basin, in partnership with Basin water
purveyors. The approach is consistent with the International Water Association (IWA) and American Water
Works Association (AWWA) Water Audit Methodology and is considered a best management practice in

Adopted March 11, 2020                                18
DRBC Water Resources Program FY 2020 - 2022

water loss control. The revised regulations require PWS systems to conduct an annual water audit to help
identify water losses, particularly water lost due to leaky infrastructure. DRBC performed multiple outreach
efforts, and the audit became a mandatory requirement in 2012. Nearly three hundred water audits were
available for analysis for CY2018. Collectively, the audit data indicates that approximately 798 million
gallons per day (MGD) of water was put into distribution systems in the Delaware River Basin. Non-revenue
water is a key term used in the AWWA water audit methodology to quantify water losses and unbilled water
consumption. Non-revenue water is water that has been treated and pressurized and enters the distribution
system but generates no revenue for the water purveyor. Water losses can be real losses (through leaks,
also referred to as physical losses) or apparent losses (for example, through theft or metering inaccuracies).
Based on the CY2018 reported data, an estimated 164 MGD was reported as physically lost from
distribution systems in the DRB along with an estimated 28 MGD reported as apparent losses and 21 MGD
of unbilled authorized consumption for a total of 213 MGD of non-revenue water reported in CY2018. This
non-revenue water has an estimated annual value of $126 million to water utilities in the DRB and
represents a significant opportunity to improve the efficiency of public water supply in the basin. Figure 17
shows a summary of the 2018 results of data collection under the DRBC water audit program.

            Figure 17. DRBC water audit program summary (CY2018); aggregate of 294 individual water
            system audits.

Data collection under the DRBC’s water audit program marks a significant step in a long-term effort to
improve water efficiency and promote best practices in water loss control for Basin water purveyors. During
the first few years of the program, the emphasis will be on ensuring that water purveyors build confidence

Adopted March 11, 2020                           19
DRBC Water Resources Program FY 2020 - 2022 in the data submitted in the water audit. Developing and providing accurate data to the water audit process will result in a clearer understanding of the causes of water loss and is a vital first step in the process. Furthermore, the water audit emphasizes the importance of calibrating source meters to ensure accurate measurement of water withdrawn. This also helps improve the accuracy of reported withdrawals of water to state agencies and DRBC for use in other water use studies and assessments. It is anticipated that a focus on this issue will result in an improved efficiency of public water supply systems, saving both water resources and money. v. Industrial Withdrawals Historic data for industrial withdrawals show a decline from levels in the early 1990’s (Figure 18). The closing of the Bethlehem Steel plant in Bethlehem, PA, in 1995 contributed significantly to the overall decline in water use for this sector as it was the Basin’s largest industrial water user. Over the past decade, industrial water use has declined slightly despite numerous facilities changing hands. Several large refineries in the Basin have seen a lot of turnover in recent years. Refineries that were idle are once again in production and have returned to more normal operations with water withdrawal data returning to previous levels. Figure 18. Monthly Industrial Water Withdrawals 1990 – 2017. The trendline is calculated as a 12-month moving average. vi. Seasonal Variation in Withdrawals and Consumptive Use The monthly data, shown in Figures 13, 14, 15, 16, and 18, highlight the extent to which water withdrawals and consumptive uses vary seasonally. Thermoelectric power generation experiences peaks in the summer months as a consequence of increased power demand for residential and commercial cooling. Simultaneously, public water suppliers experience peak demands in the summer months when lawn- watering and other outside uses are greatest. This highlights the need for including accurate seasonal (peak) considerations—including ecological (instream) needs—in long-range supply sufficiency assessments. Adopted March 11, 2020 20
DRBC Water Resources Program FY 2020 - 2022

vii. Ecological (Instream) Flow Needs
Water supply planning in the basin generally has not taken into account the instream flow needs of aquatic
communities principally due to a scarcity of specific quantitative information, especially regarding the
relationship of flow to ecological needs. Understanding instream flow needs is important to protect key
ecological communities for the range of habitats in the Delaware River Basin and may be informative for
the Commission to plan to meet future water needs for all uses. In December 2013, the Commission and
The Nature Conservancy (TNC) completed a year-long study on basin-wide ecosystem flow
recommendations for subwatersheds of the Delaware River. The Commission is currently reviewing options
to implement the TNC recommendations. The USGS WaterSMART study also includes an ecological flows
component.

viii. Conditions in Special Groundwater Management Areas
Two areas of the Basin are included in special management programs to mitigate historical groundwater
supply issues and prevent future stress. The Commission manages the Southeast Pennsylvania
Groundwater Protected Area (SEPA GWPA) on behalf of the Commonwealth of Pennsylvania, and New
Jersey manages Critical Area 2 in the Potomac-Raritan-Magothy (PRM) aquifer system in southwestern
New Jersey (Figure 19).

                    Figure 19. Groundwater Management Areas in the Delaware River Basin.

Southeast Pennsylvania Groundwater Protected Area.

The SEPA GWPA is an area of 1200 sq. mi. that includes 76 subbasins closely managed by DRBC
regarding groundwater withdrawals, well interferences, and municipal water supply planning. Withdrawal
limits have been established for each of the subbasins. Based on an analysis by DRBC using groundwater
withdrawal data provided by the PADEP:
Presently, cumulative allocations in some SEPA GWPA subbasins exceed the recommended sub-basin
withdrawal limit (Figure 20). In order to plan for future development and an increased demand on

Adopted March 11, 2020                           21
DRBC Water Resources Program FY 2020 - 2022
groundwater resources, subbasin stress determinations will be made based on docket and SEPA GWPA
permit allocations. The Commission will continue to update subbasin usage with current PADEP water
withdrawal data and continue to lower cumulative docket/permit allocations to below their respective
subbasin withdrawal limits.
Use in three (3) subbasins is currently between fifty (50%) and seventy-five (75%) of their subbasin
withdrawal limits. One (1) subbasin is above their withdrawal limit. Subbasin (29) has historically been
above its withdrawal limit because a major withdrawal from a quarry reservoir is counted as a groundwater
withdrawal by PADEP. A second subbasin (4) has historically vacillated between non-stressed, potentially
stressed and above the withdrawal limit. Most of the change in water use in subbasin 4 is attributable to
the Eureka Stone Quarry. For any new withdrawal in a “potentially stressed” subbasin, SEPA GWPA
regulations provide alternative programs geared toward increasing the groundwater recharge to the
underlying formation or that conserve overall groundwater use.
Over the period from 2000 to 2017, cumulative groundwater use in the SEPA GWPA has decreased (Figure
21). This is likely to be partially attributable to improved water conservation, as noted above, and also due
to infrastructure changes, notably the Point Pleasant, PA, diversion of surface water from the Delaware
River to offset groundwater use by communities in Bucks and Montgomery counties. Figure 21 shows
groundwater withdrawal data provided by the PADEP covering the years 1987 through 2017. The
groundwater withdrawal data reported in the graph are from facilities that submitted data to the PADEP.
Figure 20. Three (blue) subbasins are currently between 50.1% and 75% of the withdrawal limit; and one
subbasin (red), where a major withdrawal from a quarry reservoir is counted as a groundwater withdrawal by
PADEP, is above its withdrawal limit.
Adopted March 11, 2020 22DRBC Water Resources Program FY 2020 - 2022 Figure 21. Withdrawals in the PA Groundwater Protected Area from 1987-2017 generally show slight reductions in the period from the late-1990s to 2017. New Jersey Critical Area 2 NJDEP and USGS regularly monitor groundwater levels in the affected aquifers of Critical Area 2 (CA2) in southern New Jersey, and assessments indicate that withdrawals have significantly decreased beginning with the program’s inception in 1996 (Figure 22), resulting in concurrent rebounding of groundwater levels in most monitoring wells (Figure 23). The surface water diversion/treatment facility on the Delaware River in Delran, Burlington County, owned and operated by the New Jersey American Water Company, was chosen as the regional water supply alternative for Critical Area 2. The Tri-County Water Supply Project remains the primary water source to meet growing water demands in the region. The downward trend that is visible in Figure 22 is primarily the result of major infrastructure improvements to allow areas that were previously solely reliable on local Potomac-Raritan-Magothy (PRM) withdrawals to tap into the regional solution of the Delaware River Tri-County project, which is primarily a surface water withdrawal. In addition, water conservation and indoor plumbing efficiencies as well as economic and business trends add to the overall downward trend in water withdrawals. Adopted March 11, 2020 23
DRBC Water Resources Program FY 2020 - 2022

                                                        Critical Area 2 PRM Aquifer Withdrawals
                   50,000

                   40,000
 Million Gallons

                   30,000

                   20,000

                   10,000

                       0
                            1990
                                   1991
                                          1992
                                                 1993
                                                        1994
                                                               1995
                                                                      1996
                                                                             1997
                                                                                    1998
                                                                                           1999
                                                                                                  2000
                                                                                                         2001
                                                                                                                2002
                                                                                                                       2003
                                                                                                                              2004
                                                                                                                                     2005
                                                                                                                                            2006
                                                                                                                                                   2007
                                                                                                                                                          2008
                                                                                                                                                                 2009
                                                                                                                                                                        2010
                                                                                                                                                                               2011
                                                                                                                                                                                      2012
                                                                                                                                                                                             2013
                                                                                                                                                                                                    2014
                                                                                                                                                                                                           2015
                                                                                                                                                                                                                  2016
                                                                                                     Depleted
                                                                                                     Threatened                                                   2016 Data are Provisional
Figure 22. Withdrawals from the PRM 1990-2016 show significant reductions since the inception of Critical Area 2
management in 1996. Source: I. Snook, NJDEP, Oct 2018.

                                           Figure 23. Example of rebounding groundwater levels in the upper PRM of
                                           NJ Critical Area 2 since program inception in 1996. Elm Tree 3 observation
                                           well Burlington Co., NJ. Source: USGS, Sept. 2018.

Adopted March 11, 2020                                                                             24
DRBC Water Resources Program FY 2020 - 2022 ix. Areas of Concern: PRM and Bayshore Watersheds The 2007 report of a multi-year investigation by the USACE concluded that groundwater withdrawals in northern New Castle County, Delaware, were reducing local stream base flows and forming cones of depression. Pumping in Delaware is increasing groundwater flow from Maryland and decreasing flow into New Jersey by about 10% each1, and regional pumping has created overlapping cones of depression across the study area of the three states. Delaware Critical water resource issues in the Rancocas, Piney Point, Cheswold, Federalsburg, Frederica, and Columbia aquifers of Kent County, DE have driven state capital funding for a multi-year program in Delaware. The program’s goal is to improve groundwater monitoring and includes the collection of detailed, baseline hydrologic information to inform near-term (e.g., 10 year) management options (see Figure 24). Monitoring wells were installed and equipped with water level sensors in multiple aquifers at 10 sites and two rounds of groundwater quality sampling of these wells have been completed. Two USGS stream gaging stations have been re-activated. Initial results of this effort have been published (https://www.dgs.udel.edu/publications/ofr53-kent-county-groundwater-monitoring-project-results- subsurface-exploration). A focused monitoring effort is underway to study the Columbia aquifer in the east Dover area where increased pumping for irrigation and the City of Dover are causing concerns for increased drawdown and saltwater intrusion. In this area, salinity sensors were installed in 14 wells, five streams, and two groundwater fed irrigation ponds and are providing information on the duration, intensity and frequency of saline water incursion. The project is a collaborative effort of the Delaware Geological Survey (DGS), Delaware Department of Natural Resources and Environmental Control (DNREC), the Governor’s Water Supply Coordinating Council (WSCC), and the USGS. It is providing critical information on salt-water intrusion and groundwater quality conditions, yields, and pumping interactions to improve planning and provide options for managing growing water demand and sea-level rise in this region. New Jersey beyond Critical Area 2 NJDEP released the New Jersey Water Supply Plan (NJWSP) 2017-2022 in October 2017, which improves the management and protection of the State’s water supplies. The Plan is a critical document which emphasizes the need to balance traditional water use with water resource protection, while outlining a range of policy options to achieve that balance amid an array of competing interests and issues. The 2017-2022 NJWSP differs from preceding plans as it is designed to allow for continuous technical and policy updates, as ongoing water resource evaluations, water use data, and more refined water demand projections become available. Using the NJWaTr Database, which is used to determine water budgets for the 151 HUC11 watersheds existing throughout NJ and to evaluate confined aquifer and surface water reservoir diversion rates, the State’s future water supply planning efforts will be streamlined. In coordination with the extensive surface water, groundwater and drought monitoring systems and assessment tools, water supply planning at this scale represents significant advancements from those provided in previous frameworks. NJDEP signed a 10 year Flexible Flow Management Program in October 2017 which allows NJ to maintain and allocate a Delaware and Raritan Canal diversion of 80 mgd during declared drought emergency. Additionally, the agreement called for a study to be conducted to evaluate the further increase in the diversion during drought. This diversion plays a critical role in meeting New Jersey’s current and future water supply needs, while enhancing water system resiliency in the Central, Coastal North and Northeast drought regions of New Jersey. NJDEP reports that saltwater intrusion is currently being observed in several observation wells located along the Delaware Bay in the Cohansey and Estuarine Sand Aquifers in Lower and Middle Townships in Cape May County. In response to increasing chloride concentrations in a public supply well located approximately 2 miles to the east of the Delaware Bay and completed in the Cohansey Aquifer DEP lowered allowable withdrawal rates in the well initiated the investigation into the 1 USACE 2007 report on results of groundwater modeling of the Potomac aquifer: Updated Draft Groundwater Model Production Run Report, Upper New Castle County Delaware. Prepared for DE DNREC by USACE Philadelphia District; Feb. 2007. Adopted March 11, 2020 25
DRBC Water Resources Program FY 2020 - 2022

saltwater intrusion in the area. Recent hydrogeologic and water quality data suggest eastward migration of
salty water from the Delaware Bay towards pumping centers, thus threatening the ability of those wells to
meet demands. A slight increase in chloride concentrations over time was noticed in two other production
wells located in the vicinity of the abovementioned production well. The New Jersey Geologic and Water
Survey (NJGWS) in cooperation with local water purveyors, has collected hydrogeologic and water quality
data to help clarify the saltwater intrusion issue in the area. Although the zone of saltwater contamination
in the Cohansey and Estuarine sand aquifers is delineated along the Delaware Bay, it is difficult to trace
the movement of saltwater inland at this time and more studies are needed. Local water purveyors have
been collecting monthly groundwater elevations and quarterly water-quality data (sodium and chloride
concentrations) in the established network of observations and production wells for the past 5 years. These
data have been used as part of NJDEP’s efforts to effectively manage the water supplies of Cape May
County.

Adopted March 11, 2020                          26
DRBC Water Resources Program FY 2020 - 2022

                     Figure 24. Monitoring sites for Groundwater and Saline Water Intrusion
                     Monitoring Network Infrastructure Improvements: Kent County, Delaware.
                     Source: S. Andres, DGS, Nov. 2019.

Bayshore Supply Alternatives.

A limited number of water supply alternatives are available for this area. Non-critical, confined aquifers are
one option, but these may be limited depending on the magnitude of the diversion (e.g., Piney Point, Mt.
Laurel-Wenonah) or by water quality problems (e.g., salt water in the Mt. Laurel-Wenonah). New Jersey
American Water’s tri-county pipeline, originally developed as an alternative source of water for the stressed

Adopted March 11, 2020                            27
DRBC Water Resources Program FY 2020 - 2022 municipalities in Critical Area 2, has now been extended through much of Gloucester County, including Logan, Harrison, East Greenwich, Woolwich, Pitman, and Elk Townships. x. National Groundwater Monitoring Network The National Ground-Water Monitoring Network (NGWMN) is a consortium of state and local agencies and the USGS that was established to create a single point of access for scientists, engineers, policy makers, and the public to view and acquire important physical and chemical data on the nation’s groundwater resources. NJDEP has contributed data to the NGWMN since 2011. Its network consists of 150 shallow wells designed to provide information on three land uses (urban, agricultural, and undeveloped) and are monitored for 177 analytes on a 3-year cycle. DGS became a data provider in early 2016. The network will ultimately allow users to view groundwater data across state lines to observe trends in groundwater quality and availability in a local, regional or national context. NGWMN resources are managed by the USGS Center for Integrated Data Analytics and can be accessed at http://cida.usgs.gov/ngwmn/. xi. General Statement of Basin Supply Sufficiency Under normal hydrologic conditions, and in accordance with current DRBC drought management plans and docket requirements (conservation releases, pass-by flows, consumptive use make-up, etc.), there is an adequate supply of water to meet flow objectives, in-basin water withdrawal demands and out-of-basin diversions. Under below normal hydrologic conditions and corresponding low stream flows (e.g., 7-day average, one-in-ten-years (7Q10)), in-basin water withdrawal demands, streamflow objectives and out-of- basin demands can generally be met. Under a repeat of the drought of record, analyses indicate that current streamflow objectives at Montague and Trenton, NJ and current out-of-basin diversions under the DRBC drought management plans can generally be met under current conditions. Potential changes in: in-basin withdrawal demands, streamflow objectives and climate change (including sea level rise) are currently being evaluated to assess future water supply sustainability. Furthermore, groundwater in both NJ Critical Area 2 and the SEPA Groundwater Protected Area remains under close scrutiny, and conjunctive use of surface water is both recommended and, in some locations, necessary. More in-depth analysis and investigation is needed to provide a detailed forecast of supply adequacy during a repeat of the drought of record, under modified operating restrictions, or under different climatic conditions. The Commission proposes over the next three years to prepare a supply assessment under various scenarios and make recommendations for a Sustainable Water Future through 2060. The US Army Corps of Engineers (USACE) has highlighted potential structural inadequacies in the Blue Marsh and Beltzville Reservoirs, issues that will need to be addressed. The stored water is released to maintain minimum flows immediately below the reservoirs (conservation releases) and to support flow objectives (e.g., Delaware River at Trenton). DRBC is responsible for the annual debt service and a portion of operation and maintenance costs. These costs are reimbursed from the DRBC water supply charging program. Adopted March 11, 2020 28
DRBC Water Resources Program FY 2020 - 2022

C. SURFACE WATER QUALITY
i.     Surface Water Quality Assessment
Two major water quality assessments describe the water quality of the Delaware River Basin: The 2019
State of the Basin, and the 2018 Delaware River and Bay Water Quality Assessment Report. These two
reports complement each other by utilizing different approaches to assess water quality. During the first
quarter of 2018, DRBC completed the 2018 Delaware River and Bay Water Quality Assessment Report.
That report was finalized and posted on the Commission’s web site in October 2018.

                         Table C1. Comparison of Water Quality Assessment Reports

                                                                          2018 Delaware River and Bay
     Comparison                2019 State of the Basin
                                                                          Water Quality Assessment

                                                                          Compare observations to DRBC
     Evaluation Method         Use of Indicators
                                                                          Criteria

                               Current status, long term trends, future   Supporting or not supporting
     Assessment
                               predictions                                designated uses

                               Expanded data window for current
     Term                      status, full period of record for long     5-Year data window
                               term trends

     Extent                    Entire basin                               Mainstem Delaware River only

ii. State of the Basin 2019: Water Quality
The Water Quality chapter of the State of the Basin 2019 report provided an assessment of water quality
indicators for the entire basin, with special emphasis on the estuary. The State of the Basin differed from,
and complemented, the 2018 Water Quality Assessment Report, in that it focused on metrics for which no
criteria have been developed and evaluated long term trends. The State of the Basin 2019 is available at
DRBC’s website (https://www.nj.gov/drbc/library/documents/SOTBreport_july2019.pdf).

Adopted March 11, 2020                             29
DRBC Water Resources Program FY 2020 - 2022
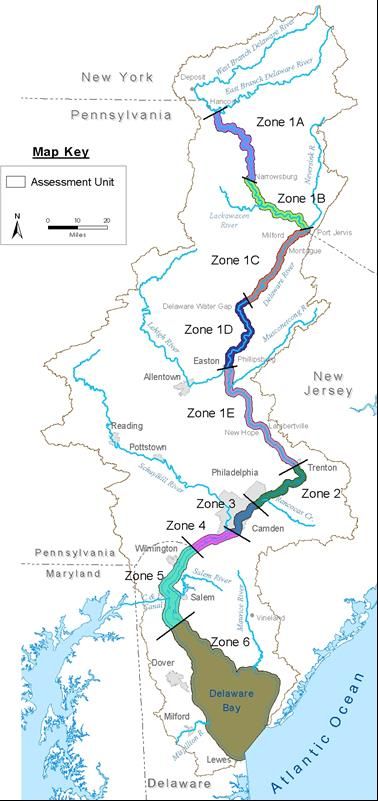
iii. 2018 Delaware River and Bay Water Quality Assessment
The Water Quality Assessment (previously
called the Integrated Assessment) performed
by DRBC focuses on the mainstem Delaware
River, comparing observations to water
quality criteria to determine whether water
quality is sufficient to support designated
uses as described in the Water Code.
Designated uses for the River include:
Aquatic life, Public Water Supply, Recreation,
Fish Consumption, and Shellfish
Consumption, although not all uses are
designated in all water quality zones (see
Figure 25). Assessments to determine
support of the designated uses of the
Delaware River are reported in the 2018
Delaware River and Bay Water Quality
Assessment at:
https://www.nj.gov/drbc/quality/reports/wq-
assessment-rpts.html
Figure 25. Delaware River Basin Water Quality Zones
Adopted March 11, 2020 30DRBC Water Resources Program FY 2020 - 2022
General Statement of Basin Water Quality
Overall, the majority of observations meet water quality criteria in the Delaware River and Bay.
Aquatic Life
Support of the aquatic life designated use is assessed by evaluation of dissolved oxygen, pH, turbidity,
temperature, TDS, alkalinity, toxic pollutants, and biology. The majority of observations met water quality
standards. Additional detail on select portions of the assessment in support of Aquatic Life is provided
below:
Conventional Pollutants
• Dissolved Oxygen. The vast majority of the measurements met criteria. All criteria were met in
Zones 1C, 1D, 1E, 3, and 4. All seasonal mean criteria were met in Zones 2 through 5. The majority
of observations met minimum or 24-hour mean criteria in all Zones.
• pH. Most pH observations met criteria, however daily maximum values routinely exceeded the
maximum criterion of 8.5.
• Turbidity. The majority of observations met criteria for turbidity in all Zones.
• Temperature. As noted in previous assessments, temperature criteria in Zones 1A through 1E are
clearly oriented toward determining compliance of thermal mixing zones for point discharges. In
Zones 3 through 6, the majority of observations met criteria. In Zone 2, approximately 92.8% of
observations met criteria. Atmospheric temperatures and meteorological conditions are strong
drivers of water temperature.
Toxic Pollutants
• Copper. Data showed multiple exceedances in Zone 5 of the chronic freshwater criterion for copper
using the DRBC regulatory hardness of 74 mg/L CaCO3 in the hardness-based criteria equation
but not more than one exceedance in three years when site specific hardness are used. Multiple
exceedances of DRBC acute and chronic marine stream quality objectives were observed for
copper in Zones 5 and 6. Assessment is complicated by factors such as field sampling and
analytical issues with contamination, the applicability of DRBC’s freshwater or marine criteria, a
need to assess revisions to the current freshwater and marine criteria, and the influence of other
water quality attributes that influence the partitioning and toxicity of copper. Coordination among
basin states and agencies should continue to ensure the use of the most appropriate methods and
procedures for the conduct of monitoring studies for copper in the Basin, and the harmonization of
water quality criteria and assessment methodologies in all Zones.
• Aluminum. Data showed numerous exceedances of aluminum acute and chronic freshwater
objectives for the support of aquatic life in Zone 4 over multiple years. With enhanced monitoring
in 2017, the chronic criterion was exceeded in Zones 2, 3 and 5 and acute criterion was exceeded
in Zone 5. However, supplemental assessment with EPA proposed Multiple Linear Regression
(MLR) based criterion calculations did not confirm acute exceedances
(https://www.epa.gov/wqc/2017-draft-aquatic-lifecriteria-aluminum-freshwater). Chronic
exceedances were indicated by MLR using sample specific pH, DOC and hardness in Zones 4 and
5. Coordination among basin states and agencies should continue to ensure the use of the most
appropriate methods and procedures for the conduct of monitoring studies in the Basin, and the
harmonization of water quality criteria and assessment methodologies for aluminum.
Adopted March 11, 2020 31DRBC Water Resources Program FY 2020 - 2022
Public Water Supply
Support of the Public Water Supply designated use is assessed by evaluating TDS, Hardness, Chlorides,
Odor, Phenols, Sodium, Turbidity, Systemic Toxicants, Carcinogens, and Drinking Water Closures. The
majority of observations met water quality standards.
Recreation
Section 101(a)(2) of the Clean Water Act sets, as a national goal, attainment of water quality that protects
fish and wildlife and provides for recreation. In the Delaware River, recreation is the designated use for all
zones except for Zone 3 and the upper portion of Zone 4. Zone 3 and the upper portion of Zone 4, above
River Mile 81.8, are designated as recreation - secondary contact, while the lower portion of Zone 4, below
River Mile 81.8, is designated for primary contact recreation. Primary contact recreation is supported in
Zone 1C, 2, 5, and 6. Secondary contact recreation is supported in Zones 3 and the upper portion of Zone
4. Zones 1A, 1B, 1D, 1E, and the lower portion of Zone 4 had insufficient data to assess.
DRBC is in the midst of a special study to assess the likelihood of achieving water quality that would support
recreation in Zones 3 and upper 4. DRBC expects results from this effort in 2020, and identification of
follow-up actions that will support both safety and increased recreational opportunities in the future.
Fish Consumption
While working to reduce toxic pollutants that bioaccumulate, "advisories" containing meal advice for
consumers of recreationally-caught fish and shellfish are issued to minimize the risk to human health. While
the DRBC does not issue fish consumption advisories, DRBC staff work with Basin states to provide data
to use in developing state-issued advisories. The fish consumption designated use applies to all DRBC
WQM Zones. The assessment criterion is based primarily on the presence of the Basin states’ fish
consumption advisories in the mainstem Delaware River and Bay for the assessment period. The presence
of fish consumption advisories results in an assessment of “not supporting the designated use.” Advisories
were issued for each assessment unit. There is no assessment unit without an advisory, so the use is not
supported in any zone. However, it is important to note improvements in the advisories. For example, New
Jersey and Delaware have revised advisories in the Delaware Estuary from PA/DE Border to C&D Canal
(River Mile 80-58) to allow three meals per year for all fin fish including white perch and channel catfish.
Before 2015, no consumption was advised. Similarly, PA revised advisories from ‘Do not eat’ to six meals
per year for sections from Trenton, NJ, to Morrisville, PA, bridge to PA/DE border for carp in 2016. Those
less stringent fish consumption advisories are due to lower PCB concentrations in fish tissue.
EPA approved a total maximum daily load (TMDL) for PCBs for Zones 2 through 5 in December 2003, and
a second PCB TMDL for Zone 6 in December 2006. TMDLs are expected to be revised by USEPA in the
near future based on documentation prepared by DRBC staff.
Shellfish Consumption
Shellfish consumption, as a DRBC designated use, only applies to DRBC Zone 6. For the 2018
assessment, approved harvesting areas were considered to be supporting the use. Prohibited waters were
considered to be not supporting the use. Assessment units classified as special restricted and seasonally
restricted are considered to be supported, but with special conditions. In total for the 2018 assessment, 615
mi2 are in full support (79% of zone 6), 44 mi2 are supporting with special conditions (11%), and 123 mi 2
are not supporting the shellfish consumption use (16%).
Antidegradation: DRBC Special Protection Waters
In recent years, three major advancements have been achieved in the Special Protection Waters program:
• The Lower Delaware Measurable Change Assessment 2009-2011 (DRBC 2016) was
completed. This was DRBC’s first assessment of measurable change since site-specific existing
water quality (EWQ) targets were established in DRBC rules. Methods for determination of
Adopted March 11, 2020 32You can also read