NASA Assessments of Major Projects - Report to Congressional Committees United States Government Accountability Office
←
→
Page content transcription
If your browser does not render page correctly, please read the page content below
United States Government Accountability Office
               Report to Congressional Committees

March 2016
               NASA

               Assessments of Major
               Projects

GAO-16-309SP
March 2016

                                                 NASA
                                                 Assessments of Major Projects

Highlights of GAO-16-309SP, a report to
congressional committees

Why GAO Did This Study                           What GAO Found
This report provides GAO’s annual                The cost and schedule performance of the National Aeronautics and Space
snapshot of how well NASA is planning            Administration’s (NASA) portfolio of major projects has improved over the past 5
and executing its major acquisition              years, and most current projects are adhering to their committed cost and
projects. In March 2015, GAO found               schedule baselines. Over the last 2 years, eight projects in the portfolio
that projects continued a general                established cost and schedule baselines. As the figure below shows, as the
positive trend of limiting cost and              average age of the portfolio has decreased, the cost performance of the portfolio
schedule growth, maturing                        has improved, because new projects are less likely to have experienced cost
technologies, and stabilizing designs,           growth.
but that NASA faced several
challenges that could affect its ability to      Development Cost Performance of NASA’s Major Project Portfolio Has Improved as Average
effectively manage its portfolio.                Project Age Has Decreased

The explanatory statement of the
House Committee on Appropriations
accompanying the Omnibus
Appropriations Act, 2009 included a
provision for GAO to prepare project
status reports on selected large-scale
NASA programs, projects, and
activities. This is GAO’s eighth annual
assessment of NASA’s major projects.
This report describes (1) the cost and
schedule performance of NASA’s
portfolio of major projects, (2) the
maturity of technologies and stability of
project designs at key milestones, and
(3) NASA’s progress in implementing              Note: GAO presents cost and schedule growth both including and excluding JWST because the
initiatives to manage acquisition risk           magnitude of JWST’s cost growth has historically masked the performance of the rest of the portfolio.
and potential challenges for project
                                                 Although NASA’s overall performance has improved, for 8 out of the last 9 years
management and oversight. This
                                                 at least one major project has experienced significant cost or schedule growth.
report also includes assessments of
NASA’s 18 major projects, each with a            Such growth often occurs as projects prepare to begin system assembly,
life-cycle cost of over $250 million. To         integration, and test; nine projects will be in that phase of development in 2016,
conduct its review, GAO analyzed cost,           including the Orion Multi-Purpose Crew Vehicle and Space Launch System,
schedule, technology maturity, design            which are human spaceflight programs that have significant development risks.
stability, and other data; reviewed              NASA has maintained recent improvements in the technology maturity and
monthly project status reports; and              design stability of its projects. As of 2015, 9 of the 11 major projects that passed
interviewed NASA officials.
                                                 preliminary design review matured all technologies to the level recommended by
What GAO Recommends                              GAO best practices—continuing a positive trend. Projects entering
                                                 implementation in recent years also appear to rely more heavily on existing
GAO is not making recommendations                technologies, but this trend could be changing on planned projects. The portfolio
in this report, but in prior reports has         continued a generally positive trend in improving design stability as measured
made recommendations that NASA                   against best practices and minimizing late design changes.
has not yet fully addressed. NASA
generally agreed with GAO’s findings.            NASA has continued to implement improved project management tools to
                                                 manage acquisition risks, but these efforts have not always been consistent with
View GAO-16-309SP. For more information,
                                                 best practices in areas such as cost estimating or fully addressed GAO’s prior
contact Cristina Chaplain at (202) 512-4841 or   recommendations. Further, NASA plans to dissolve its independent program
chaplainc@gao.gov.                               assessment office to help bolster its mission directorate workforce in key areas,
                                                 however this change could impact project oversight.
                                                                                                  United States Government Accountability Office
Contents
Letter 1
Background 3
NASA Cost and Schedule Performance Continues Positive Trend,
but Its Largest Projects Face Significant Risks 8
NASA Has Maintained Recent Improvements in Technology
Maturity and Design Stability 14
NASA Has Made Progress on Implementing Tools to Reduce
Acquisition Risks, but Faces Several Challenges 23
Project Assessments 31
Asteroid Redirect Robotic Mission 33
Commercial Crew Program 35
Europa 39
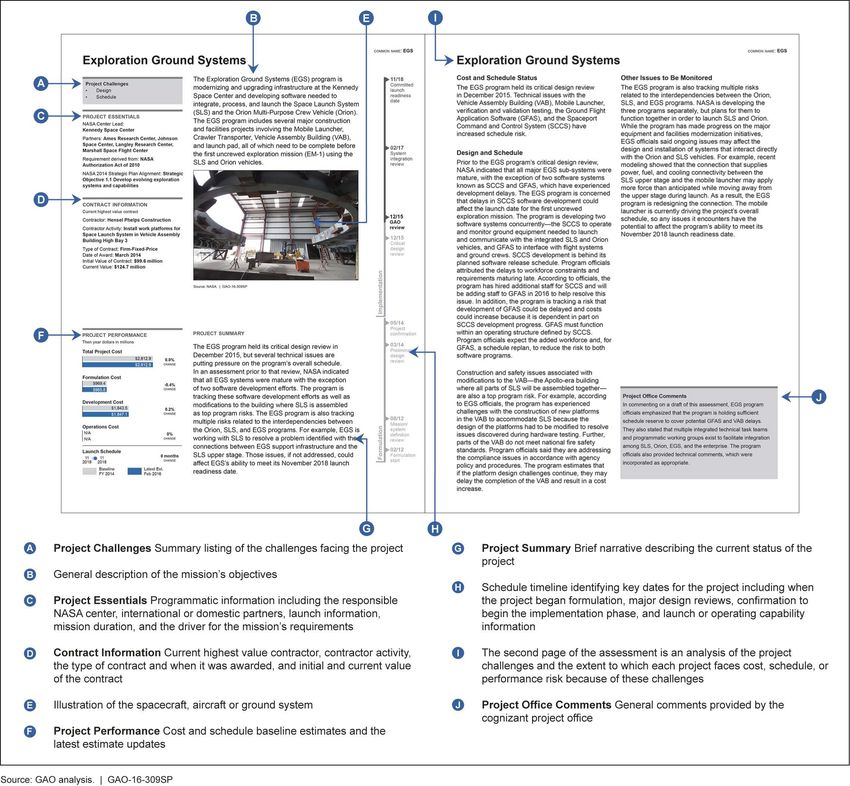
Exploration Ground Systems 41
Gravity Recovery and Climate Experiment Follow-On 43
Ice, Cloud, and Land Elevation Satellite-2 45
Interior Exploration using Seismic Investigations,
Geodesy, and Heat Transport 47
Ionospheric Connection 49
James Webb Space Telescope 51
Mars 2020 53
NASA ISRO – Synthetic Aperture Radar 55
Origins-Spectral Interpretation-Resource Identification-Security-
Regolith Explorer 57
Orion Multi-Purpose Crew Vehicle 59
Solar Probe Plus 61
Space Launch System 63
Space Network Ground Segment Sustainment 65
Surface Water and Ocean Topography 67
Transiting Exoplanet Survey Satellite 69
Agency Comments and Our Evaluation 71
Appendix I Objectives, Scope, and Methodology 74
Appendix II Major NASA Projects Reviewed in GAO’s Annual Assessments 81
Appendix III Technology Readiness Levels 84
Page i GAO-16-309SP Assessments of Major NASA Projects
Appendix IV   Elements of a Sound Business Case                                         86

Appendix V    Comments from NASA                                                        88

Appendix VI   GAO Contact and Staff Acknowledgments                                     90

Tables
              Table 1: Development Cost Growth on NASA Major Projects
                      Rebaselined from 2007 through 2015                                11
              Table 2: Development Cost and Schedule Performance of NASA
                      Major Projects Currently in Development                           12
              Table 3: Current Projects between Critical Design Review and
                      Systems Integration Review                                        13

Figures
              Figure 1: NASA’s Life Cycle for Space Flight Projects                       3
              Figure 2: Notional Allocation of Funding Reserves for a Project
                       Budgeted at the 70 Percent Confidence Level                        5
              Figure 3: Major NASA Projects Reviewed in GAO’s 2016
                       Assessment                                                         7
              Figure 4: Development Cost Performance and Average Months
                       Spent in the Development Phase for Major NASA
                       Projects from 2009 through 2016                                    9
              Figure 5: Total Number and Development Cost Growth of NASA
                       Major Projects with Established Cost Baselines from
                       2009 through 2016                                                10
              Figure 6: Percentage and Number of NASA’s Major Projects
                       Attaining Technology Maturity by Preliminary Design
                       Review from 2010 through 2016                                    15
              Figure 7: Average Number of Critical Technologies Reported by
                       NASA for Major Projects in Development from 2009
                       through 2016                                                     17
              Figure 8: Major Projects by Number of Critical Technologies
                       Reported by NASA from 2009 through 2016                          18

              Page ii                        GAO-16-309SP Assessments of Major NASA Projects
Figure 9: Average Percentage of Releasable Engineering
         Drawings for NASA Major Projects at Critical Design
         Review from 2010 through 2016                                    20
Figure 10: Average Percentage of Drawing Growth After Critical
         Design Review for NASA Major Projects from 2010
         through 2016                                                     23
Figure 11: Project Operations Costs and Cost Growth as a
         Percentage of Total Life-Cycle Cost and Cost Growth for
         Selected Major NASA Projects                                     30
Figure 12: Illustration of a Sample Project Assessment                    32
Figure 13: Major NASA Projects Reviewed in GAO’s Annual
         Assessments                                                      82

Abbreviations

ARRM          Asteroid Robotic Redirect Mission
ATLAS         Advanced Topographic Laser Altimeter System
CCP           Commercial Crew Program
CNES          Centre National d’Etudes Spatiales
CTS           crew transportation system
DCI           data collection instrument
DHU           data handling unit
EGS           Exploration Ground Systems
EM-1          Exploration Mission 1
EM-2          Exploration Mission 2
ESM           European Service Module
EVM           earned value management
FUV           Far Ultraviolet
GFAS          Ground Flight Application Software
GFZ           German Research Centre for Geosciences
GNC LIDAR     guidance, navigation, and control light detection and
                ranging
GRACE-FO      Gravity Recovery and Climate Experiment Follow-On
GSLV          Geosynchronous Satellite Launch Vehicle
ICESat-2      Ice, Cloud, and Land Elevation Satellite-2
ICON          Ionospheric Connection
ICPS          interim cryogenic propulsion stage
InSight       Interior Exploration using Seismic Investigations, Geodesy
                and Heat Transport
IPAO          Independent Program Assessment Office
ISRO          Indian Space Research Organisation

Page iii                       GAO-16-309SP Assessments of Major NASA Projects
ISS        International Space Station
JCL        joint cost and schedule confidence level
JWST       James Webb Space Telescope
KaRIn      Ka-band Radar Interferometer
KDP        key decision point
MIGHTI     Michelson Interferometer for Global High-Resolution
           Thermospheric Imaging
MSL        Mars Science Laboratory
NASA       National Aeronautics and Space Administration
NISAR      NASA ISRO Synthetic Aperture Radar
NPR        NASA Procedural Requirements
OLA        OSIRIS-REx laser altimeter
Orion      Orion Multi-Purpose Crew Vehicle
OSIRIS-REx Origins-Spectral Interpretation-Resource Identification-
           Security-Regolith Explorer
RFU        radio frequency unit
SCaN       Space Communications and Navigation
SCCS       Spaceport Command and Control System
SEIS       Seismic Experiment for Interior Structure
SEP        solar electric propulsion
SGSS       Space Network Ground System Sustainment
SLS        Space Launch System
SMAP       Soil Moisture Active and Passive
SPOC       Science Processing and Operations Center
SPP        Solar Probe Plus
SWEAP      Solar Wind Electrons Alphas and Protons
SWOT       Surface Water and Ocean Topography
TESS       Transiting Exoplanet Survey Satellite
TRN        terrain relative navigation
VAB        Vehicle Assembly Building

This is a work of the U.S. government and is not subject to copyright protection in the
United States. The published product may be reproduced and distributed in its entirety
without further permission from GAO. However, because this work may contain
copyrighted images or other material, permission from the copyright holder may be
necessary if you wish to reproduce this material separately.

Page iv                                 GAO-16-309SP Assessments of Major NASA Projects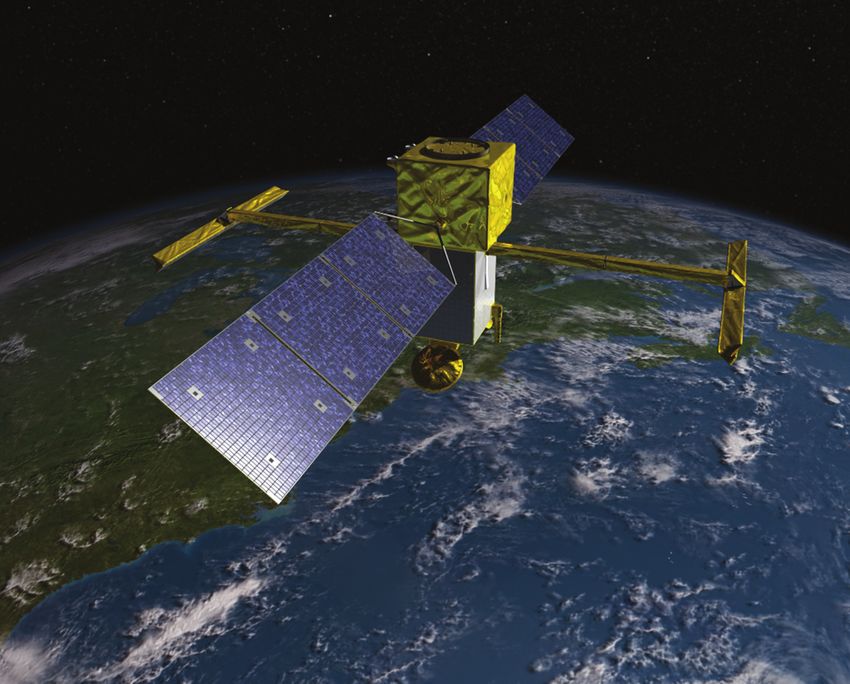
Letter

441 G St. N.W.
Washington, DC 20548

                       March 30, 2016

                       Congressional Committees

                       In fiscal year 2016, the National Aeronautics and Space Administration
                       (NASA) plans to spend over $6 billion on its 18 major projects, with each
                       having a life-cycle cost of over $250 million. In total, these projects
                       represent an expected investment of almost $54 billion to continue
                       exploring Earth and the solar system as well as extending human
                       presence beyond low Earth orbit. This report provides an overview of
                       NASA’s planning and execution of these major acquisitions—an area that
                       has been on GAO’s high risk list since 1990. 1 It includes assessments of
                       NASA’s key projects across mission areas, such as the Space Launch
                       System for human exploration, Mars 2020 for planetary science, and Ice,
                       Cloud, and Land Elevation Satellite-2 (ICESat-2) for Earth science.

                       The explanatory statement of the House Committee on Appropriations
                       accompanying the Omnibus Appropriations Act, 2009 includes a provision
                       for us to prepare project status reports on selected large-scale NASA
                       programs, projects, and activities. 2 This is our eighth annual report on this
                       topic. This report assesses (1) the cost and schedule performance of
                       NASA’s portfolio of major projects, (2) the maturity of technologies and
                       stability of project designs at key points in the development process, and
                       (3) NASA’s progress in implementing initiatives to manage acquisition risk
                       and potential challenges for project management and oversight. This
                       report also includes assessments of NASA’s 18 major projects. When
                       NASA determines that a project will have a life-cycle cost estimate of
                       more than $250 million for formulation and implementation, we include
                       that project in our annual review.

                       To assess the cost and schedule performance, technology maturity, and
                       design stability of NASA’s major projects, we collected information on

                       1
                       GAO, High-Risk Series: An Update, GAO-15-290 (Washington, D.C.: Feb. 11, 2015).
                       2
                        See Explanatory Statement, 155 Cong. Rec. H1653, 1824-25 (daily ed., Feb. 23, 2009),
                       on H.R. 1105, the Omnibus Appropriations Act, 2009, which became Pub. L. No. 111-8. In
                       this report, we refer to these projects as major projects rather than large-scale projects as
                       this is the term used by NASA.

                       Page 1                                  GAO-16-309SP Assessments of Major NASA Projects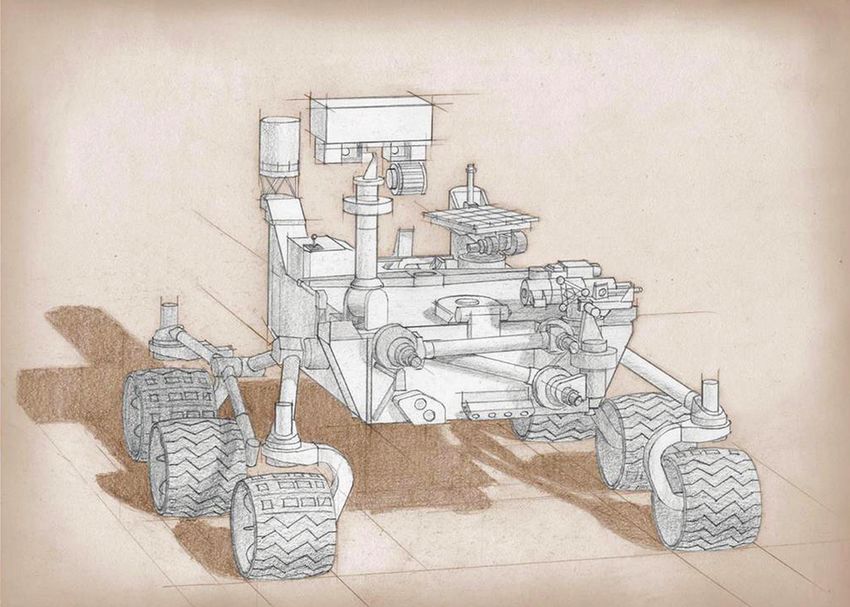
these areas from projects using a data collection instrument, analyzed
projects’ monthly status reports, interviewed NASA project and
headquarters officials, and reviewed project documentation. There are 18
major projects in total, but the information available depends on where a
project is in its life cycle. For the 12 projects in the implementation phase
we compared current cost and schedule estimates to their original cost
and schedule baselines, identified the number of technologies being
developed and assessed their technology maturity against GAO-identified
best practices and NASA policy, and compared the number of releasable
design drawings at the critical design review against GAO-identified best
practices and analyzed subsequent design drawings changes. 3 We also
reviewed historical data on cost and schedule performance, technology
maturity, and design stability for major projects from our prior reports and
compared it to the performance of NASA’s current portfolio of major
projects. To assess NASA’s progress and approach for reducing
acquisition risk, we examined NASA’s efforts to address issues identified
in our prior work, such as the quality of the cost and schedule risk
analyses and earned value management (EVM) implementation issues.
We also followed up on other potential acquisition risks that arose during
our review, such as the dissolution of NASA’s Independent Program
Assessment Office (IPAO). Finally, to conduct our project assessments,
we analyzed information provided by project officials, such as monthly
status reports, and interviewed project officials to identify major sources
of risk and the strategies that projects are using to mitigate them.
Appendix I contains detailed information on our scope and methodology.

We conducted this performance audit from April 2015 to March 2016 in
accordance with generally accepted government auditing standards.
Those standards require that we plan and perform the audit to obtain
sufficient, appropriate evidence to provide a reasonable basis for our
findings and conclusions based on our audit objectives. We believe that
the evidence obtained provides a reasonable basis for our findings and
conclusions based on our audit objectives.

3
 Five projects were in an early stage of development called formulation when there are
still unknowns about requirements, technology, and design. For those projects, we
reported preliminary cost ranges and schedule estimates. The Commercial Crew Program
has a tailored project life cycle and project management requirements. As a result, it was
excluded from our cost and schedule performance, technology maturity, and design
stability analyses.

Page 2                                 GAO-16-309SP Assessments of Major NASA Projects
The life cycle for NASA space flight projects consists of two phases—
Background                               formulation, which takes a project from concept to preliminary design, and
                                         implementation, which includes building, launching, and operating the
                                         system, among other activities. NASA further divides formulation and
                                         implementation into phase A through phase F. Major projects must get
                                         approval from senior NASA officials at key decision points before they
                                         can enter each new phase. Figure 1 depicts NASA’s life cycle for space
                                         flight projects.

Figure 1: NASA’s Life Cycle for Space Flight Projects

                                         Project formulation consists of phases A and B, during which projects
                                         develop and define requirements, cost and schedule estimates, and
                                         system designs for implementation. NASA Procedural Requirements
                                         7120.5E, NASA Space Flight Program and Project Management
                                         Requirements, specifies that during formulation, a project must complete
                                         a formulation agreement to establish the technical and acquisition work
                                         that needs to be conducted during this phase and define the schedule
                                         and funding requirements for that work. The formulation agreement
                                         should identify new technologies and their planned development, the use
                                         of heritage technologies, risk mitigation plans, and testing plans to ensure
                                         that technologies will work as intended in a relevant environment. Prior to
                                         entering phase B, a project develops a range of its expected cost and

                                         Page 3                           GAO-16-309SP Assessments of Major NASA Projects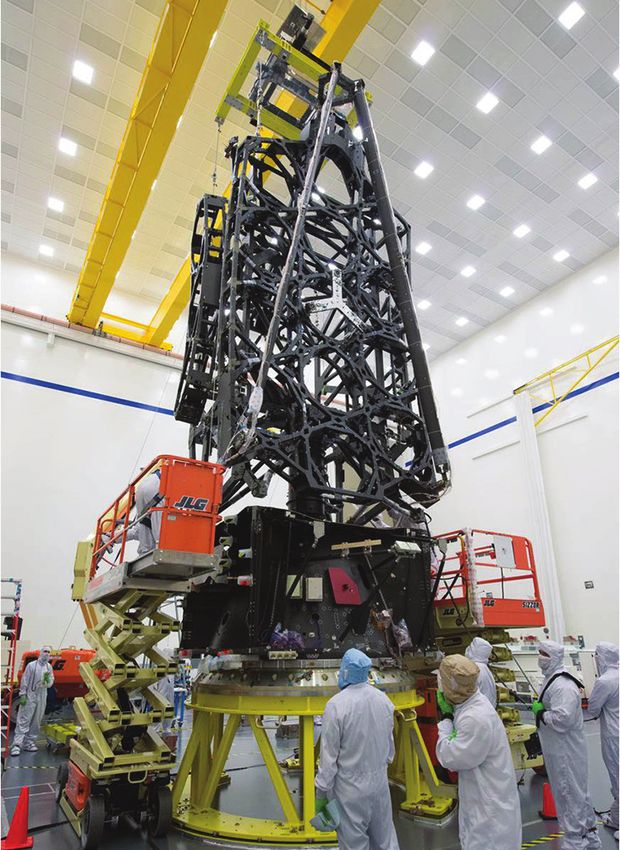
schedule which is used to inform the budget planning for that project.
During Phase B, the project also develops programmatic measures and
technical leading indicators which track various project metrics such as
requirement changes, staffing demands, and mass and power utilization.
Near the end of formulation, leading up to the preliminary design review,
the project team completes technology development and its preliminary
design.

Formulation culminates in a review at key decision point C, known as
project confirmation, where cost and schedule baselines are established
and documented in a decision memorandum. The decision memorandum
outlines the management agreement and the agency baseline
commitment. The management agreement can be viewed as a contract
between the agency and the project manager. The project manager has
the authority to manage the project within the parameters outlined in the
agreement. The agency baseline commitment establishes the cost and
schedule baselines against which the project may be measured. To
inform the management agreement and the agency baseline
commitment, each project with a life-cycle cost estimated to be greater
than $250 million must also develop a joint cost and schedule confidence
level (JCL). The JCL initiative, adopted in January 2009, is a point-in-time
estimate that, among other things, includes all cost and schedule
elements, incorporates and quantifies known risks, assesses the impacts
of cost and schedule to date, and addresses available annual resources.
NASA policy requires that projects be baselined and budgeted at the 70
percent confidence level, which is used to set the cost and schedule
targets in the agency baseline commitment, and funded at a level
equivalent to at least the 50 percent confidence level, which is used to set
the targets in the project management agreement. 4 According to NASA
officials, this would include cost reserves held at the directorate and
project level to address project risks. The total amount of reserves held at
the project level varies based on where the project is in its life cycle.
Figure 2 notionally depicts how NASA would allocate funding reserves for
a project that was baselined in accordance with policy.

4
 NASA Procedural Requirements (NPR) 7120.5E NASA Space Flight Program and
Project Management Requirements para 2.4.4 (Aug. 14, 2012) (hereinafter cited as NPR
7120.5E (Aug. 14, 2012). The decision authority for a project can approve it to move
forward at less than the 70 percent confidence level. That decision must be justified and
documented.

Page 4                                 GAO-16-309SP Assessments of Major NASA Projects
Figure 2: Notional Allocation of Funding Reserves for a Project Budgeted at the 70
                         Percent Confidence Level

                         After a project is confirmed, it begins implementation, consisting of
                         phases C, D, E, and F. In this report, we refer to projects in phase C and
                         D as being in development. A second design review, the critical design
                         review, is held during the latter half of phase C in order to determine if the
                         design is stable enough to support proceeding with the final design and
                         fabrication. After the critical design review and just prior to beginning
                         phase D, the project completes a system integration review to evaluate
                         the readiness of the project and associated supporting infrastructure to
                         begin system assembly, integration and test. In phase D, the project
                         performs system assembly, integration, test, and launch activities.
                         Phases E and F consist of operations and sustainment and project
                         closeout.

NASA Projects Reviewed   NASA’s portfolio of major projects ranges from satellites equipped with
in GAO’s Annual          advanced sensors to study the Earth to a spacecraft that will return a
                         sample from an asteroid to a telescope intended to explore the universe
Assessment
                         to spacecraft to transport humans and cargo to and beyond low Earth
                         orbit. When NASA determines that a project will have a life-cycle cost
                         estimate of more than $250 million for formulation and implementation,

                         Page 5                              GAO-16-309SP Assessments of Major NASA Projects
we include that project in our next annual review. The year after a project launches or reaches full operational capability, we no longer include an assessment of it in our annual report. This report includes assessments of 18 major NASA projects. Four projects are being assessed for the first time this year: The Asteroid Robotic Redirect Mission (ARRM), Europa, Exploration Ground Systems (EGS), and Ionospheric Connection (ICON). We also assessed the Commercial Crew Program. We originally assessed that program in 2014, but it was excluded from last year’s review due to a bid protest. Figure 3 includes more information on these projects. Appendix II includes a list of all the projects that we have reviewed from 2009 to 2016. Page 6 GAO-16-309SP Assessments of Major NASA Projects
Figure 3: Major NASA Projects Reviewed in GAO’s 2016 Assessment
a
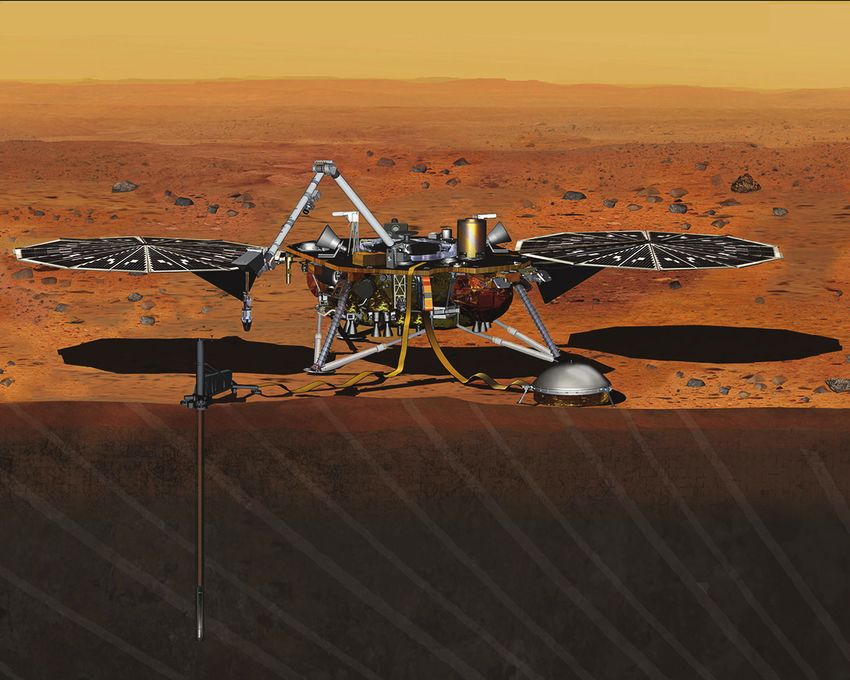
In December 2015, NASA announced that InSight would not launch in March 2016 as planned due
to problems with a key instrument that is being provided by an international partner. Information on
the cost and schedule effects of this decision was not available at the time of our review.
b
In February 2016, NASA reclassified SGSS as a sustainment effort, rather than a major project.
Since SGSS was part of NASA’s major project portfolio during our review, it is included in our
assessment. Cost and schedule information in the figure reflects SGSS’s July 2015 approved
baseline. Its current cost and schedule is under review.
c
The Commercial Crew Program is implementing a tailored version of NASA’s space flight project life
cycle, but it is currently completing development activities typically associated with implementation.
Page 7 GAO-16-309SP Assessments of Major NASA ProjectsThe cost and schedule performance of NASA’s portfolio of major projects
NASA Cost and in development has improved over the past 5 years and most current
Schedule projects are adhering to their committed cost and schedule baselines.
Over the past 2 years, eight projects in the portfolio established cost and
Performance schedule baselines. As the average age of the portfolio has decreased,
Continues Positive the cost performance of the portfolio has improved because new projects
are less likely to have experienced cost growth. Despite NASA’s
Trend, but Its Largest improved overall performance, its portfolio of major projects continues to
Projects Face experience cost and schedule growth. NASA has realized significant cost
or schedule growth for at least one major project for 8 out of the last 9
Significant Risks years. This often occurs as projects prepare to begin system assembly,
integration, and test; nine projects will be in that phase of development in
2016, including the Orion Multi-Purpose Crew Vehicle (Orion) and Space
Launch System, which include significant development risks.
Overall Cost Performance The cost and schedule performance of NASA’s portfolio of major projects
Continues to Improve Due in development continues to improve. In 2016, overall development cost
growth for the portfolio of 12 development projects, excluding the James
to Addition of New, Large
Webb Space Telescope (JWST), fell to 1.3 percent and launch delays
Programs averaged 4 months. Both of those measures are at or near the lowest
levels we have reported since we began our annual reviews in 2009 (see
fig. 4). We have historically presented cost and schedule growth both
including and excluding JWST because, prior to 2015, it was the only
project with a development cost baseline significantly larger than the
other projects in development. Further, the magnitude of JWST’s cost
growth is considerably larger than that of the other projects in the
portfolio. Thus, it masked the performance of the remainder of the
portfolio.
Page 8 GAO-16-309SP Assessments of Major NASA ProjectsFigure 4: Development Cost Performance and Average Months Spent in the Development Phase for Major NASA Projects from 2009 through 2016 Note: Includes projects in development. The average age of projects is the average length of time projects in the portfolio have been in development. The overall cost performance of the NASA major projects portfolio has improved, in part, due to the addition of new, large programs. The cost and schedule performance of any portfolio is driven, in part, by its composition. New projects are less likely to have experienced cost and schedule growth than older ones, so they generally help improve portfolio performance. Figure 4 helps illustrate the effect new projects have on portfolio cost performance. Eight of the 12 major projects in development established baselines within the last 2 years, and cost and schedule performance collectively has improved as projects in the portfolio have become, on average, younger. The positive effect of these new projects on the portfolio’s cost performance increases when the estimated cost of those new projects is relatively large and the development baseline against which portfolio cost growth is measured also grows. In other words, large increases in the development cost baseline—which is the denominator when calculating Page 9 GAO-16-309SP Assessments of Major NASA Projects
the percentage cost growth in the portfolio—can help drive cost growth
percentages down. For example, 5 percent portfolio cost growth becomes
2.5 percent cost growth if the size of the development baseline doubles.
In the past 2 years, the addition of the Space Launch System ($7.0 billion
for implementation) and Orion ($6.8 billion for implementation) to the
portfolio has more than doubled the portfolio’s development cost baseline
and helped make the 2016 portfolio the most expensive collection of
NASA projects in development since we began our annual assessments
in 2009 although it is among the smallest assessed to date in terms of
number of projects (see fig. 5). If those two programs are excluded, cost
growth this year increases from 1.3 to 6.8 percent. We reported similar
findings last year when NASA added five new projects to the portfolio. 5

Figure 5: Total Number and Development Cost Growth of NASA Major Projects with
Established Cost Baselines from 2009 through 2016

Note: Includes projects in development.

5
 GAO, NASA: Assessments of Selected Large-Scale Projects [Reissued on March 26,
2015], GAO-15-320SP (Washington, D.C.: Mar. 24, 2015).

Page 10                                   GAO-16-309SP Assessments of Major NASA Projects
Most Current Projects                                            Most current NASA projects have stayed within the cost and schedule
Performed Well, but                                              estimates in their development baselines, both this year and throughout
                                                                 their life cycles, but the portfolio continues to experience cost and
Project Rebaselines Still
                                                                 schedule growth. This growth was driven by projects that experienced
Occur in Most Years                                              significant cost growth and exceeded their development cost baselines.
                                                                 When a project exceeds its development cost baseline by 30 percent, it is
                                                                 rebaselined if it is to be continued. NASA has rebaselined a major project
                                                                 each year for 8 out of the last 9 years. Table 1 shows the development
                                                                 cost growth for each of the rebaselined projects.

Table 1: Development Cost Growth on NASA Major Projects Rebaselined from 2007 through 2015

 Year                                               2007             2008          2009            2010            2011              2012                2013              2014            2015
                                                                                                                                           a                                                        b
 Rebaselined project                             SOFIA               NPP          Glory            MSL            JWST           OCO-2                  None         ICESat-2           SGSS
 Development cost growth                         $742.9         $252.2          $170.6          $799.9        $3,607.7              $71.3               Not             $204.8          $308.7
 (in millions)                                                                                                                                   applicable

Legend: SOFIA: Stratospheric Observatory for Infrared Astronomy; NPP: National Polar-orbiting Operational Environmental Satellite System Preparatory Project; MSL: Mars Science Laboratory; JWST:
James Webb Space Telescope; OCO-2: Orbiting Carbon Observatory 2; ICESat-2: Ice, Cloud, and Land Elevation Satellite-2; SGSS: Space Network Ground Segment Sustainment
Source: GAO analysis of NASA data. | GAO-16-309SP
                                                                 a
                                                                  The OCO-2 rebaseline was driven by launch vehicle failures, which were external to the project.
                                                                 b
                                                                  In July 2015, NASA approved a new cost and schedule baseline for SGSS, which is reflected in the
                                                                 table. Subsequently, in February 2016, NASA reclassified SGSS as a sustainment effort, rather than
                                                                 a major project. Since SGSS was part of NASA’s major project portfolio during our review, it is
                                                                 included in our analysis.

                                                                 The cost growth associated with rebaselined projects often overwhelms
                                                                 the positive cost performance within the remainder of the portfolio both on
                                                                 an annual and life-cycle basis. In July 2015, NASA approved a new
                                                                 baseline for the Space Network Ground Segment Sustainment (SGSS)
                                                                 project, which increased its estimated development costs from $368
                                                                 million to $677 million and extended its completion date from June 2017
                                                                 to September 2019. Cost growth from the SGSS project was not offset by
                                                                 better performing projects, such as the Origins-Spectral Interpretation-
                                                                 Resource Identification-Security-Regolith Explorer (OSIRIS-REx) asteroid
                                                                 sampling mission. OSIRIS-REx reported lower than expected
                                                                 development costs for the second consecutive year, even though it is at a
                                                                 stage in the life cycle when projects often realize cost growth. The project
                                                                 attributes its $78.2 million decrease in development cost to several
                                                                 factors, including a mature mission concept and rigorous risk
                                                                 management process. Orion also reported a decrease in development
                                                                 costs of $156.4 million, but this was due to the program shifting funds
                                                                 from the development to the formulation phase, not improved program
                                                                 execution. Table 2 provides data on the cost and schedule performance

                                                                 Page 11                                                  GAO-16-309SP Assessments of Major NASA Projects
for the 12 major projects in NASA’s current portfolio that are in
development.
Table 2: Development Cost and Schedule Performance of NASA Major Projects Currently in Development
Overall Project Confirmation Cumulative changes since project
performance name date Changes since March 2015 confirmation
Year Cost Schedule Cost Schedule
(millions) (months) (millions) (months)
Cost savings OSIRIS-REx 2013 -$9.3 0 -$78.2 0
GRACE-FO 2014 $0.6 0 -$0.6 0
ICON 2014 -$0.2 0 -$0.2 0
SPP 2014 -$5.4 0 -$5.4 0
TESS 2014 $0.0 0 -$26.8 0
a
Orion 2015 -$156.4 0 -$156.4 0
b
Within baseline InSight 2014 $0.0 0 $0.0 0
SLS 2014 $0.0 0 $0.0 0
c
EGS 2014 $3.6 0 $3.6 0
Rebaseline JWST 2008 -$1.6 0 $3,607.7 52
ICESat-2 2012 $0.0 0 $204.8 13
d
SGSS 2013 $308.7 27 $308.7 27
Total: $140.0 27 $3,857.2 92
Legend: OSIRIS-REx: Origins-Spectral Interpretation-Resource Identification-Security-Regolith Explorer; GRACE-FO: Gravity Recovery and Climate Experiment Follow-On; ICON: Ionospheric
Connection; SPP: Solar Probe Plus; TESS: Transiting Exoplanet Survey Satellite; Orion: Orion Multi-Purpose Crew Vehicle; InSight: Interior Exploration using Seismic Investigations, Geodesy, and Heat
Transport; SLS: Space Launch System; EGS: Exploration Ground Systems; JWST: James Webb Space Telescope; ICESat-2: Ice, Cloud, and Land Elevation Satellite-2; SGSS: Space Network Ground
Segment Sustainment
Source: GAO analysis of NASA data. | GAO-16-309SP
Note: Positive values indicate cost growth or launch delays. Negative values indicate cost decreases
or earlier than planned launch dates.
a
The Orion program shifted funds from development to formulation. The total estimated cost remains
unchanged.
b
In December 2015, NASA announced that InSight would not launch in March 2016 as planned due
to problems with a key instrument. Information on the cost and schedule effects of this decision was
not available at the time of our review.
c
The EGS program shifted funds from formulation to development, but remains within its overall cost
baseline.
d
In February 2016 NASA reclassified SGSS as a sustainment effort, rather than a major project. Cost
and schedule information in the figure reflects SGSS’s July 2015 approved baseline. Its current cost
and schedule is under review.
Page 12 GAO-16-309SP Assessments of Major NASA ProjectsNASA’s Highest Cost The projects in NASA’s current portfolio with the highest development
Projects Are Entering costs, including the Space Launch System and Orion, are entering the
stage when most rebaselines occur. Projects appear most likely to
Stage When Most
rebaseline between their critical design and system integration reviews.
Rebaselines Occur All eight major projects that rebaselined during the last nine years did so
after their critical design review and the three projects in the 2016
portfolio that rebaselined did so before holding their systems integration
review. 6 Table 3 lists the nine projects in the current portfolio that are in
this stage of development. Three projects—ICESat-2, JWST, and
SGSS—have already rebaselined. If a rebaseline occurs on any of the
other six projects, it could add anywhere from almost $60 million to more
than $2 billion to the development cost of the portfolio. This range is
based on 30 percent development cost growth—which is the percent
growth that triggers a rebaseline—for the projects with the lowest and
highest development cost in table 3.
Table 3: Current Projects between Critical Design Review and Systems Integration Review
Project Critical design review date Systems integration review date
Solar Probe Plus (SPP) March 2015 May 2016
Ionospheric Connection (ICON) April 2015 June 2016
a
Ice, Cloud, and Land Elevation Satellite-2 (ICESat-2) February 2014 October 2016
Transiting Exoplanet Survey Satellite (TESS) August 2015 October 2016
Exploration Ground Systems (EGS) December 2015 February 2017
a
James Webb Space Telescope (JWST) March 2010 July 2017
a
Space Network Ground Segment Sustainment (SGSS) June 2013 August 2017
b
Space Launch System (SLS) July 2015 January 2018
Orion Multi-Purpose Crew Vehicle (Orion) October 2015 September 2020
Source: GAO analysis of NASA data. | GAO-16-309SP
a
The system integration review dates are for the project’s rebaselined schedule.
b
The Space Launch System does not have a system integration review. The program’s next major
system engineering milestone is its planned January 2018 design certification review, which is
intended to ensure that the design meets functional and performance requirements and is ready for
operation.
6
Four of the eight rebaselined projects did not hold a systems integration review. NASA
established this milestone in 2007 after four of the eight projects originally baselined and
therefore it was not a requirement for these projects.
Page 13 GAO-16-309SP Assessments of Major NASA ProjectsThe Space Launch System and Orion, the two largest projects in this
critical stage of development, face cost, schedule, and technical risks. For
example, the Space Launch System program has expended significant
amounts of schedule reserve over the past year to address delays with
development of the core stage, which is the Space Launch System’s
propellant tank and structural backbone. The Orion program continues to
face design challenges, which include redesigning the heat shield
following the determination that the previous design used in the first flight
test in December 2014 would not meet requirements for the first
uncrewed flight. The standing review boards for each program have
raised concerns about the programs’ abilities to remain within their cost
and schedule baselines. If cost overruns materialize on these programs, it
could have a ripple effect on the portfolio and result in the postponement
or cancellation of projects in earlier stages of development.
NASA has maintained recent improvements in the technology maturity
NASA Has and design stability of its projects. As of 2015, 9 of the 11 major projects
Maintained Recent that have passed the preliminary design review have matured all
technologies to the level recommended by GAO best practices—
Improvements in continuing a positive trend. This includes one new project since March
Technology Maturity 2015. Projects entering implementation in recent years also appear to be
less technically ambitious and rely more heavily on existing technologies,
and Design Stability but this trend could be changing on planned projects. The portfolio also
sustained previous improvements in design stability as measured against
GAO best practices and continued to minimize late design changes.
Three of the six projects that held a critical design review in 2015 met
GAO best practice for design stability.
NASA Continues to Most NASA projects are meeting GAO best practices for technology
Improve the Technology maturity. As of 2015, 9 of the 11 major projects in NASA’s portfolio that
have passed the preliminary design review have matured all heritage or
Maturity of Its Projects
critical technologies to a technology readiness level 6—a large increase
Page 14 GAO-16-309SP Assessments of Major NASA Projectssince 2010 (see fig. 6). 7 The 12th project in development, EGS, did not report any critical or heritage technologies, so it was omitted from this analysis. ICON, the sole new project in this year’s portfolio that held its preliminary design review and identified critical or heritage technologies, was 1 of the 9 projects that achieved the level of technology maturity recommended by our best practices. Figure 6: Percentage and Number of NASA’s Major Projects Attaining Technology Maturity by Preliminary Design Review from 2010 through 2016 Note: Totals may not add to 100 percent due to rounding. 7 NASA distinguishes critical technologies from heritage technologies. Our product development best practices do not make this distinction. We describe critical technologies as those that are required for the project to successfully meet customer requirements, which can include both existing or heritage technology or new technology. Therefore, to assess overall technology maturity, we analyzed the maturity of heritage and critical technologies that NASA reported for projects in our data collection instrument. In other analyses, which focus on the number of new technologies being used by programs, we maintain NASA’s distinction between critical and heritage technologies. Appendix III provides a description of technology readiness levels, which are the metrics used to assess technology maturity. Page 15 GAO-16-309SP Assessments of Major NASA Projects
Our best practices work has shown that reaching technology readiness
                             level 6—which indicates that a representative prototype of the technology
                             has been demonstrated in a relevant environment that simulates the
                             harsh conditions of space—can minimize risks for space systems
                             entering product development. Projects falling short of this standard
                             before the preliminary design review, a milestone that generally precedes
                             the project’s final design and fabrication phase, may experience
                             subsequent technical problems, which can result in cost growth and
                             schedule delays. For example, in previous years we reported that the Soil
                             Moisture Active and Passive (SMAP) mission had not matured any of its
                             heritage technologies by its preliminary design review, including the radar
                             system which failed in space shortly after it began operating. During
                             development, SMAP also encountered technology risks and experienced
                             schedule delays associated with other heritage technologies, such as its
                             radar reflector boom assembly. 8 In 2010, the National Research Council
                             found that instrument development problems, including lack of detail or
                             failure to identify technical challenges, may be the largest element of
                             mission cost growth within the control of a project. 9

Most NASA Projects           The average number of critical technologies employed across NASA’s
Continue to Employ Few       portfolio of major projects in implementation remains 2.3, which is the
                             same as last year and down from the average of 4.9 critical technologies
Critical Technologies, but
                             in 2009. Over the last 4 years, the average number of critical technologies
Planned Projects Will        employed has not varied to any significant degree (see fig. 7). The higher
Require More Technology      averages in 2009 and 2010 were primarily driven by the Herschel project,
Development                  which launched in 2010. This project developed 25 critical technologies,
                             which represented over 35 percent of the critical technologies employed
                             by the portfolio during 2009 and 2010.

                             8
                              GAO, NASA: Assessments of Selected Large-Scale Projects, GAO-12-207SP
                             (Washington, D.C.: Mar. 1, 2012), GAO-15-320SP.
                             9
                              National Research Council of the National Academies, Controlling Cost Growth of NASA
                             Earth and Space Science Missions (Washington, D.C.: National Academies Press, 2010),
                             28.

                             Page 16                              GAO-16-309SP Assessments of Major NASA Projects
Figure 7: Average Number of Critical Technologies Reported by NASA for Major Projects in Development from 2009 through 2016 Since 2009, an increasing majority of NASA’s major projects have relied on the use of existing or heritage technologies that have been used on previous projects or missions, with only a small number of projects containing the majority of critical technologies (see fig. 8). Page 17 GAO-16-309SP Assessments of Major NASA Projects
Figure 8: Major Projects by Number of Critical Technologies Reported by NASA
from 2009 through 2016

In 2009, 7 of 12 projects employed three or more critical technologies; in
2016, it was 3 of 12 projects. Additionally, 19 of the 28 critical
technologies employed across this year’s portfolio originate from two
projects, JWST and Solar Probe Plus (SPP). The remaining 10 projects
employ a combined 9 critical technologies. Five projects in this year’s
portfolio reported that they were not employing any critical technologies.
Those projects are employing 10 heritage technologies.

NASA officials suggested that the composition of the portfolio, which now
includes more competed missions, could be decreasing the level of
technology innovation proposed for projects, and by extension the
number of critical technologies. In the Science Mission Directorate, there
are two types of missions: competed missions and directed, or strategic,

Page 18                            GAO-16-309SP Assessments of Major NASA Projects
missions. Competed missions intend to address science objectives
through mission proposals, which are generally solicited via
announcements of opportunity. 10 Directed missions are usually large and
multi-purpose and are generally assigned to a NASA center to implement,
with science instruments and platform components selected in open
competitions. Officials from NASA’s Office of the Chief Technologist told
us that they believe that teams may not propose projects that utilize new
technologies for competed missions because of the perceived cost or
schedule risks. These officials are concerned that the pressure to meet
cost and schedule could drive out more technologically ambitious
projects. Our best practices criteria do not focus on the number of new
technologies, but rather their maturity, when considering their effect on
cost and schedule risk. The four competed Science Mission Directorate
projects in this year’s portfolio that are in development have a total of six
critical technologies. Its four directed missions are developing twenty-one
critical technologies, although this is primarily driven by SPP and JWST.

While projects entering development in recent years appear to be less
technically ambitious and rely more heavily on existing technologies, this
trend could be changing for science and human exploration missions.
Three of the five projects currently in formulation—Mars 2020, Surface
Water and Ocean Topography (SWOT), and ARRM—are developing four
or more critical technologies. Mars 2020 is developing seven technologies
and both SWOT and ARRM are developing four. Mars 2020 and ARRM
are both developing critical technologies that include technology
demonstrations for future Mars missions. For example, NASA expects
ARRM to provide opportunities to demonstrate technical capabilities
important for longer-duration, deep space missions, such as flight-testing
solar electric propulsion. 11 For ARRM and Mars 2020, the majority of the
critical technologies are currently considered immature—technology
readiness level 5 or less—and will require significant development work to
reach maturity by the projects’ preliminary design reviews. As NASA
continues to add more complex projects with a high number of critical
technologies to its portfolio, ensuring that these technologies are matured

10
  For example, for NASA’s Discovery program, mission proposals are solicited from teams
comprised of people from universities, NASA centers, Federally Funded Research and
Development Centers, industry, and small businesses, and led by a principal investigator.
11
  Solar electric propulsion uses energy from the sun to accelerate ionized propellant,
which can provide a relatively low level of thrust for months or years, allowing more mass
to be transported with less propellant.

Page 19                                 GAO-16-309SP Assessments of Major NASA Projects
prior to project implementation will help to decrease the risk of cost and
                           schedule growth.

NASA Has Sustained Prior   NASA continued to sustain improvements in the design stability of its
Improvement in Design      major projects, but still falls short of GAO best practices. The average
                           percentage of engineering drawings released at critical design review for
Stability
                           NASA’s portfolio of major projects was 72 percent, roughly the same
                           percentage as last year. This figure is short of the GAO best practice
                           benchmark of 90 percent, but sustains improvements that began in
                           previous years (see fig. 9). Further, a majority of projects in development
                           maintained mass and power reserves that met or exceeded NASA
                           requirements.

                           Figure 9: Average Percentage of Releasable Engineering Drawings for NASA Major
                           Projects at Critical Design Review from 2010 through 2016

                           Page 20                           GAO-16-309SP Assessments of Major NASA Projects
Our work on product development best practices shows that at least 90 percent of engineering drawings should be releasable by the critical design review to lower the risk of subsequent cost and schedule growth. 12 The NASA Systems Engineering Handbook also includes this metric. In 2012, NASA established additional technical leading indicators to assess design maturity. These indicators include (1) the percentage of actual mass margin versus planned mass margin and (2) the percentage of actual power margin versus planned power margin. 13 NASA has updated its project management policy and its systems engineering policy to require projects to track these metrics. Projects that do not achieve design stability by critical design review may experience design changes and manufacturing problems, which can result in cost growth and schedule delays. For example, the cryocooler system and sunshield for the JWST had 60 percent and 34 percent of their respective drawings complete by critical design review. Each has presented technical and manufacturing challenges for the project and its contractors since that time. Three of the six projects that passed the critical design review since March 2015 met our best practices for design stability. EGS, ICON, and the Space Launch System each released more than 90 percent of 12 Appendix IV contains detailed information about the project attributes highlighted by knowledge-based metrics at each stage of a system’s development. Engineering drawings are considered to be a good measure of the demonstrated stability of a product’s design because the drawings represent the language used by engineers to communicate to the manufacturers the details of a new product design—what it looks like, how its components interface, how it functions, how to build it, and what critical materials and processes are required to fabricate and test it. Once the design of a product is finalized, the drawing is “releasable.” The critical design review is the time in the project’s life cycle when the integrity of the project design and its ability to meet mission requirements is assessed. It is important that a project’s design is stable enough to warrant continuing with the final design and fabrication phase. If a project experiences a large amount of drawing growth after critical design review, this may be an indicator of instability in the project design late in the development cycle. A stable design allows projects to “freeze” the design and minimize changes prior to beginning the fabrication of hardware, after which time reengineering and re-work efforts due to design changes can be costly to the project in terms of time and funding. 13 Mass is a measurement of how much matter is in an object. It is related to an object’s weight, which is mathematically equal to mass multiplied by acceleration due to gravity. Margin is the spare amount of mass or power allowed or given for contingencies or special situations. Some centers provide additional guidance for mass margins including frequency of reporting and the percentage of mass margin required at various points in project development, with required margins ranging from 30 to 0 percent, depending on where a project is in the development cycle. Page 21 GAO-16-309SP Assessments of Major NASA Projects
engineering drawings by their critical design reviews. Orion, SPP, and
Transiting Exoplanet Survey Satellite (TESS) fell short of this metric. SPP
only released 34 percent of its engineering drawings by the critical design
review, which could increase the risk of future cost growth or schedule
delays. The project’s standing review board raised a concern about this
approach and required the project to prepare a schedule for releasing the
remaining design drawings. SPP project officials explained that the low
drawing percentage stemmed from the project’s decision to hold its
critical design review early in order to begin building key components,
including the flight cooling system, which would take 2 years to complete.
The project has a 2018 planetary launch window and it needed to begin
manufacturing the flight cooling system to remain on schedule. When the
project held its critical design review, 100 percent of the flight cooling
system engineering drawings had been released. As of December 2015,
the project has released 84 percent of its total drawings and expects to
have released the majority of the drawings by its May 2016 system
integration review.

NASA projects have also continued to minimize design changes after the
critical design review—another measure of design stability. For the eleven
projects in development that have held critical design reviews,
engineering drawing growth after the review was 10 percent, which is
similar to last year (see fig. 10). This is a significant improvement since
2010 when the average drawing growth was 182 percent. By maintaining
design stability following the critical design review, NASA may reduce the
likelihood of cost growth and schedule delays resulting from late design
changes.

Page 22                          GAO-16-309SP Assessments of Major NASA Projects
Figure 10: Average Percentage of Drawing Growth after Critical Design Review for
                        NASA Major Projects from 2010 through 2016

                        NASA has continued to implement improved project management tools to
NASA Has Made           manage acquisition risks, but these efforts have not always been
Progress on             consistent with best practices in areas such as cost estimating and
                        earned value management (EVM). Project oversight could emerge as a
Implementing Tools to   new risk area due to NASA’s plans to dissolve its office of independent
Reduce Acquisition      program assessment and transfer that function to the mission directorates
                        that manage major projects. Finally, while we have noted improvements
Risks, but Faces        in NASA’s development cost performance, our analysis of recently
Several Challenges      launched science missions showed that NASA’s operations cost
                        baselines are often not good estimates of actual operations costs.

                        Page 23                             GAO-16-309SP Assessments of Major NASA Projects
NASA Continues to NASA continues to implement tools to improve its cost and schedule
Improve Its Cost estimates, but inconsistent application of best practices and concerns
about data quality remain. In 2009, in order to ensure that cost and
Management Tools but
schedule estimates were realistic and projects thoroughly planned for
Has Not Implemented anticipated risks, NASA began requiring that programs and projects with
Best Practices estimated life-cycle costs of $250 million or more develop a joint cost and
schedule confidence level (JCL) prior to project confirmation. 14 However,
there is no requirement for NASA projects to update their JCLs and our
prior work has found that projects do not regularly update cost risk
analyses to take into account newly emerged risks. 15 Our cost estimating
best practices recommend that cost estimates should be updated to
reflect changes to a program or kept current as it moves through
milestones. 16 As new risks emerge on a project, an updated cost risk
analysis can provide realistic estimates to decision-makers, including the
Congress. In December 2012, we recommended that the JWST project
update its JCL to make sure it reflected current program risks. 17 NASA
concurred with our recommendation, but officials subsequently stated that
they did not plan to conduct an updated joint cost and schedule
confidence level analysis and the project’s monthly analyses were
sufficient for the project’s needs. 18 NASA has since conducted other types
of cost risk analysis for the project, but has not updated its JCL. Officials
in the Independent Program Assessment Office (IPAO) told us that
projects could benefit from updating their JCL analysis at critical design
review, when they conduct another review of the project’s cost estimates
and schedule projections.
14
A JCL is a tool that assigns a confidence level, or likelihood, of a project meeting its cost
and schedule estimates..
15
GAO, Space Launch System: Management Tools Should Better Track Cost and
Schedule Commitments to Adequately Monitor Increasing Risk, GAO-15-596
(Washington, D.C.: Jul. 16, 2015), and James Webb Space Telescope: Actions Needed to
Improve Cost Estimates and Oversight of Test and Integration, GAO-13-4 (Washington,
D.C.: Dec. 3, 2012).
16
GAO, GAO Cost Estimating and Assessment Guide: Best Practices for Developing and
Managing Capital Program Costs, GAO-09-3SP (Washington, D.C.: Mar. 2, 2009).
17
GAO-13-4.
18
GAO, James Webb Space Telescope: Project Meeting Commitments but Current
Technical, Cost, and Schedule Challenges Could Affect Continued Progress, GAO-14-72
(Washington, D.C.: Jan. 8, 2014).
Page 24 GAO-16-309SP Assessments of Major NASA ProjectsAdditionally, NASA is taking steps to address another area in need of improvement across the agency—schedule development. Our best practices work stresses the importance of a reliable schedule because not only is it a road map for systematic project execution, but also a means by which to gauge progress, identify and resolve potential problems, and promote accountability. 19 According to NASA officials, a project’s ability to efficiently execute a quality JCL analysis is directly tied to the quality of the underlying data, especially a project schedule. Independent assessors—a group of technical experts within NASA who do not actively work on a specific project or program—noted that when they are reviewing a project’s JCL, one of the most common areas that projects struggle with is developing a reliable schedule. For example, the Orion program’s standing review board raised concerns that the program’s schedule is missing activities which could affect the program’s ability to accurately identify what is driving the schedule. Officials in the Cost Analysis Division told us that various schedule related tools have been developed and already made available to projects and additional tools are in development. NASA has also made progress implementing EVM analysis—another key project management tool—but the agency has not yet fully implemented a formal EVM surveillance plan in accordance with best practices. EVM has been a critical part of the agency’s efforts to understand project development needs and to reduce cost and schedule growth. When implemented well, EVM integrates information on a project’s cost, schedule, and technical efforts for management and decision makers by measuring the value of work accomplished in a given period and comparing it with the planned value of work scheduled for that period and the actual cost of work accomplished. NASA rolls out EVM to its centers by using one project to implement its EVM capability process. NASA has completed this process at Goddard Space Flight Center, Marshall Space Flight Center, and Kennedy Space Center, and in 2015 expanded this effort to Johnson Space Center using the Orion project. These four centers account for 98 percent of NASA’s spaceflight projects that require the use of EVM. NASA plans to roll out the EVM capabilities process to Glenn Research Center in fiscal year 2016 and Langley Research Center in fiscal year 2017. The agency is also working with the Applied Physics 19 GAO, GAO Schedule Assessment Guide: Best Practices for Project Schedules GAO-16-89G (Washington, D.C.: Dec. 22, 2015). Page 25 GAO-16-309SP Assessments of Major NASA Projects
You can also read