Water vapor anomaly over the tropical western Pacific in El Niño winters from radiosonde and satellite observations and ERA5 reanalysis data
←
→
Page content transcription
If your browser does not render page correctly, please read the page content below
Atmos. Chem. Phys., 21, 13553–13569, 2021
https://doi.org/10.5194/acp-21-13553-2021
© Author(s) 2021. This work is distributed under
the Creative Commons Attribution 4.0 License.

Water vapor anomaly over the tropical western Pacific in El Niño
winters from radiosonde and satellite observations and
ERA5 reanalysis data
Minkang Du1,2,3 , Kaiming Huang1,2,3 , Shaodong Zhang1,2 , Chunming Huang1,2 , Yun Gong1,2 , and Fan Yi1,2,3
1 School of Electronic Information, Wuhan University, Wuhan, China
2 Key  Laboratory of Geospace Environment and Geodesy, Ministry of Education, Wuhan, China
3 State Observatory for Atmospheric Remote Sensing, Wuhan, China

Correspondence: Kaiming Huang (hkm@whu.edu.cn)

Received: 23 April 2021 – Discussion started: 29 April 2021
Revised: 1 August 2021 – Accepted: 10 August 2021 – Published: 10 September 2021

Abstract. Using radiosonde observations at five stations         the EP and CP events are confirmed by the composite EP and
in the tropical western Pacific and reanalysis data for the      CP El Niños based on the reanalysis data for 41 years. Owing
15 years from 2005 to 2019, we report an extremely negative      to the anomalous decrease in upward transport of water va-
anomaly in atmospheric water vapor during the super El Niño      por during the El Niño winter, lower cloud amounts and more
winter of 2015/16 and compare the anomaly with that in the       outgoing longwave radiation over the five stations are clearly
other three El Niño winters of the period. A strong specific     presented in satellite observation. In addition, a detailed com-
humidity anomaly is concentrated below 8 km of the tropo-        parison of water vapor in the reanalysis, radiosonde, and
sphere with a peak at 2.5–3.5 km, and a column-integrated        satellite data shows a fine confidence level for the datasets;
water vapor mass anomaly over the five radiosonde sites has      nevertheless, the reanalysis seems to slightly underestimate
a large negative correlation coefficient of −0.63 with the       the water vapor over the five stations in the 2009/10 winter.
oceanic Niño3.4 index but with a lag of about 2–3 months.
In general, the tropical circulation anomaly in the El Niño
winter is characterized by divergence (convergence) in the
lower troposphere over the tropical western (eastern) Pacific;   1   Introduction
thus, the water vapor decreases over the tropical western
Pacific as upward motion is suppressed. The variability of       As a dominant greenhouse gas in the atmosphere, water
the Hadley circulation is quite small and has little influence   vapor has a profound impact on global energy budgets
on the observed water vapor anomaly. The anomaly of the          through not only latent heat release upon phase transitions
Walker circulation makes a considerable contribution to the      (Held and Soden, 2000) but also cloud formation that re-
total anomaly in all four El Niño winters, especially in the     flects longwave radiation from below and shortwave radi-
2006/07 and 2015/16 eastern Pacific (EP) El Niño events.         ation from above (Stevens et al., 2017); thus, water vapor
The monsoon circulation shows a remarkable change from           plays a substantial role in the formation and evolution of
one event to another, and its anomaly is large in the 2009/10    the climate system. The tropical Pacific is a major convec-
and 2018/19 central Pacific (CP) El Niño winters and small       tion center and a region with abundant water vapor. Sea
in the two EP El Niño winters. The observed water vapor          surface temperature (SST) anomalies in the tropical Pacific
anomaly is caused mainly by the Walker circulation anomaly       have an important influence on water vapor transport, cloud
in the super EP event of 2015/16 but is caused by the mon-       cover, and precipitation distribution due to the tropical cir-
soon circulation anomaly in the strong CP event of 2009/10.      culation changes caused by El Niño–Southern Oscillation
The roles of the Hadley, Walker, and monsoon circulations in     (ENSO). ENSO is characterized by anomalous SST in the
                                                                 tropical Pacific. During ENSO, there is significant precipi-

Published by Copernicus Publications on behalf of the European Geosciences Union.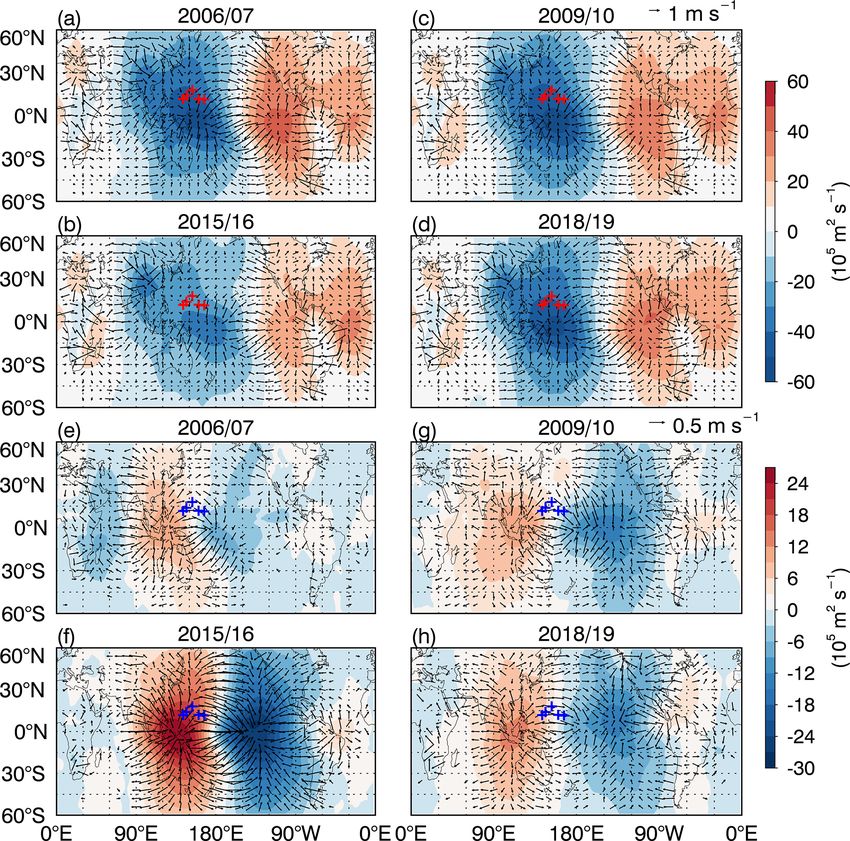
13554                              M. Du et al.: Water vapor anomaly over the tropical western Pacific in El Niño winters

tation variability in the Euro-Mediterranean (López-Parages        observed in the equatorial Pacific during the onset of the
and Rodríguez-Fonseca, 2012), Middle East (Sandeep and             2015/16 event (Gasparin and Roemmich, 2016), and rainfall
Ajayamohan, 2018), southwest central Asia (Mariotti, 2007),        δ 18 O in southern Papua was generally enriched by 1.6 ‰–
western Africa (Okazaki et al., 2015), Pacific Ocean (Quartly      2 ‰ during the 2015 El Niño more than during the 2013/14
et al., 2000), and continental USA (Lee et al., 2014). ENSO        ENSO-normal period (Permana et al., 2016). Owing to con-
has an effect on seasonal rainfall in East Asia by inducing        vection anomaly during the 2015/16 El Niño, water vapor in
a weaker and later onset of the Indian monsoon circulation         the tropical lower stratosphere was increased by hydration of
(Dai and Wigley, 2000; Zhao et al., 2010; Yan et al., 2018).       the lower stratosphere through convectively detrained cloud
Vertical cloud anomalies in the tropical Atlantic from Aqua        ice (Avery et al., 2017), and quasi-biennial oscillation in the
Moderate-Resolution Imaging Spectroradiometer are linked           tropical stratospheric wind was disrupted because of dra-
to ENSO-induced shift and weakening of the Walker circu-           matic relocation of deep convection (Dunkerton, 2016; New-
lation and Hadley cell near the Equator (Madenach et al.,          man et al., 2016). Hence, the 2015/16 El Niño had important
2019). The strong 1997/98 El Niño resulted in cloud struc-         influences on the circulation and composition transport and
ture anomalies and their radiative property changes over the       the mass exchange between the troposphere and stratosphere.
tropical Pacific (Sun et al., 2012) and increased upper tropo-     In this paper, we investigate the water vapor anomaly over
spheric cirrus over the mid-Pacific but decreased cirrus over      the tropical western Pacific in the CP and EP El Niño events
Indonesia (Massie et al., 2000). Numerical investigation also      from radiosonde and satellite observations, particularly the
indicated that warm-water volume transport and precipitation       extreme anomaly in the 2015/16 super El Niño winter, and
change are associated with ENSO (Ishida et al., 2008; Hill et      explore the contributions of the tropical Hadley, Walker, and
al., 2009).                                                        monsoon circulation changes to the observed water vapor
   El Niño is generally classified into central Pacific (CP) El    anomalies in the different El Niño events.
Niño, also known as El Niño Modoki, and eastern Pacific               The data used are briefly described in Sect. 2. In Sect. 3,
(EP) El Niño based on distinct spatial distributions of warm-      water vapor anomalies in four El Niño winters are presented,
ing SST anomaly averaged over the Niño4 and Niño3 regions          and the relationship between the ENSO intensity and the wa-
(Ashok et al., 2007; Yu and Kao, 2009; Yeh et al., 2009), re-      ter vapor anomaly at the observational stations is explored.
spectively. The 2006/07 and 2015/16 events are the EP El           In Sect. 4, we decompose the tropical circulation into the
Niño because of the stronger SST anomaly during the boreal         Hadley, Walker, and monsoon circulation components and
winter (December to February, as DJF) in the Niño3 region          estimate the roles of these circulations in the water vapor
than in the Niño4 region, while correspondingly the 2009/10        variation. Tropical cloud and outgoing longwave radiation
and 2018/19 events are categorized as the CP El Niño (Yeh          (OLR) are investigated in Sect. 5. A discussion of the water
et al., 2009). The two types of El Niño have different effects     vapor data quality is provided in Sect. 6. Finally, we summa-
on precipitation, surface temperature, moisture transport, and     rize the results in Sect. 7.
carbon cycle over many parts of the world (Weng et al., 2008;
Kug et al., 2009; Wang et al., 2013; Yeh et al., 2014; Gu
and Adler, 2016; Wang et al., 2018). Su and Jiang (2013)           2   Data
and Takahashi et al. (2013) suggested that the water vapor
anomaly over the tropical ocean was mainly controlled by           In present study, we investigate the atmospheric water va-
thermodynamic process during the 2006/07 EP El Niño but            por by using radiosonde observations at five tropical sta-
by both dynamic and thermodynamic processes during the             tions for 15 years from January 2005 to December 2019,
2009/10 CP El Niño.                                                which are provided by the National Oceanic And At-
   The EP El Niño in 2015/16 winter is one of the strongest        mosphere Administration (NOAA) at the following web-
ENSO events on record. Compared to the strong 1982/83              site: https://www.ncei.noaa.gov/pub/data/igra/derived/ (last
and 1997/98 El Niños, the 2015/16 El Niño shows dis-               access: 6 September 2021). The five radiosonde stations
tinct aspects that indicate that the largest SST anomalies         are at Koror (7.33◦ N, 134.48◦ E), Yap (9.48◦ N, 138.08◦ E),
are extended toward the central Pacific (Paek et al., 2017;        Guam (13.55◦ N, 144.83◦ E), Truk (7.47◦ N, 151.85◦ E), and
L’Heureux et al., 2017). Due to their unusual characteristics,     Ponape (6.97◦ N, 158.22◦ E), located in the western Pacific
the global effects of the 2015/16 event have attracted much        warm pool. A balloon was launched twice daily at 00:00 and
attention. Palmeiro et al. (2017) proposed that an early strato-   12:00 UTC, and during balloon ascent the sensing payload
spheric final warming over the polar region and anomalous          on the balloon can obtain many meteorological parameters,
precipitation over southern Europe in 2016 were related to         such as atmospheric pressure, temperature, relative humid-
the 2015/16 super El Niño. Li et al. (2018) revealed that the      ity, and wind speed and direction. We plot daily temperature,
combined effect of the 2015 ENSO warm phase and Madden-            relative humidity, and wind speed time series observed by ra-
Julian Oscillation (MJO)-4 index negative phase caused a           diosonde to identify potential outliers, and then the high re-
significant deficit of precipitation on the Canadian Prairies      sistant asymmetric biweight technique is applied to weed out
in May and June 2015. A striking freshwater anomaly was            the outliers (Lanzante, 1996). The outlier data are very few,

Atmos. Chem. Phys., 21, 13553–13569, 2021                                          https://doi.org/10.5194/acp-21-13553-2021
M. Du et al.: Water vapor anomaly over the tropical western Pacific in El Niño winters                                      13555

and the outliers of temperature, wind, and relative humidity         summary?keywords=AIRS3STM (last access: 6 Septem-
account for only 0.09 %, 0.08 %, and 0.02 % of all observa-          ber 2021). The water vapor data contain eight levels from
tional data at the five stations over 15 years, respectively. The    1000 and 300 hPa with a latitudinal and longitudinal grid of
radiosonde data are linearly interpolated to a vertical grid         1◦ × 1◦ derived from the average of two observations in two
of 50 m, and the interpolated data below 10 km are utilized          orbital overpasses per day. The ascending and descending or-
to analyze the atmospheric water vapor variation. The burst          bits have an equatorial crossing time at 13:30 local time (LT)
height of the balloon is usually more than 30 km; thus, the          and 01:30 LT, respectively.
data availability below 10 km is high. In the period that we            The oceanic Niño index (ONI) is applied to discuss the
focus on, the data are missing for about 4, 2, 1, and 4 months       correlation between the ENSO and the observed water vapor
over Yap, Guam, Truk, and Ponape, respectively, and they are         anomaly. ONI is the measurement of ENSO strength, which
almost entirely missing from the several continuous observa-         is provided by the NOAA at https://catalog.data.gov/dataset/
tional data rather than the balloon burst data below 10 km.          climate-prediction-center-cpcoceanic-nino-index (last ac-
   Specific humidity can be derived from the profile of mete-        cess: 6 September 2021). The ONI is defined as a 3-month
orological parameters observed by radiosonde. The saturated          moving average of extended reconstructed sea surface tem-
vapor pressure es is calculated according to a modified ver-         perature (ERSST) V5 sea surface temperature anomalies in
sion of the Magnus formula as follows (Murray, 1967):                the Niño3.4 region at 5◦ N–5◦ S and 120–170◦ W (Huang et

                       17.269 (T − 273.16)
                                                                    al., 2017).
es = 6.1078 × exp                              ,               (1)      Cloud occurrence probability and OLR flux are also
                             T − 35.86
                                                                     examined since they are sensitive to water vapor variation
where T is the temperature in units of K. Following this, the        (Stevens et al., 2017; Soden et al. 2008). The OLR data
specific humidity q (g kg−1 ) is determined from the follow-         are measured by the NOAA-18 satellite, which travel in
ing equations:                                                       sun-synchronous orbit with a 13:55 LT equatorial crossing
e = RH × es ,                                                 (2)    time (Kramer, 2002). We use the monthly OLR data between
                                                                     2005 and 2019 from the NOAA archives with a latitudi-
      0.622e
q=             ,                                              (3)    nal and longitudinal grid of 2.5◦ × 2.5◦ (Liebmann and
    p − 0.378e                                                       Smith, 1996), which can be accessed through the website
where e is the vapor pressure, RH is the relative humidity,          of https://psl.noaa.gov/data/gridded/data.interp_OLR.html
and p is the pressure in units of hPa.                               (last access: 6 September 2021). The Cloud Aerosol Lidar
   In addition, we use the monthly specific humidity                 and Infrared Pathfinder Satellite Observation (CALIPSO)
and horizontal winds from the surface to 300 hPa during              satellite is able to clearly identify cloud vertical structure
the period of 2005–2019, obtained from the European                  (Winker et al., 2007). The satellite has a sun-synchronous
Centre for Medium-Range Weather Forecasts (ECMWF)                    orbit with an equatorial crossing time around 01:30 and
ERA5 reanalysis data, to investigate the water vapor                 13:30 LT (Stephens et al., 2002). Here, we use the CALIPSO
anomaly and tropical atmospheric circulation in the re-              version 1.00 lidar level 3 cloud occurrence monthly data
gion of the radiosonde stations. The reanalysis data are             in a latitudinal and longitudinal grid of 2◦ × 2.5◦ with
produced by a sequential 4D variational data assimilation            an altitude resolution of 60 m above the mean sea level,
scheme, with a latitudinal and longitudinal resolution of            and the available data are from June 2006 to Decem-
0.25◦ × 0.25◦ at 37 pressure levels from 1000 to 1 hPa               ber 2016, downloaded from the website of the NASA at
(Hersbach et al., 2020). The data are available at the web-          https://asdc.larc.nasa.gov/project/CALIPSO/CAL_LID_L3_
site of https://cds.climate.copernicus.eu/cdsapp#!/dataset/          Cloud_Occurrence-Standard-V1-00_V1-00 (last access:
reanalysis-era5-pressure-levels-monthly-means?tab=form               6 September 2021)
(last access: 6 September 2021).
   To assess the atmospheric water vapor as compared to
the reanalysis data and the radiosonde observations, a fur-          3     Water vapor anomaly
ther evaluation is carried out using Aqua atmospheric in-
frared sounder (AIRS) water vapor mass mixing ratio data             3.1    Water vapor anomaly during El Niño winter
from 2005–2019. AIRS is a hyperspectral infrared spectrom-
eter orbiting on the National Aeronautics and Space Admin-           We derive the profile of specific humidity from the ra-
istration (NASA) Aqua spacecraft launched in May 2002,               diosonde observations according to Eqs. (1)–(3) and then
which can provide accurate measurements of temperature,              calculate the monthly mean specific humidity. The monthly
moisture, and other atmospheric variables (Aumann et al.,            mean specific humidities in all the same months are further
2003). The data used here are water vapor vertical profiles          averaged to obtain the monthly climatic normal; thus, the
from Level 3 monthly standard gridded retrieval product ver-         monthly mean water vapor anomaly is determined from the
sion 6, AIRS3STM (Susskind et al., 2014), which are avail-           monthly mean series by subtracting the corresponding month
able at https://disc.gsfc.nasa.gov/datasets/AIRS3STM_006/            climatic normal. Figure 1 shows the monthly mean specific

https://doi.org/10.5194/acp-21-13553-2021                                          Atmos. Chem. Phys., 21, 13553–13569, 2021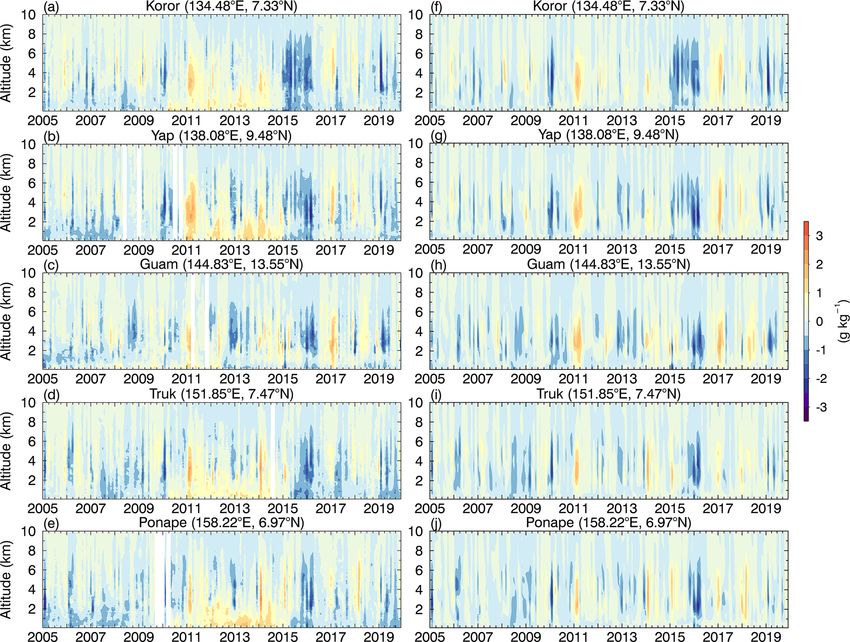
13556 M. Du et al.: Water vapor anomaly over the tropical western Pacific in El Niño winters
humidity anomaly based on the radiosonde observations at different El Niño types, whereas in the other two events, the
Koror, Yap, Guam, Truk, and Ponape from January 2005 to water vapor anomaly is weak, which is in rough agreement
December 2019. Atmospheric water vapor is mainly concen- with the radiosonde observation in Fig. 1.
trated below 8 km, and thus the large water vapor anomaly
also occurs below 8 km. It can be seen from Fig. 1 that the ob- 3.2 Relation between CWV anomaly and ONI
served water vapor anomaly is remarkably negative over the
five stations in the super El Niño winter of 2015–2016. The We choose the reanalysis CWV anomalies at the five ra-
negative anomaly in the water vapor reaches a peak value of diosonde stations to discuss the relationship between the wa-
−2.06 g kg−1 around 3 km in January at Koror, −3.2 g kg−1 ter vapor anomaly and the ENSO. The monthly mean CWV
around 3 km in February at Yap, −2.39 g kg−1 around 2.5 km anomaly averaged at the five stations is derived from the ra-
in January at Guam, −2.29 g kg−1 around 3.5 km in February diosonde and reanalysis data from January 2005 to Decem-
at Truk, and −2.66 g kg−1 around 2.5 km in February at Pon- ber 2019. Considering that the ONI is a 3-month smoothed
ape. In the 2006/07, 2009/10, and 2018/19 El Niño winters, value, the monthly mean CWV anomaly is also smoothed
the observed water vapor also exhibits the negative anomalies in a 3-month moving window. Figure 3 depicts the ONI and
in the lower and middle troposphere. We derive the monthly monthly mean CWV anomalies from the radiosonde and re-
mean specific humidity anomaly from the reanalysis data at analysis data. The CWV anomalies show a similar tempo-
the radiosonde stations during the same period, which is also ral evolution between the observation and the reanalysis with
presented in Fig. 1. The ERA5 reanalysis shows a water va- a significant correlation coefficient R = 0.83, but a negative
por anomaly scenario similar to the radiosonde observation. correlation to the ONI with a delay of around several months.
The negative anomalies in the four El Niño winters are ob- The correlation coefficient between the CWV anomaly and
vious in the reanalysis data, especially the strong anomaly in the ONI is calculated to be −0.63 (−0.62) with a lag of 3
the 2015/16 event. Hence, the El Niño events can lead to the (2) months. One can note from Fig. 3 that when a strong La
obvious reduction of water vapor in the region. Niña occurs with ONI = −1.64 in November 2010, the water
With the help of the ERA5 reanalysis data, we investigate vapor anomaly reaches the positive maximum in February
the distribution of the abnormal water vapor during the four and March 2011 from the observation and reanalysis data,
El Niño events. Here, we introduce an important scalar of respectively. However, for the 2015/16 super El Niño event
column-integrated water vapor mass (CWV), also called pre- with the peak of ONI = 2.6 in December 2015, an extremely
cipitable water, which is expressed as (Viswanadham, 1981), negative anomaly appears in both the observation and reanal-
Z P0
ysis. The negative anomaly attained is as large as −5.39 and
1 −5.75 kg m−2 in February 2016 from the radiosonde and re-
Q= qdp, (4)
g Pz analysis data, respectively. Similarly, the 2009/10 event has
a large index of ONI = 1.6 in November 2009, which leads
where Q is the CWV in units of kg m−2 , g = 9.8 m s−2 is the to the strong CWV anomalies of −2.45 and −3.94 kg m−2
acceleration due to gravity, and the pressures p0 and pz de- in January 2010 from the radiosonde and reanalysis data, re-
note the bounds of integration. Considering that atmospheric spectively. Hence, the ENSO or SST anomaly plays an im-
water vapor is mainly distributed below 8 km in the tropics portant role in the water vapor variation in the tropical west-
due to the rapid decrease of water vapor with height (Mapes ern Pacific.
et al., 2017), we choose p0 = 1000 hPa on the ground and
pz = 300 hPa corresponding to a height of about 9 km. Ac-
cording to Eq. (4), we calculate the CWV between 30◦ S
and 30◦ N from January 2005 to December 2019 based on 4 Contribution from tropical circulations
the reanalysis data. Similarly, the monthly mean CWV and
its anomaly can be derived from the CWV series. Figure 2 4.1 Tropical atmospheric circulations
presents the mean CWV anomalies in the four El Niño win-
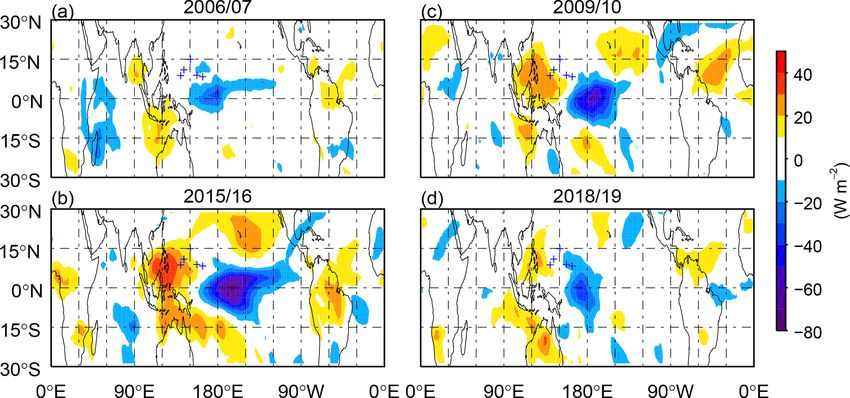
ters. In the 2006/07 and 2015/16 EP El Niño events, the pos- Besides the SST effect, evaporated sea water is carried to
itive CWV anomalies appear in the equatorial central and higher levels by the upward flow, and thus the water va-
eastern Pacific, while in 2009/10 and 2018/19 CP El Niño por variability in the troposphere is closely related to the at-
events, the positive anomalies concentrate in the central Pa- mospheric circulation. In the tropics, there are several well-
cific. This is consistent with previous studies (Kug et al., known circulations, i.e., the Hadley, Walker, and monsoon
2009; Takahashi et al., 2013; Xu et al., 2017). The nega- circulations, and each circulation has its own features and
tive anomalies occur in the tropical western Pacific and some driving force, although these circulations may also be highly
tropical latitudes off the Equator in both hemispheres. In the coupled with each other. In this way, we attempt to estimate
region of the five radiosonde stations, the CWV anomaly is the contributions of each tropical circulation to the observed
evidently negative and comparable between the 2009/10 and water vapor anomalies in the El Niño events. According to
2015/16 events, although the two events are classified into Helmholtz’s theorem, horizontal wind velocity can be de-
Atmos. Chem. Phys., 21, 13553–13569, 2021 https://doi.org/10.5194/acp-21-13553-2021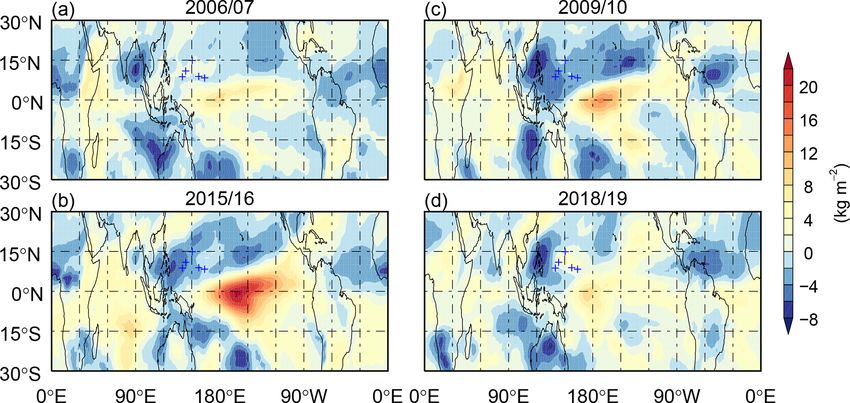
M. Du et al.: Water vapor anomaly over the tropical western Pacific in El Niño winters                                                  13557

Figure 1. Specific humidity anomaly between January 2005 and December 2019 derived from (left) radiosonde observations and (right)
ERA5 reanalysis data at (a, f) Koror, (b, g) Yap, (c, h) Guam, (d, i) Truk, and (e, j) Ponape.

Figure 2. CWV anomalies averaged over the (a) 2006/07, (b) 2015/16, (c) 2009/10, and (d) 2018/19 winters derived from ERA5 reanalysis
data. The blue pluses denote the five radiosonde stations. The four El Niño events are classified into (left) EP El Niño and (right) CP El Niño.

composed into rotational and divergent winds,                             differential heating and temperature contrast is essential to
                                                                          cause atmospheric convergence and divergence and vertical
V H = V 9 + V 8 = k × ∇9−∇8,                                     (5)      motion and then the formation of atmospheric circulation.
                                                                          The stream function involved in the rotation field has no con-
where 9 is the stream function; 8 is the velocity potential;              tribution to the atmospheric vertical motion, while the ve-
k is the unit vector in the vertical direction; and V H , V 9 ,           locity potential may be chosen as the indicator of the atmo-
and V 8 are the horizontal, rotational, and divergent wind ve-            spheric circulations since it is in connection with the atmo-
locities, respectively. Thermal driving force resulting from

https://doi.org/10.5194/acp-21-13553-2021                                                 Atmos. Chem. Phys., 21, 13553–13569, 2021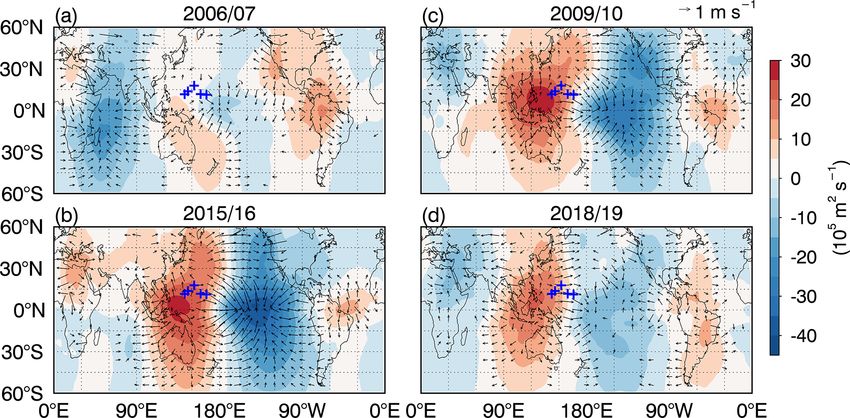
13558                              M. Du et al.: Water vapor anomaly over the tropical western Pacific in El Niño winters

Figure 3. Time series of (red) ONI index and monthly mean CWV
anomalies derived from (blue) radiosonde observation and (green)   Figure 4. Climatic means of velocity potential (shading) and diver-
reanalysis data at five radiosonde stations.                       gent wind fields (arrows) at 850 hPa in DJF derived from reanalysis
                                                                   data during 2005–2019. The red pluses denote the five radiosonde
                                                                   stations.
spheric convergence and divergence associated with the up-
ward and downward motions in the tropical region (Kana-
mitsu and Krishnamurti, 1978; Newell et al., 1996; Wang,           where x, y, and t are the longitude, latitude, and time, re-
2002). Because atmospheric water vapor comes mainly from           spectively. The square brackets and asterisk denote the zonal
the lower atmosphere through transport of ascending flow,          mean and the deviation from the zonal mean, respectively,
we selected the velocity potential at 850 hPa to represent the     and the overbar and prime denote the annual mean and the
characteristics of the tropical circulations in the lower tropo-   departure from the annual mean, respectively. The first term
sphere since the pressure level was extensively used to inves-     on the right of Eq. (7) is the zonal-mean component of the
tigate the lower atmospheric circulation (Wang, 2002; Weng         velocity potential field, defined as the Hadley circulation be-
et al., 2008; Zhao et al., 2010). The divergence and velocity      cause this circulation, driven by the large-scale meridional
potential fields are calculated by using the ECMWF reanal-         differential heating, may be treated as axisymmetric. The
ysis horizontal winds at 850 hPa according to the following        second and third terms on the right are the annual mean of
equation (Krishnamurti, 1971; Tanaka et al., 2004):                the deviation from the zonal mean and the deviation from the
                                                                   annual mean, respectively. The third term is regarded to be
D = ∇ · V H = −∇ 2 8,                                       (6)
                                                                   the monsoon circulation since the monsoon circulation has
where D is the divergence of horizontal wind. In Eq. (6), the      conspicuous seasonal variability as the sea–land heat con-
negative sign means that the divergent wind flows from the         trast changes. The second term is referred to as the Walker
large velocity potential to the small velocity potential.          circulation. The separation is not perfect for the Walker cir-
   Based on the different driving mechanisms and movement          culation without seasonal variation, as pointed out by Tanaka
features, Tanaka et al. (2004) decomposed the tropical cir-        et al. (2004). The Walker circulation is induced by the dif-
culation in the upper troposphere (200 hPa) into the Hadley,       ferent SST along the Equator. Considering that the El Niño
Walker, and monsoon circulations, which had the advantage          usually lasts for more than a year, with a maximum ONI in
of being able to quantitatively evaluate the intensity of the      winter, we chose the period of June to the next May to esti-
three tropical circulations by means of the separation of the      mate the Walker circulation and thus obtain the Walker circu-
velocity potential into three orthogonal spatial patterns. Sub-    lation anomaly during El Niño relative to its climatic average.
sequently, Takemoto and Tanaka (2007) used these circula-          In this way, the problem may not be very serious. The defini-
tion definitions to analyze the Hadley, Walker, and monsoon        tions and decomposition of the tropical circulations have ex-
circulations at 850 hPa in the lower troposphere and com-          tensively been used to study the influences of the SST warm-
pared the three circulation components with those in the up-       ing pattern on the interannual variation and long-term trend
per troposphere (200 hPa), which indicated that the velocity       of the Hadley, Walker, and monsoon circulations in associ-
potential intensities could be an index of each circulation in     ation with the hydrological cycle (Tanaka et al., 2005; Park
the lower troposphere without a notable influence from the         and Sohn, 2008; Li and Feng, 2013; Ma and Xie, 2013).
surface. Considering that atmospheric water vapor is mainly           We first calculate the divergence field of the horizontal
distributed below 8 km, directly relevant to the lower tropo-      wind at 850 hPa from 2005 to 2019 by using the reanaly-
spheric circulation, we follow the definitions and methodol-       sis horizontal wind data, and then the velocity potential is
ogy proposed by Tanaka et al. (2004) to obtain these tropical      deduced according to Eq. (6), which is equivalent to solving
circulations at the 850 hPa level for investigating their con-     the Poisson equation. Next, following Eq. (7), the velocity
tributions to the observed water vapor anomaly in the four         potential filed is decomposed into the Hadley, Walker, and
El Niño events. The velocity potential is divided as follows       monsoon circulation components. In this way, their monthly
(Tanaka et al., 2004):                                             climatic mean is derived from their time series. Figure 4
                                                                   presents the climatic means of the velocity potential and di-
8(x, y, t) = [8(t, y)] + 8∗ (x, y) + 8∗0 (x, y, t),         (7)    vergent wind fields in DJF. We choose the velocity poten-

Atmos. Chem. Phys., 21, 13553–13569, 2021                                           https://doi.org/10.5194/acp-21-13553-2021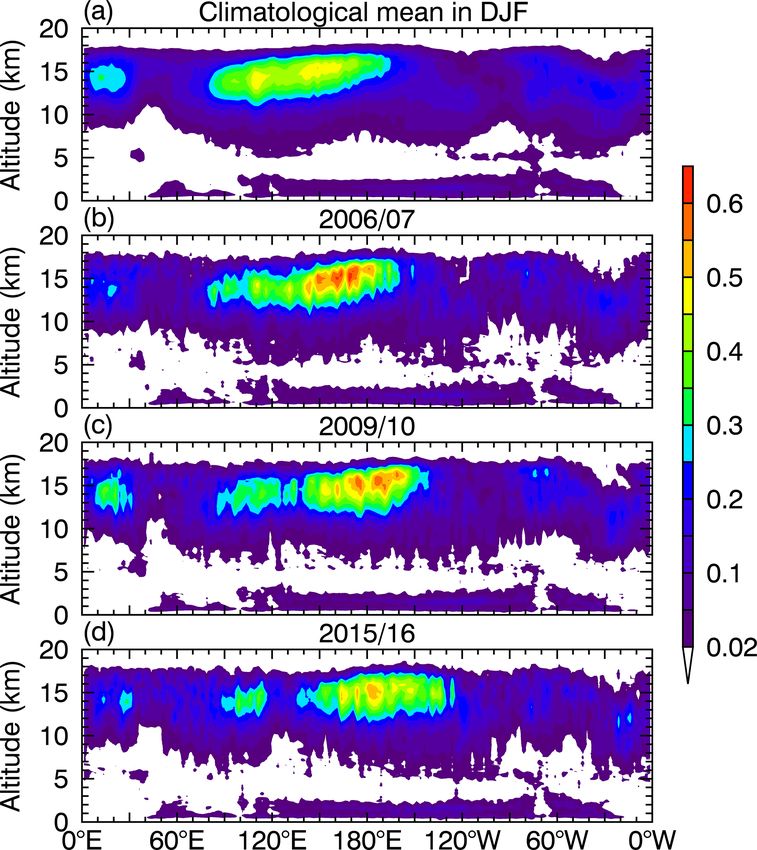
M. Du et al.: Water vapor anomaly over the tropical western Pacific in El Niño winters                                         13559

Figure 5. Anomalies of velocity potential (shading) and divergent wind (arrows) at 850 hPa in the winters of (a) 2006/07, (b) 2015/16,
(c) 2009/10, and (d) 2018/19. The blue pluses denote the five radiosonde stations.

tial as the proxy of the circulation intensity, and thus the         contrary, there is the negative index in the equatorial eastern
intensity of the tropical circulation in winter can clearly be       Pacific, which causes the descending flow to be suppressed.
seen from Fig. 4. The prominent negative peak of about               Correspondingly, the positive CWV anomaly over the equa-
−81 × 105 m2 s−1 in the velocity potential is situated in the        torial eastern Pacific can be seen from Fig. 2.
western Pacific warm pool, and thus there is the convergence            According to Eq. (7), we calculate the velocity potential
center of horizontal wind field, which induces the rising mo-        of the Hadley, Walker, and monsoon circulations and their
tion in the lower troposphere over the region, including the         anomaly indices at 850 hPa from the reanalysis data. Fig-
five radiosonde stations. Hence, the atmospheric water vapor         ure 6 presents the velocity potential and anomaly index of
is abundant in this region due to the transport by the strong        the Hadley circulation in the four El Niño winters. Now that
ascending flow. In contrast, the maximum velocity potential          the Hadley circulation is a tropical circulation driven by the
of 48 × 105 m2 s−1 appears in the northeastern Pacific Ocean         meridional differential heating in the global radiative pro-
and the southern part of the North American continent, mean-         cess (Oort and Yienger, 1996), this large-scale circulation
ing a downward motion associated with the divergence cen-            is very similar in different winters, with the circulation in-
ter in those regions, as well as less water vapor relative to the    dex increasing from the negative peak at about 12◦ S to pos-
western Pacific warm pool region.                                    itive peak at 23◦ N, and is little affected by El Niño, with
                                                                     the anomaly index being less than 2 × 10⁵ m2 s−1 or 2 units.
4.2   Atmospheric circulation anomalies                              Even so, the pattern of the Hadley circulation anomaly is dis-
                                                                     tinguished between the EP El Niño and CP El Niño. During
Next, we focus on the tropical circulation anomaly in the            the 2018/19 (2009/10) CP El Niño winters, the index of the
four El Niño events. Figure 5 illustrates the velocity potential     Hadley circulation anomaly is positive over the entire tropics
and divergent wind anomalies at 850 hPa in the four winters.         with the maximum of 1.74 (1.65) units at 3◦ N (2◦ N). How-
Here, we define the velocity potential value as the circulation      ever, in the 2006/07 and 2015/16 EP El Niño winters, the pos-
index with the units measured by 105 m2 s−1 , and the veloc-         itive index is located at about 5–30◦ N, and the negative index
ity potential anomaly is regarded accordingly as the index of        occurs over about 30◦ S–5◦ N. Feng and Li (2013) suggested
the circulation anomaly. As a consequence, the positive in-          that the different patterns of the Hadley circulation anoma-
dex of the circulation anomaly indicates the weakened con-           lies between the CP and EP El Niños are associated with the
vergence and rising motion or the strengthened divergence            contrasting underlying thermal structure changes because the
and sinking motion and vice versa for the negative index of          maximum of the zonal-mean SST anomalies is moved north-
the circulation anomaly. Hence, the positive and negative in-        ward to about 10◦ N in the CP event relative to the maximum
dices mean the decrease and increase of water vapor in the           around the Equator in the EP event. At the five radiosonde
troposphere due to the vertical transport change, respectively.      sites, the averaged anomaly index is 0.29, 1.56, 0.65, and
In Fig. 5, the positive index of the circulation anomaly oc-         1.37 units in the 2006/07, 2009/10, 2015/06, and 2018/19
curs in the western Pacific, especially in the 2009/10 and           winters, respectively, indicating that the Hadley circulation
2015/16 El Niño winters, and thus the ascending motion               is too stable to have a significant impact on the water vapor
is suppressed in that region, and the negative water vapor           variation.
anomalies are recorded in the radiosonde observation. On the

https://doi.org/10.5194/acp-21-13553-2021                                           Atmos. Chem. Phys., 21, 13553–13569, 2021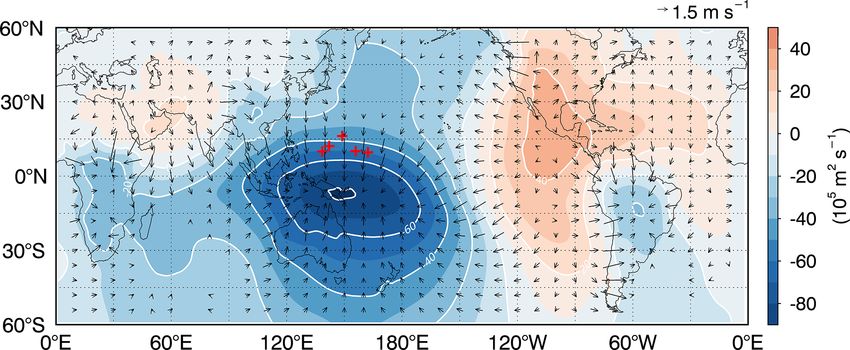
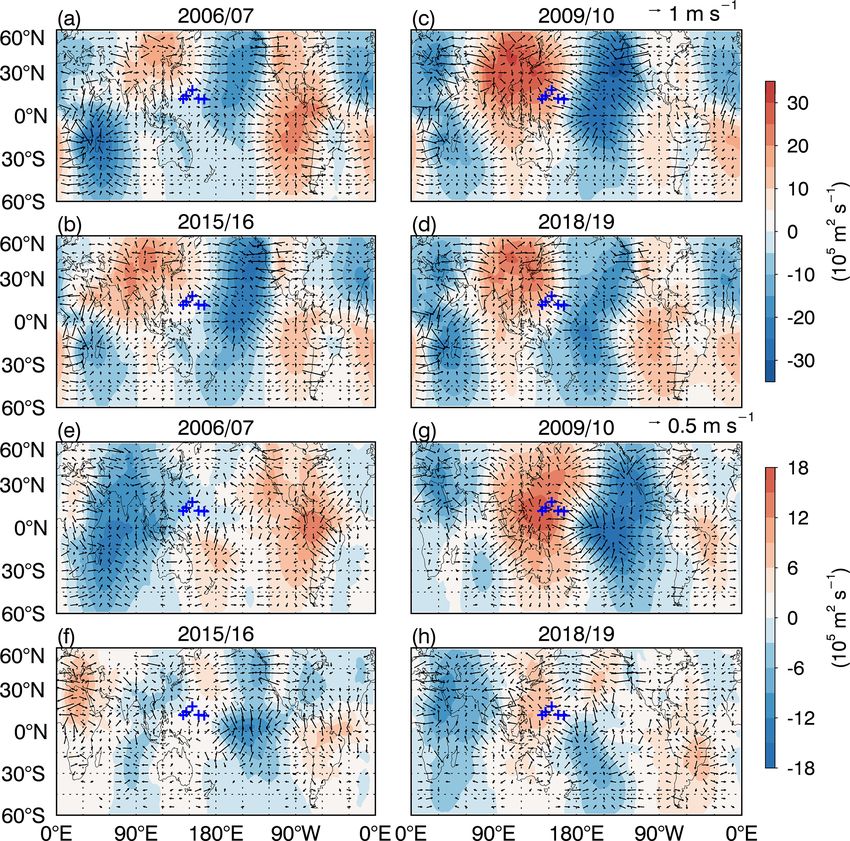
13560                                M. Du et al.: Water vapor anomaly over the tropical western Pacific in El Niño winters

Figure 6. Velocity potential (black) and anomaly index (orange) of the Hadley circulation at 850 hPa derived from reanalysis data in the (a)
2006/07, (b) 2015/16, (c) 2009/10, and (d) 2018/19 winters.

Figure 7. Velocity potential(shading) and divergent wind (arrows) of the Walker circulation and their anomalies at 850 hPa in the (a,
e) 2006/07, (b, f) 2015/16, (c, g) 2009/10, and (d, h) 2018/19 winters. Panels (a–d) show the velocity potential and divergent wind, and
panels (e–h) show their anomalies. The red and blue pluses denote the five radiosonde stations.

Atmos. Chem. Phys., 21, 13553–13569, 2021                                                 https://doi.org/10.5194/acp-21-13553-2021
M. Du et al.: Water vapor anomaly over the tropical western Pacific in El Niño winters                                               13561

Figure 8. Velocity potential (shading) and divergent (arrow) wind of monsoon circulation and their anomalies at 850 hPa in (a, e) 2006/07,
(b, f) 2015/16, (c, g) 2009/10 and (d, h) 2018/19 winters. Panels (a–d) denote the velocity potential and divergent wind, and (e)–(h) denote
their anomalies. The blue plus denotes the five radiosonde stations.

   Figure 7 depicts the velocity potential and anomaly index
of the Walker circulation at 850 hPa in the El Niño winters.
Relative to the Hadley circulation, the Walker circulation is
the local circulation formed over the tropical Pacific with
intense ascending flow in the western Pacific and descend-
ing flow in the eastern Pacific, and thus the circulation has a
high variability associated with the SST anomaly caused by
ocean current. As the Walker circulation is directly related
to ENSO, the scenarios of the Walker circulation anoma-
lies are roughly consistent with each other among the four              Figure 9. (a) Indices of Hadley (red), Walker (yellow), mon-
El Niño events. In general, the positive and negative indices           soon (blue), and total (orange) circulation anomalies and (b) CWV
of the Walker circulation anomaly are located in the western            anomalies derived from radiosonde (azure) and reanalysis (green)
and eastern Pacific, opposite to the circulation index, respec-         data at five radiosonde stations in four El Niño winters.
tively, which illustrates that the Walker circulation anomaly
in El Niño suppresses the strong rising in the western Pacific
and sinking in the eastern Pacific. Nevertheless, the strength          a key role in the CWV anomaly during the 2015/16 super El
of the circulation anomaly is the significant difference among          Niño event.
the four events. In the 2015/16 winter, the Walker circulation             The velocity potential and anomaly index of the mon-
anomaly, with peak indices as large as 26.8 and −27.7 units             soon circulation in the four El Niño winters are plotted in
in the equatorial Pacific, is much stronger than in the other           Fig. 8. The monsoon circulation in the lower atmosphere
three winters. Hence, the Walker circulation variation plays            blows from the land to the sea in winter, and thus it can be

https://doi.org/10.5194/acp-21-13553-2021                                               Atmos. Chem. Phys., 21, 13553–13569, 2021
13562                                 M. Du et al.: Water vapor anomaly over the tropical western Pacific in El Niño winters

Figure 10. Anomalies of (a, b) CWV and velocity potential and divergent wind at 850 hPa in the (c, d) total, (e, f) Walker, and (g, h) monsoon
circulations for composite EP and CP El Niños derived from reanalysis data. The left and right columns correspond to the composite EP and
CP El Niños, respectively. The shading and arrows in (c–h) denote the velocity potential and divergent wind anomalies, respectively. The red
and blue pluses denote the five radiosonde stations.

seen from Fig. 8 that the pattern of the monsoon circulation is          4.3    Contribution to water vapor anomaly
evidently different from that of the Walker circulation shown
in Fig. 7. The anomaly of the monsoon circulation is sensi-
                                                                         We estimate the contributions of the Hadley, Walker, and
tive to the type of El Niño, which is also distinguished from
                                                                         monsoon circulation anomalies to the water vapor anomaly
that of the Walker circulation. Early studies showed that the
                                                                         observed by the radiosonde in the four El Niño events by
CP and EP El Niños have different effects on Indian and east-
                                                                         means of comparing the indices of the circulation anoma-
ern Asian monsoon rainfall (Weng et al., 2008; Wang et al.,
                                                                         lies. Figure 9 illustrates the indices of the circulation anoma-
2013). The monsoon circulation anomaly at the radiosonde
                                                                         lies at 850 hPa and the CWV anomalies derived from the ra-
stations has an index around zero in the EP El Niño events,
                                                                         diosonde and reanalysis data, and these circulation anomaly
which is far weaker relative to the large positive index in the
                                                                         indices and CWV anomalies are the values averaged at the
CP El Niño events, similar to previous investigations (Fan
                                                                         five radiosonde sites in winter. It can be seen from Fig. 9 that
et al., 2017). In the 2009/10 El Niño event, the pronounced
                                                                         the CWV anomalies in the reanalysis and radiosonde data
anomaly with a peak index of 17.8 units takes place in the
                                                                         qualitatively increase with the increasing index of the total
western Pacific, which implies that the monsoon circulation
                                                                         circulation anomaly. As discussed above, the contribution of
anomaly has an important influence on the negative water va-
                                                                         the Hadley circulation anomaly is very small with a maxi-
por anomaly in the radiosonde observation.
                                                                         mum of only 1.56 units in the 2009/10 event. The anomaly
                                                                         of the Walker circulation makes a considerable contribution
                                                                         in each case, especially for the EP El Niño events, and it is
                                                                         the strongest in the three tropical circulation anomalies. The
                                                                         index of the Walker circulation anomaly counts for 92.3 %

Atmos. Chem. Phys., 21, 13553–13569, 2021                                                  https://doi.org/10.5194/acp-21-13553-2021
M. Du et al.: Water vapor anomaly over the tropical western Pacific in El Niño winters 13563
In order to obtain the general features of water vapor and
circulation anomalies in the EP and CP El Niño events, we
extend the reanalysis data back to 1979 to examine two types
of composite El Niño events. There are six EP El Niño
events in the winters of 1982/83, 1986/87, 1991/92, 1997/98,
2006/07, and 2015/16 and five CP El Niño events in the
1994/95, 2002/03, 2004/05, 2009/10, and 2018/19 winters
for the 41 years from 1979 to 2019, which are averaged as
the composite EP and CP El Niños, respectively. We calcu-
late the CWV anomalies in the two composite events based
the climatic mean CWV in 41 winters, and the correspond-
ing velocity potential and divergent wind anomalies of the
Walker, monsoon, and total circulations from the reanalysis
horizontal wind at 850 hPa, which are shown in Fig. 10. The
Hadley circulation anomaly (not presented) is very small,
and its patterns in the composite EP and CP El Niños are
also analogous to those in the EP and CP events shown in
Fig. 6, respectively. On the whole, Fig. 10 illustrates that the
total circulation anomaly is stronger in EP event than in CP
event and that the CWV anomaly is larger in EP event rel-
ative to that in CP event. The Walker circulation plays an
important role in the total circulation anomaly, especially in
Figure 11. Distribution of cloud occurrence between 0◦ N and EP El Niño. Despite significant variability from one event
15◦ N in (a) all winters and the (b) 2006/07, (c) 2009/10, and to another, the monsoon circulation anomaly not only has a
(d) 2015/16 winters derived from CALIPSO from June 2006 to De- larger proportion of the total anomaly but also has a slightly
cember 2016. higher intensity in CP El Niño than in EP El Niño. At the
five radiosonde stations, the composite events indicate that
the CWV anomaly is about −4.36 and −1.74 kg m−2 in the
of the total anomaly index (23.89 units) in the 2015/16 El EP and CP El Niños, respectively. The index of the Walker
Niño winter and even exceeds the total index in the 2006/07 circulation anomaly accounts for about 75.8 % (47.8 %) of
event owing to the negative anomaly of the monsoon circula- the total anomaly index in EP (CP) El Niño, while for the
tion. The anomaly of the monsoon circulation shows an ev- monsoon circulation, the anomaly index of 6.16 (4.66) units
ident change from one event to another because it is sensi- contributes to 49.6 % (18.4 %) of the total anomaly index in
tive to the local heat contrast and the El Niño shift. In the CP (EP) El Niño. Therefore, the relative importance of the
western Pacific, the CP El Niño can lead to the obvious pos- Hadley, Walker, and monsoon circulation anomalies in the
itive anomaly of the monsoon circulation. The index of the composite El Niños is roughly in accordance with that in the
monsoon circulation anomaly is about 69.7 % (44.7 %) of the case study above. In addition, at the radiosonde sites, the CP
total anomaly index in the 2009/10 (2018/19) CP El Niño El Niño can generally cause an intense monsoon circulation
winter. Consequently, for the two intense El Niño events, the anomaly, which is comparable to and even larger than the
water vapor anomaly is caused mainly by the Walker circu- Walker circulation anomaly; thus, the CP El Niño in the win-
lation anomaly in the 2015/16 EP event but by the monsoon ter of 2009/10 may induce a quite strong monsoon circulation
circulation anomaly in the 2009/10 CP event. The Walker anomaly now that the 2009/10 event is the strongest CP El
and monsoon circulation anomalies nearly equally (and op- Niño from the 1980s onwards, as observed by satellite (Lee
positely) contribute to the CWV anomaly in the 2018/19 and McPhaden, 2010).
(2006/07) event. Therefore, outside of the Hadley circula-
tion anomaly, the Walker and monsoon circulation anoma-
lies may have the largest differences in their contributions 5 Changes in cloud and OLR
to water vapor variation in different El Niño events. In ad-
dition, in the 2015/16 and 2018/19 winters, the reanalysis Using the cloud occurrence from the CALIPSO from
CWV anomalies of −4.34 and −1.30 kg m−2 are roughly June 2006 to December 2016, we calculate tropical cloud
consistent with −4.46 and −1.54 kg m−2 in the radiosonde fraction between 0 and 15◦ N in the 2006/07, 2009/10, and
observation, respectively. However, in the first two events, 2015/16 winters and its climatic mean in winter, which is
there is a distinct difference in the CWV anomaly between shown in Fig. 11. We also compute the OLR anomalies
the reanalysis and radiosonde data, and we will discuss the over 30◦ S–30◦ N in the four El Niño winters based on the
discrepancy in detail below. monthly OLR data between 2005 and 2019. Figure 12 shows
https://doi.org/10.5194/acp-21-13553-2021 Atmos. Chem. Phys., 21, 13553–13569, 202113564 M. Du et al.: Water vapor anomaly over the tropical western Pacific in El Niño winters
Figure 12. OLR anomalies averaged over the (a) 2006/07, (b) 2015/16, (c) 2009/10, and (d) 2018/19 winters. The blue pluses denote the
five radiosonde stations.
the OLR anomalies in the four El Niño events. In the western ground errors of relative humidity and vertical level (Dee
Pacific, the strong rising flow carries abundant water vapor et al., 2011). For the ERA5 humidity analysis, measure-
to high level due to the convergence of horizontal wind field ments from radiosondes, surface synoptic observations, air-
in winter, as shown in Fig. 4, and then the water vapor con- craft, and satellite observations are assimilated (Andersson et
denses to form clouds as it cools, and thus there are clouds al., 2007). To date, the reliability and accuracy of ERA5 wa-
over the tropical western Pacific. In the El Niño events, the ter vapor products have been extensively estimated. Overall,
cloud amount decreases from about 80 to 160◦ E but tends ERA5-retrieved precipitable water vapor (PWV) performs
to increase between about 160◦ E to 120◦ W because of the well over the Indian Ocean (Lees et al., 2020), central Asia
tropical circulation changes. Owing to the reflection effect of (Jiang et al., 2019), the Antarctic (Ye et al., 2007), the East
cloud on OLR, the OLR change is opposite to the variation African tropical region (Ssenyunzi et al., 2020), and Varanasi
of cloud amount. In the 2009/10 and 2015/16 strong El Niño (Kumar et al., 2021), which can be seen via comparisons with
winters, the OLR is obviously enhanced in the tropical north- ground-based observations, satellite retrievals, and other re-
west Pacific and significantly reduced in the equatorial cen- analysis datasets. Nevertheless, some discrepancies can be
tral eastern Pacific as the cloud occurrence changes. Hence, noticed over small tropical islands characterized by steep
the cloud and OLR have a clear response to the water vapor orography (Lees et al., 2020), and it is reported that although
anomaly in the El Niño events. PWV from the ERA5 reanalysis is in good agreement with
As described above, the reanalysis CWV anomalies at the the retrievals from the Global Navigation Satellite System
radiosonde stations in the 2009/10 winter have almost the over 268 stations, there is a bias of 4 mm PWV in the south-
same intensity as that in the 2015/16 winter, but the ra- west of South America and western China due to the terrain
diosonde observation indicates that the water vapor reduction limitations and fewer observations (Wang et al., 2020).
is evidently lower in the 2009/10 winter than in the 2015/16 Since the CWV anomalies look more or less different be-
winter. As shown in Figs. 11 and 12, the satellite observation tween the radiosonde and reanalysis data, we compare the
shows that there is less cloud occurrence and more OLR at CWV in the ERA5 reanalysis with that in the radiosonde and
the radiosonde stations in the 2015/16 winter compared with satellite observations at the five stations and attempt to ex-
in the 2009/10 winter. Therefore, this supports the radiosonde plain the different CWV anomalies between the reanalysis
observation that the water vapor over the radiosonde stations data and radiosonde observations in the 2006/07 and 2009/10
in the 2009/10 winter may be moister than in the reanalysis. events. By using the reanalysis data and measurements of ra-
diosondes and AIRS on the Aqua satellite for the 15-year
period from 2005 to 2019, we calculate the monthly mean
6 Discussion CWV at the five radiosonde sites, and Fig. 13 depicts the
monthly mean CWV in winter as scatterplots of the reanal-
In the ERA5 reanalysis data, water vapor is calculated by a ysis vs. radiosonde data and the reanalysis vs. AIRS data.
humidity analysis scheme introduced by Hólm (2003), which Following this, the climatic mean difference is derived from
involves nonlinear transformation of the humidity control these monthly mean CWV series in 2005–2019, which is also
variable to render the humidity background errors nearly presented in Fig. 13. At the five stations, the monthly mean
Gaussian. The transformation normalizes relative humidity CWV in winter is distributed between 30 and 60 kg m−2 in
increments by a factor that varies as a function of back- all three datasets, and the CWV is obviously shifted to the
Atmos. Chem. Phys., 21, 13553–13569, 2021 https://doi.org/10.5194/acp-21-13553-2021M. Du et al.: Water vapor anomaly over the tropical western Pacific in El Niño winters 13565
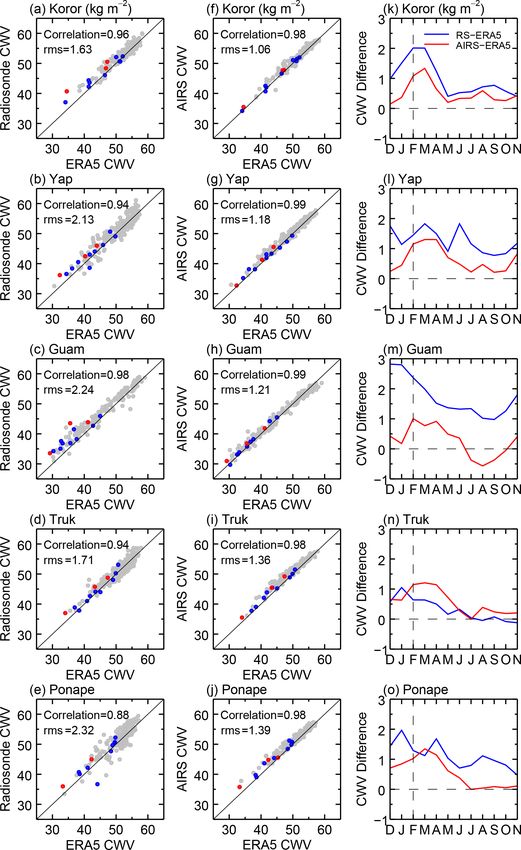
vations is generally smaller than 5 %. These comparisons and
analyses confirm a fine confidence level of the ERA5 reanal-
ysis and observational datasets. Nevertheless, there are still
very small discrepancies among these data, and the discrep-
ancy is relatively large between the radiosonde and reanalysis
data compared to between the satellite and reanalysis data,
which may be attributed to the different sampling times be-
tween the radiosonde and AIRS. It can be noted from Fig. 13
that the red dots representing the reanalysis vs. radiosonde
data in the 2009/10 winter show a relatively large scatter
around the symmetric axis, indicating a relatively large dis-
crepancy in the CWV anomalies between the reanalysis data
and radiosonde observation in this event, as in previous re-
ports of some discrepancies over small tropical islands or
in the regions with fewer observations (Lees et al., 2020;
Wang et al., 2020). In comparison to the reanalysis data, the
CWV derived from AIRS also shows the largest difference of
1.31 kg m−2 in the 2009/10 event, while the differences are
less than 1 kg m−2 in the other three events.
Based on specific humidity in the reanalysis and ra-
diosonde data, the CWV is calculated to be 44.87 (44.10),
43.06 (40.23), 41.16 (39.83), and 44.07 (42.87) kg m−2 in
the radiosonde (reanalysis) data in the 2006/07, 2009/10,
2015/16, and 2018/19 events, respectively. In fact, the rel-
ative difference in the CWV between the radiosonde and re-
analysis data is very small, with only 1.7 % in the 2006/07
winter and 6.6 % in the 2009/10 winter. The CWV average
in winter is 45.61 (44.17) kg m−2 in the radiosonde (reanal-
ysis) data from 2005 to 2019, and thus the CWV anomaly in
the radiosonde (reanalysis) data is −0.74 (−0.07) kg m−2 in
the 2006/07 event and −2.55 (−3.94) kg m−2 in the 2009/10
event. This means that the discrepancy in the CWV anomaly
looks quite large in Fig. 9, especially in the 2006/07 event,
but the differences in both the CWV and CWV anomaly val-
Figure 13. Scatterplots of monthly mean CWV in winter derived ues are small between the radiosonde and reanalysis. Even
from (a–e) radiosonde and (f–j) AIRS observations against corre- so, the relatively large discrepancy between the reanaly-
sponding CWV from ERA5 reanalysis and (k–o) climatic mean sis data and the radiosonde and AIRS observations in the
CWV difference (blue lines) between radiosonde and ERA5 reanal-
2009/10 event, as shown in Figs. 1 and 13, and the cloud
ysis data and (red lines) between AIRS and ERA5 reanalysis data
and OLR measurements in Figs. 11 and 12 seem to suggest
at five stations during 2005–2019. In (a–j), the red, blue, and gray
dots denote the CWV values in the 2009/10 winter; the 2006/2007, that the reanalysis data underestimates the tropospheric water
2015/2016, and 2018/2019 winters; and the other winters, respec- vapor over the radiosonde stations in the 2009/10 winter.
tively.
7 Summary
low values in the El Niño winter, indicating the negative In this paper, we report the significantly negative water vapor
anomaly in the El Niño event. The correlation of the mean anomaly in the troposphere during four El Niño winters at
CWV series between the reanalysis and observations is quite five radiosonde stations in the tropical western Pacific based
high with the minimum coefficient of 0.88, and the root mean on radiosonde and reanalysis data for 15 years from 2005
square (rms) of the mean CWV differences between the re- to 2019 and study the relationship between the water vapor
analysis and observations is less than 2.32 kg m−2 . Mean- anomaly and the El Niño index and the contribution of the
while, the difference in the climatic mean CWV is mainly different tropical circulation anomalies to the observed water
concentrated in the range of 0–2 kg m−2 , except for several vapor anomaly in the El Niño events.
months at the Guam station, and thus the relative difference The radiosonde observation shows that the negative wa-
in the monthly mean CWV between the reanalysis and obser- ter vapor anomaly arises in the El Niño winters, specifically
https://doi.org/10.5194/acp-21-13553-2021 Atmos. Chem. Phys., 21, 13553–13569, 202113566 M. Du et al.: Water vapor anomaly over the tropical western Pacific in El Niño winters
showing an extremely negative anomaly in the 2015/16 super Data availability. The radiosonde observations are provided by
El Niño event. The prominent specific humidity anomaly is NOAA at the following website: https://www.ncei.noaa.gov/
concentrated below 8 km in the troposphere with the peak at pub/data/igra/derived/ (NOAA, 2004). The ERA5 reanalysis
the height of about 2.5–3.5 km. The local CWV anomaly has data are from the ECMWF: https://cds.climate.copernicus.eu/
a large negative correlation coefficient of −0.63 with the ONI cdsapp#!/dataset/reanalysis-era5-pressure-levels-monthly-means?
tab=form (Hersbach et al., 2019). The Niño3.4 in-
in the Niño3.4 region but has a lag of about 2–3 months. The
dex is from NOAA: https://catalog.data.gov/dataset/
reanalysis data reveal that the negative water vapor anomaly climate-prediction-center-cpcoceanic-nino-index (NOAA,
occurs widely in the tropical northwestern Pacific, while the 2021). The OLR data are from NOAA: https://downloads.
positive anomaly correspondingly takes place in the equato- psl.noaa.gov/Datasets/interp_OLR/ (NOAA, 2003). The cloud
rial central eastern Pacific. The 2015/16 El Niño event (with occurrence monthly data are from NASA: https://search.
ONI = 2.6) is the strongest during the 15 years, leading to the earthdata.nasa.gov/search/granules?p=C1575511329-LARC_
extreme anomaly in the water vapor over the tropical Pacific. ASDC&pg[0][v]=f&tl=1630929576.307!3!! (NASA, 2018).
The atmospheric water vapor from tropical sea water evap- The AIRS water vapor data are available from NASA:
oration is affected not only by the SST but also by the verti- https://doi.org/10.5067/Aqua/AIRS/DATA321 (AIRS Science
cal motion of the atmosphere, which can transport the wa- Team and Teixeira, 2013).
ter vapor from near the sea surface up to high levels. By
using the definitions and method introduced by Tanaka et
al. (2004), we decompose the tropical circulation into the Author contributions. KH and MD proposed the scientific ideas.
MD and KH completed the analysis and the manuscript. SZ, CH,
Hadley, Walker, and monsoon circulations to estimate their
YG, and FY discussed the results in the manuscript.
contributions to the observed water vapor anomaly in the four
El Niño events. In general, the tropical circulation anomaly
in the El Niño winter is characterized by divergence (con-
Competing interests. The contact author has declared that neither
vergence) at 850 hPa in the tropical western (eastern) Pacific, they nor their co-authors have any competing interests.
and thus the CWV decreases over the tropical western Pa-
cific as the ascending flow is suppressed. As the large-scale
meridional circulation is driven by the differential heating, Disclaimer. Publisher’s note: Copernicus Publications remains
the variation of the Hadley circulation is pretty small with neutral with regard to jurisdictional claims in published maps and
an anomaly index of less than 2 units. At the radiosonde sta- institutional affiliations.
tions, the anomaly of the Walker circulation makes a con-
siderable contribution to the total anomaly in all the El Niño
winters, especially in the 2006/07 and 2015/16 EP El Niño Acknowledgements. This work was supported by the National
events. The monsoon circulation exhibits an obvious vari- Natural Science Foundation of China (grant nos. 41974176 and
ability from one event to another, and its anomaly is large in 41674151).
the 2009/10 and 2018/19 CP El Niño winters and small in the
2006/07 and 2015/16 EP El Niño winters. Therefore, the ob-
served water vapor anomaly is caused mainly by the Walker Financial support. This research has been supported by the Na-
circulation anomaly in the 2015/16 super EP event but by tional Natural Science Foundation of China (grant nos. 41974176
and 41674151).
the monsoon circulation anomaly in the 2009/10 strong CP
event. Based on the reanalysis data back to 1979, we examine
the general features of water vapor and circulation anomalies
Review statement. This paper was edited by Bryan N. Duncan and
in the two types of composite El Niño events. The roles of the reviewed by two anonymous referees.
Hadley, Walker, and monsoon circulations in the composite
EP and CP El Niños are consistent with those in the EP and
CP case events.
Because of the reduction in the upward transport of water References
vapor over the tropical western Pacific in the El Niño events,
the satellite observations show that, relative to the climatic AIRS Science Team and Teixeira, J.: AIRS/Aqua L3 Monthly
means, the cloud decreases and that the OLR is accordingly Standard Physical Retrieval (AIRS-only) , Goddard Earth Sci-
ences Data and Information Services Center (GES DISC) [data
strengthened, particularly during the strong El Niño winters
set], available at: https://doi.org/10.5067/Aqua/AIRS/DATA321,
of 2009/10 and 2015/16. In addition, a detailed comparison
2013.
of water vapor in the reanalysis, radiosonde, and satellite data Andersson, E., Hólm, E., Bauer, P., Beljaars, A., Kelly, G. A.,
shows a high confidence level of these datasets; nevertheless, McNally, A. P., Simmons, A. J., Thépaut, J. N., and Tomp-
the reanalysis seems to slightly underestimate the water va- kins, A. M.: Analysis and forecast impact of the main humid-
por over the five radiosonde stations in the 2009/10 winter. ity observing systems, Q. J. Roy. Meteor. Soc., 133, 1473–1485,
https://doi.org/10.1002/qj.112, 2007.
Atmos. Chem. Phys., 21, 13553–13569, 2021 https://doi.org/10.5194/acp-21-13553-2021You can also read