Weekly update for coronavirus figures in the county

 
CONTINUE READING
Weekly update for coronavirus figures in the county
Weekly update for coronavirus
      figures in the county
                     Wednesday 9 September 2020

   How is coronavirus affecting people in Lancashire?
This is a weekly bulletin produced by the Lancashire Resilience Forum with the
 latest figures on the number of coronavirus-related cases and deaths in the
              county, as well as figures at a unitary and district level.
     It also shows how Lancashire compares to other areas of the country.
Weekly update for coronavirus figures in the county
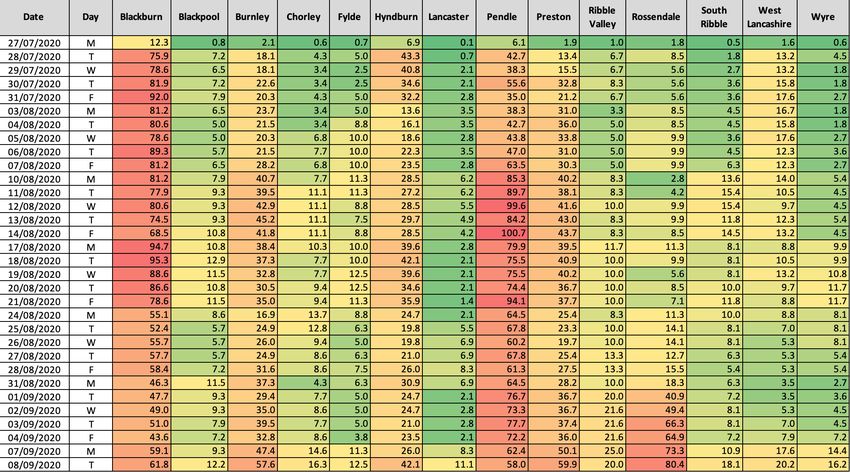
Confirmed cases from positive
‘pillar 1 and 2’ tests up to
                                                                                                                           936
7 September 2020
                                                                                  684
LANCASHIRE                                                                                       LANCASTER
                                                                                                                                          244

11,705                                                                    1,537
                                                                                                                  RIBBLE
                                                                                                                                                 964
NORTH WEST                                             1,127                                   WYRE               VALLEY

56,269
                                                                                                                                 PENDLE

                                                                                  BLACKPOOL      PRESTON
                                                                         501
                                                                                       FYLDE                              BURNLEY
                                                                                                                    HYNDBURN
                                                                                                                                                 682
                                                                                                SOUTH
ENGLAND                                                                                         RIBBLE
                                                                                                                BLACKBURN
                                                                                                                WITH

302,175
                                                                                                                        ROSSENDALE
                                                                                                                DARWEN
                                                                                                                                                528
                                                                            827                       CHORLEY

                                                                                        WEST
                                                                                        LANCASHIRE
These figures are from tests carried out in Public Health England labs and                                                                395
in the NHS (Pillar 1) and from other testing routes, such as mobile labs                                          593      1,936
(Pillar 2). 24 June and 1 July bulletins included positive cases from pillar 1                           751
only, hence the counts are lower than they are this week. It is important to
note that the cases haven’t suddenly increased and this week’s cases are
based on both pillars.
Weekly update for coronavirus figures in the county
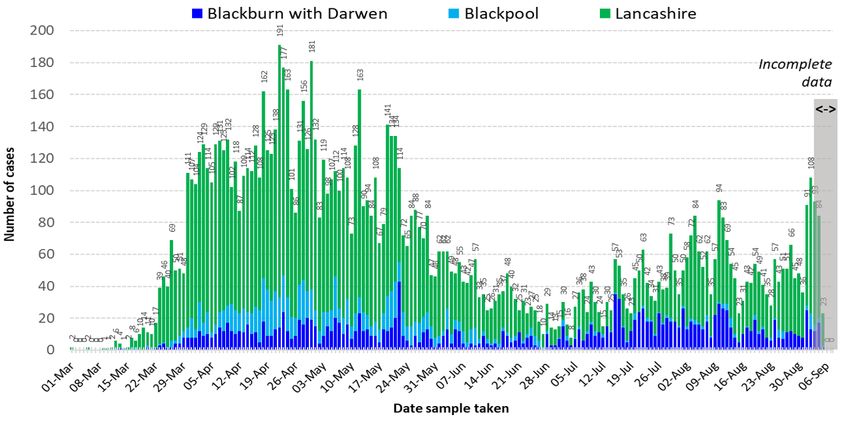
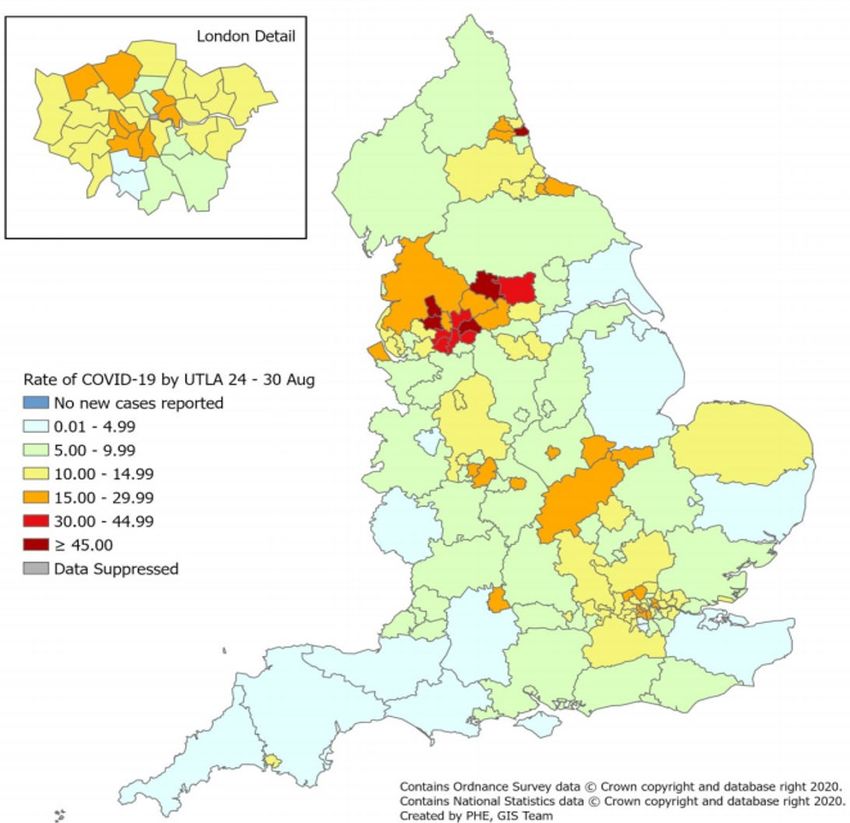
Weekly rate of Covid-19
cases per 100,000 population
tested under pillar 1 and
pillar 2 (Week 35 - data
between 24 August and
30 August 2020).                                                           Blackpool
                                                                                       Lancashire

                                                                           Blackburn
                                                                         with Darwen

For rate of cases detected via Pillar 1 & 2 testing:
Blackpool is in the second lowest category
Lancashire is in the third lowest category
Blckburn with Darwen is in the highest category

Pillar 1 = swab testing in PHE labs & NHS hospitals for those with a
medical need and key workers & their families
Pillar 2 = testing by commercial partners - swab testing for the wider
population from out in the community
Weekly update for coronavirus figures in the county
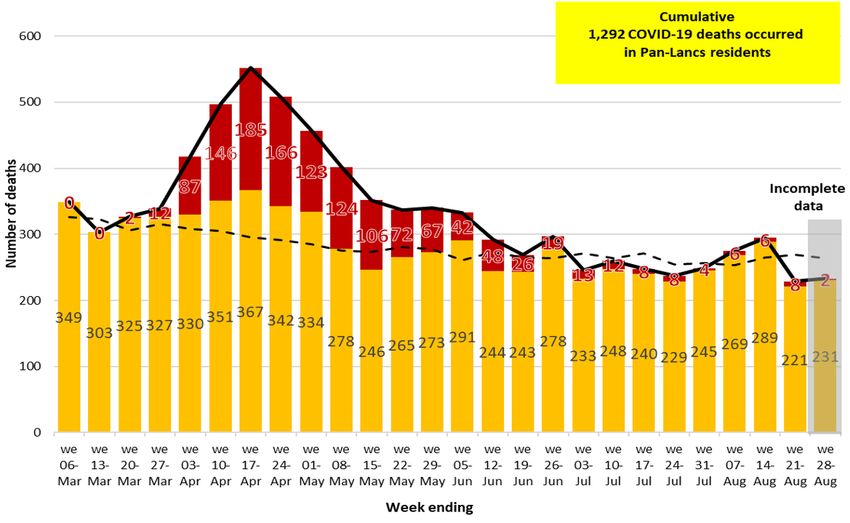
Cumulative lab-confirmed cases up to 7 September,
                                            rate per 100,000

Source: https://coronavirus.data.gov.uk   Cases are from both pillar 1 and 2
Weekly update for coronavirus figures in the county
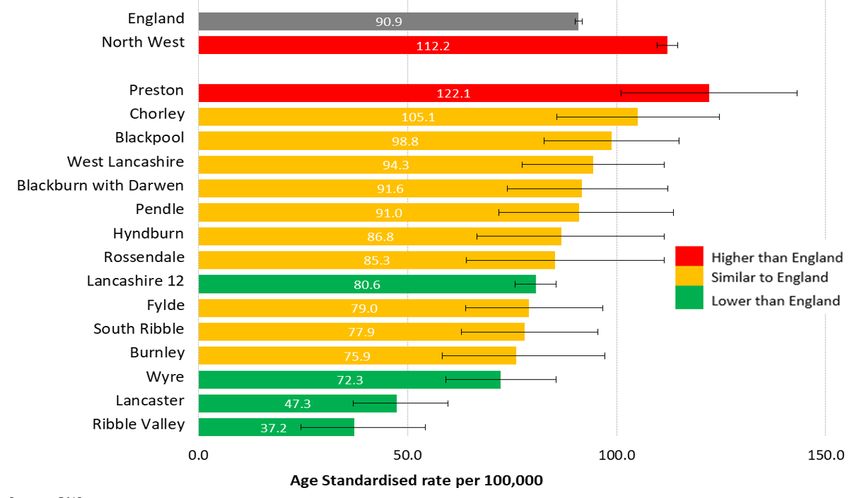
Daily pillar 1 and pillar 2 lab-confirmed cases to 7 September

Positive tests are counted according to the date the sample was taken. However, most
swabs taken in recent days will not yet have produced a result, so it is important not to
jump to the conclusion that the epidemic is tailing off quicker than it really is. The PHE
website cautions that only data from five days or more ago can be considered complete.       Figures relating to confirmed cases by Upper Tier Local Authority
The greyed-out columns in figure above are liable to be added to as more results come in.           can be downloaded from: https://coronavirus.data.gov.uk
Testing and incidence reporting period 29/08/20 – 04/09/20

Due to the reporting delays the most recent 4 days are excluded
from the calculations of rates and moving averages                Source: PHE laboratory confirmed COVID-19-line list
Covid-19 cases (number of people with a lab-confirmed positive test
result) by Middle Super Output Area (MSOA).
MSOAs with 3 and above COVID-19 cases, in the 7 days ending 03 September

                                                                           MSOAs are small areas
                                                                           with around 7,200
                                                                           average population and
                                                                           are used to facilitate the
                                                                           reporting of small area
                                                                           statistics.

                                                                           Source:
                                                                           https://coronavirus.data.
                                                                           gov.uk/cases
New cases per 100,000 population (7 day average)
as published every day by Public Health England

                                                   Public Health England
Count of deaths identified
as Covid-19 on death
                                                                                         71
certificates and occurred
up to 28 August but were                        120
registered up to 5 September                                   LANCASTER
                                                                                                             27

                                          135                                   RIBBLE
                                                                                                                           79
                                    147                      WYRE               VALLEY

                                                                                                PENDLE
LANCASHIRE                                      BLACKPOOL      PRESTON

                                          96
                                                     FYLDE                              BURNLEY
                                                                                                                           65
       50                 296                                 SOUTH
                                                                                  HYNDBURN
                                                                              BLACKBURN
      at home          in a care home
                                                              RIBBLE          WITH
                                                                                      ROSSENDALE

     916
                                                                              DARWEN
                                                                                                                       64
     in hospital
                         29
                         in a hospice
                                          119                       CHORLEY

                                                      WEST

         Other     1                                  LANCASHIRE
                                                                                                               54
                                                                                93         105
                                                                       117
 TOTAL 1,292
                                                                                         Source: Office for National Statistics (ONS)
Weekly deaths occurring up to 28 August,
compared with the five-year weekly average

 Non-Covid-19         Covid-19
 Total deaths         Weekly average (2014 - 2018)
                                                     Source: Office for National Statistics (ONS)
Covid-19 mortality rate, all persons
1 March to 31 July 2020, rate per 100,000

                                            Source: Office for National Statistics (ONS)
Help share our messages!
      Each week we produce a statistical bulletin to show how
               coronavirus is affecting Lancashire.

Access our range of resources to share on social media to encourage
     Lancashire people to play their part to combat coronavirus.

         Find out more about the LancsTogether campaign
                 and what you can do to take part.

We are all working together in Lancashire to combat coronavirus.
You can also read