White Paper - tt performance suite ttps Analytics Dashboard
←
→
Page content transcription
If your browser does not render page correctly, please read the page content below
White Paper

     tt performance suite
  ttps Analytics Dashboard
ttps Analytics Dashboard
The most important instrument for your workplace learning initiatives.
Statistical evaluations and goal-oriented reports perform the task of dissecting the daily flood of
numbers and data in order to highlight precisely the information that is required for corporate
management. The analysis of meaningfully processed data facilitates quick and precise decision-
making with the goal of introducing immediate improvements and enabling the measurement of
success.
This particularly applies to workplace learning and the setting up of Performance Support measures
within companies. The analysis of end users' usage behavior via the various distribution channels is
vital to the goal-oriented optimization of learning and Performance Support initiatives. Not only
that, but it can also act as the basis for examining the ROI of past and future investments in the
field of corporate knowledge transfer.
The ttps Analytics Dashboard – which has been an optional component of tt performance suite
since the launch of Version 2018 – is the ultimate comprehensive solution for the tracking and visu-
alization of usage data. The meaningful, visual processing of usage data, which are generated via
the proven web-tracking interface of ttps, lies at the heart of the ttps Analytics Dashboard. These
raw data are anonymously collected and saved during every user interaction within the Web Pub-
lisher portal and QuickAccess.
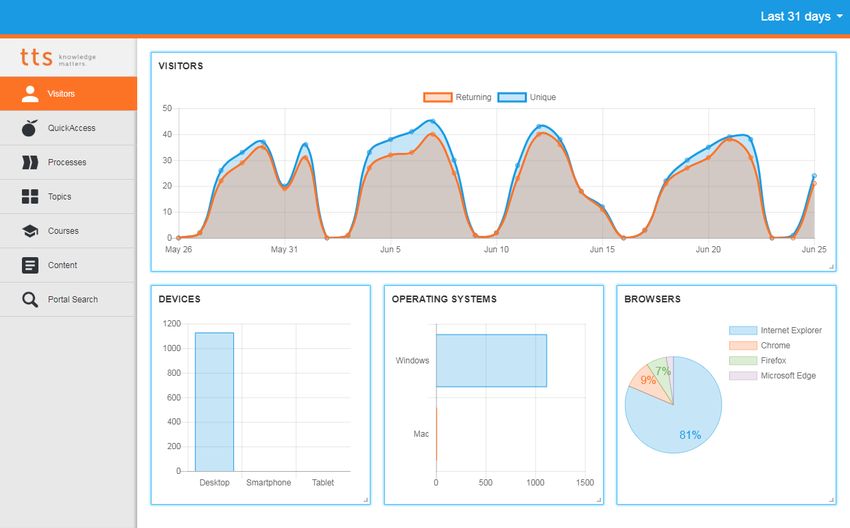
Illustration 1: The ttps Analytics Dashboard
Whitepaper ttps Analytics Dashboard Page 2 of 5This intuitive Dashboard allows you to monitor the usage behavior of your users, enabling the
recognition of trends and patterns, and the identification of appropriate reactions. Now's the time
to become agile and quick to act, and lay the foundation for the needs-based control of Perfor-
mance Support activities within your company.
The ttps Analytics Dashboard includes:
Comprehensive evaluations
These allow you to identify general correlations and optimization potential for an all-embrac-
ing, holistic view of your workplace learning initiatives. And to sort your usage data according
to various aspects:
• In-depth statistics regarding the access
period (week, month, year, arbitrary
timeframe)
• General access figures: returning/new visi-
tors
• Analyses of the most popular search
queries and contexts (= applications)
from which users search for or access
Performance Support content
• Application-specific depiction of all que-
ries that didn't produce any hits in your
content
• Access statistics broken down according
to processes, topics and courses
• Overview of the most popular content for- Illustration 2: Distribution of content formats
mats: e-learning, guides, documentation,
short instructions, assessments, third-party
documents
• Depiction of the devices, operating sys-
tems and browsers used
• Output of so-called bounce rates and aver-
age times on site on the Web Publisher
Direct access to the Dashboard via the Web
Publisher portal
The ttps Analytics Dashboard can be accessed
quickly and easily via the Web Publisher portal.
To extract the maximum benefit from the
Dashboard, you need to make it available to
the appropriate groups of people – access can
be controlled administratively via authoriza-
tions.
Illustration 3: Most frequent access contexts
Whitepaper ttps Analytics Dashboard Page 3 of 5All information at a glance
Get a quick overview of all evaluations. The evaluated data are processed in a goal-oriented
manner and presented in a user-friendly way.
Enhanced and optimized tracking events
Reap the benefits of the redesigned tracking events in ttps thanks to much more informative
usage data from the Web Publisher portal and QuickAccess channels.
Deployment scenarios
GENERAL USER STATISTICS TOP 25 CHARTS
Enjoy immediate and ongoing access to the Find out which content, courses, processes and
most up-to-date usage figures and discover topics were accessed most frequently. This in-
how Performance Support is "lived" within your formation can then act as the foundation of a
company. Best Practice aimed at enhancing your Perfor-
Of interest to: management mance Support activities.
Of interest to: academies, L&D department,
REQUIREMENTS ANALYSES specialist divisions
By identifying your users' needs, you can pro-
vide them with the exact learning content that PREFERRED CONTENT FORMATS
they actually require. This information can be By displaying the distribution of the accessed
used during the planning of additional Perfor- content formats, you can discover whether your
mance Support initiatives by your company's users tend to prefer the more detailed e-learn-
various specialist divisions. This way, you can es- ing format or the brevity of a Guide. This way,
tablish a Learning & Development department you can design the optimal fit between your us-
as a one-stop shop for the company-wide dis- ers' moments of need and the content on offer.
tribution of knowledge via QuickAccess. Of interest to: academies, L&D department, ttps
Of interest to: academies, Learning & Develop- authors
ment department, specialist divisions
PREFERRED LEARNING SETTING
OVERVIEW OF THE DEVICES USED Find out which access points are used by your
The Dashboard provides an overview of the de- users, allowing you to adapt your offering ac-
vice classes favored by your users (PCs, cordingly. If processes are predominantly ac-
smartphones, tablets), allowing you to optimize cessed, this could indicate access from within a
the content and access channels to ensure that work process. Whereas if courses are used more
Performance Support initiatives are the perfect often, this tends to suggest that users are stock-
fit for your users' preferences. piling knowledge.
Of interest to: L&D department, specialist divi- Of interest to: academies, L&D department,
sions, IT specialist divisions
ANALYSIS OF USER BEHAVIOR
Monitor the bounces (immediate departure
without additional click), bounce rates and av-
erage times on site, and use this information to
improve in-house communication, the content
provided or general usability.
Of interest to: academy, L&D department, IT
Whitepaper ttps Analytics Dashboard Page 4 of 5Implementation of the ttps Analytics Dashboards The ttps Analytics Dashboard is an optional component of tt performance suite. It requires neither an additional license nor SaaS charges. However, it does require explicit activation. The following steps – most of which are technical – are absolutely essential for its activation: The Dashboard visualization is part of the ttps program code. The data basis is generated via the transmission of special tracking information from the Web Publisher/QuickAccess to an analytics service that collects and processes the data. This service is operated as standard on our proven tt performance suite cloud infrastructure and requires customer-specific activation. This service is free of charge to our SaaS and Managed Hosting customers; On-Premises customers can avail of the service for an annual fee of €3,000. Activation may also require the adaptation of your existing Web Publisher and QuickAccess cus- tomizing – on the one hand, to facilitate the transmission of the necessary tracking information, while on the other hand to integrate the button for accessing the Dashboard into the Web Pub- lisher portal. Our Professional Services Team will be more than happy to assist you with the implementation of all the necessary steps. The associated support services include infrastructure consulting, customiz- ing adaptation and testing to ensure that the solution is executable, and may vary according to in- dividual customer requirements. Should you be interested in implementing the Dashboard, please don't hesitate to get in touch with your tts contact person. Customers who are reluctant to operate cloud solutions can avail of our special support service during the implementation of the tracking service in their own infrastructure, thereby ensuring that they too get to enjoy the full benefits of the ttps Analytics Dashboard. Here too, you are in the best of hands with our Professional Services Team. Privacy protection Our offer fully complies with all current data protection requirements: Both the German data pro- tection guidelines and the EU General Data Protection Regulation (EU GDPR), which came into force in May 2018, are adhered to. Needless to say, the Dashboard also takes account of the most up-to-date models for privacy protection and responsible handling. Whitepaper ttps Analytics Dashboard Page 5 of 5
You can also read