Total Inelastic Cross Section at LHC - Sara Valentinetti, INFN and Univ. of Bologna (Italy) On behalf of ATLAS and CMS
←
→
Page content transcription
If your browser does not render page correctly, please read the page content below
Total Inelastic Cross Section at LHC

       Sara Valentinetti, INFN and Univ. of Bologna (Italy)
                 On behalf of ATLAS and CMS


LC13 Workshop, ECT*, Villa Tambosi, Villazzano (TN), 16-20 Sep 2013
Outline
• Introduction on Inelastic and Diffractive Physics;
• Measurements in CMS, total inelastic cross section:
è single side counting: CMS PAS QCD-11-002;
è pile up counting: CMS PAS FWD-11-001;
Measurement of the Inelastic Proton-Proton Cross Section at √s = 7 TeV
(Phys. Lett. B 722 (2013) 5-27)
• Measurements in ATLAS:
total inelastic cross section è single side counting;
Measurement of the Inelastic pp Cross Section at √s = 7 TeV with the ATLAS
Detector (Nature Comm. 2 (2011) 463);
differential inelastic cross section è rapidity gap counting;
Rapidity Gap Cross Sections measured with the ATLAS Detector in pp
Collisions at √s = 7 TeV (Eur. Phys. J.C72 (2012) 1926);
• Discussion of results and comparison with theory.
2
The Total pp Cross Section
                   Total pp cross section composed by different contributions:

                       σtot=σEL +σSD + σDD + σCD + σND
Elas,c

sca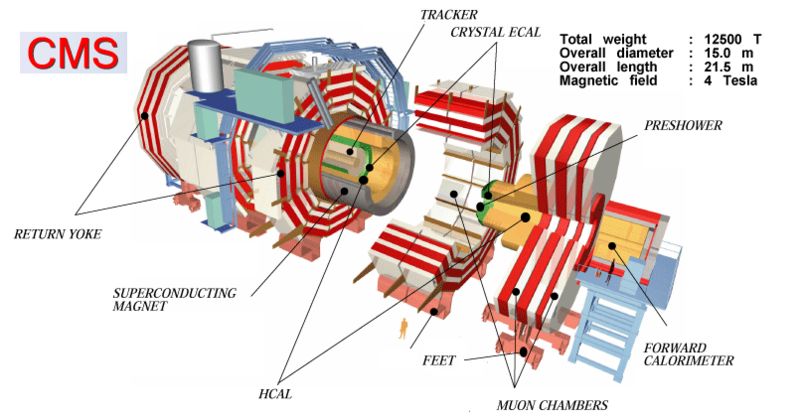
Theoretical Definition of
Diffractive Physics
No unique definition of diffraction processes
1. Interactions mediated by t-channel exchange of object
(ladder of gluons) with the quantum numbers of the
vacuum, i.e. color singlet exchange called “Pomeron”.
2. Interactions where the beam particles emerge
intact or dissociated into low mass states.
Diffractive physics not completely described by QCD.
Phenomenological approaches based on QCD + different models implemented in
MC simulations è importance to compare models to data.
4
Diffractive Dissociation
Experimentally:
Kinematic variables:
• t, the 4-momentum exchanged at the
proton vertex;
• the mass of diffractive system, MX > MY or
ξX(Y)≡MX(Y)2/s (fractional squared momentum loss)
Total cross section not directly measured by ATLAS and CMS yet.
- Direct measurements of MX(Y) difficult: produced particles escape along
the beam-pipe.
- ATLAS/CMS central detectors sensitive to high mass diffraction
è low mass diffractive states not directly observable.
Diffractive processes lead to final state particles separated by large rapidity
gaps: region of no activity (particle production suppressed).
Link between MX and rapidity gap Δη (for SD): Δη ≈ ln s/MX2 = - ln ξX.
5
Analysis Strategy
Limits due to detector acceptance èξ=MX2/s > 5x10⁻⁶ (MX>15.7 GeV)
Inelastic cross section measured in limited kinematic range then
extrapolated at full range using MC.
Measurements: Statistics:
CMS: total inelastic cross section CMS: 7 runs in 2010
ATLAS: total and differential μϵ [0.007;0.1]
inelastic cross section High statistics, systematic
effect due to pile up.
Methods: ATLAS: single fill in 2010
CMS: 1) hit counting in μ = 0.01
calorimeters, Low statistics,
2) vertex counting in pile up removal.
tracker;
ATLAS: hit counting in scintillator
counters;
6
Measurement of the Inelastic Proton-
 Proton Cross Section at √s = 7TeV
            with CMS
    (Phys. Lett. B 722 (2013) 5-27)

                                       7
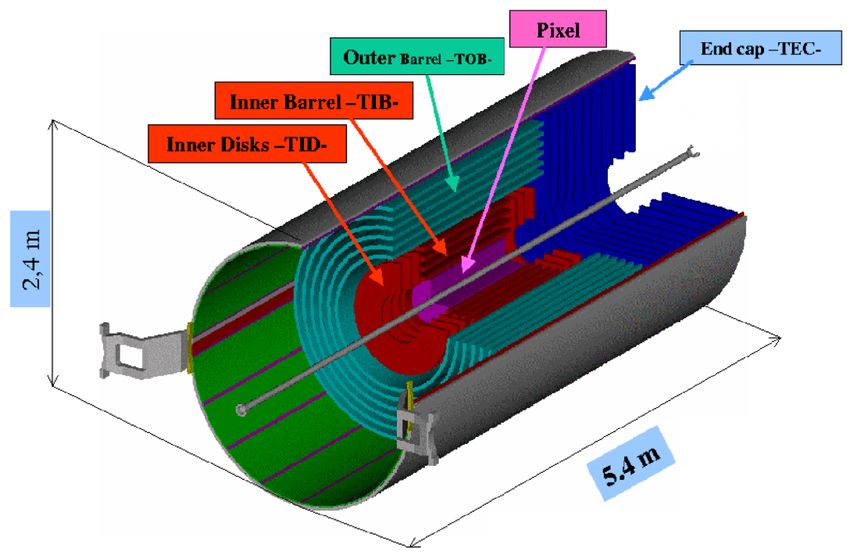
CMS Detector
    Tracker

    |η|
  <
  2.4


                          Hadron

                          Forward

                          Calorimeter

                          (HF)

                          2.9
  <
  |η|
  <
  5.2


                                                      8
Single Side Counting (CMS PAS QCD-11-002)
Number of events with at least 5 GeV of energy in either of the two hadron
forward calorimeters (HF) counted.
Three triggers: 1) coincidence trigger (for pp events);
2) single bunch trigger (for unpaired bunches);
3) random empty trigger (for detector noise).
HF acceptance outside tracker acceptance è impossible to separate
multiple inelastic events in the same bunch crossing è pile up correction
needed.
9
Event Selection Efficiency
Events with small ξ can escape
detection due to detector acceptance
è event selection efficiency studied as
function of ξ for different MC
generators: PYTHIA6, PYTHIA8,
PHOJET.
For ξ > 5x10⁻⁶ CMS has more than
98% efficiency of detection.
ATLAS results are also available for
ξ > 5x10⁻⁶ è direct comparison
10
Cross Section Measurement
                                                                               Pile up
                               −6   N inel (1− fξ )(1+ f pu )                  correction (more
               σ inel (ξ > 5*10 ) =                                            than one
                                             εξ Lint                           collisions
                                                                               counted as one)
Npp - Nbkg

                                                   Contamination: fraction of events passing the
 Detector and event selection    Integrated lumi   selection but produced at ξ5GeV.


The fraction of overlapping events is evaluated from data for 7 different
luminosity conditions:

 For each fpu, a value of σinel(ξ>5*10-6) is provided.
                                                                                          11
Inelastic pp Cross Section @ 7 TeV
                    Averaging σ values obtained
                    under 7 (low) pile-up conditions:

                          pp
                       σ inel (ξ > 5*10 −6 ) = 60.2 ± 0.2(stat.)
                       ±1.1(syst.) ± 2.4(lumi)mb

                    Total inelastic cross section
                    extrapolated to the full
                    kinematic range using six
                    additional MC models.
                    Extrapolation factor (only
                    MC dependent) averaged
                    over models: 1.071±0.025
                       pp
                    σ inel (7TeV ) = 64.5 ± 0.2(stat.) ±1.1(syst.)
                    ±2.6(lumi) ±1.5(extr.)mb

                                                           12
Vertex Counting Method (CMS PAS FWD-11-001)
Estimation of the inelastic cross section by counting event vertices.

It relies on accuracy of tracking system not on MC simulations.

Two samples triggered by tracking
system:
1) single-muon candidate events
   (for analysis);
2) inclusive sample of two-electron
   candidate events (for systematic
   check on the trigger choice).

Specific trigger requirements not important because their efficiencies do not
depend on number of pile up.

                                                                           13
Vertex Definition
• Quality cuts on vertex:
- >1, >2 or >3 tracks with pT >200 MeV in |η|< 2.4 è 3 set of events;
- each track should have at least 2 pixel hits and 5 strip hits in the tracker;
- the vertex should pass an overall quality cut on track fit:
• Vertex efficiency derived from
PYTHIA simulation (~40% for
a 2 tracks vertex (green) and
~20% for a 3 tracks vertex (pink))
• Inefficiencies due to:
- fake vertices (real secondary
vertices and fake secondary
vertices);
- reconstruction inefficiencies.
14
Analysis Strategy
Idea: use the measured probability of
n pileup
(Linst * σ ) having n (0 to 8) inelastic pp
P(n pileup ) = e−(Linst *σ ) interactions each producing a vertex for
n pileup !
different luminosities to evaluate σinel
from fit.
For each sample:
Frac,on
of
pp
events
with
n
pile
up
ver,ces
1) Count the number of pile-up events
for a luminosity value:
– number of vertices in the event counted
for any given bunch crossing;
2) Bin-by-bin MC corrections of the
distribution of number of visible
vertices for various effects;
4) Fit the probability of having 0 to 8
pile-up events as a function of
luminosity with a Poisson curve è
9 values of σvisible obtained.
15
Total Visible Inelastic
pp Cross Section @ 7 TeV
                                   Total visible inelastic
                                   cross section obtained
                                   averaging the 9 values of
                                   visible cross section,
                                   each obtained fitting the
                                   pile up distribution.

  Analysis repeated for the three sets of events:

                                                               16
Total Inelastic pp
                Cross Section @ 7 TeV
                                                 Additional MC models used:
                                                 PYTHIA6, PYTHIA8,
                                                 PHOJET, SIBYLL, EPOS and
                                                 QGSJET-II.


                                                 Similar trend for the measured
                                                 cross sections but substantial
                                                 differences in the expectation of
                                                 the total inelastic pp cross
                                                 section.

   pp
σ inel (7TeV ) = 68.0 ± 2.0(syst.) ± 2.4(lumi)
±4.0(extr.)mb
                                                                                17
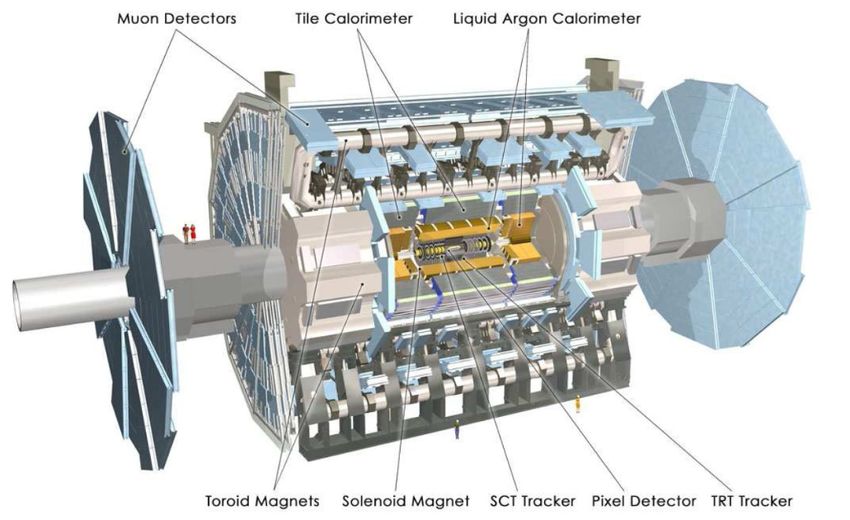
ATLAS Detector
                                                    Calorimeters
                                                    |η| < 4.9

                                                    Tracker
                                                    |η| < 2.5

Minimum Bias Trigger Scintillator
(MBTS) 2.1
Measurement of the inelastic pp cross
section at √s=7 TeV with ATLAS
(Nature Comm. 2 (2011), April 2011)
Minimum Bias Trigger Scintillator (MBTS) counting.
Two data sample:
1) inclusive events: at least two MBTS counters above threshold on
at least one side of ATLAS.
2) single-sided events: at least two MBTS hits on one side and no
hits on opposite side.
19
Cross Section Measurement
                                                           Contamination: fraction of events passing
      MBTS triggered events -
                                                           the selection but produced at ξ10-5)


  N, Nbkg, εtrig, Lint obtained from data.
  εsel, fξ
Constraining fD
• Measure the ratio of single sided to inclusive events RSS=NSS/Nincl
RSS = [10.02 ± 0.03(stat.)+0.1
−0.4 (syst.)]%
• Comparison of data to different MC.
• Constrain fD for each model by finding value that match RSS.
• Different models studied for the systematics.
Constrain on fD:
fD = 26.9 +2.5
−1.0%
data
Default model: PYTHIA8 with
Donnachie-Landshoff ξ-
dependence parametrization.
Other models give fDϵ[25-30]%
21
Total Inelastic pp
Cross Section @ 7TeV
pp
σ inel (ξ > 5*10 −6 ) = 60.3± 0.05(stat.)
±0.5(syst.) ± 2.1(lumi)mb
Measured σ(ξ>5*10-6) lower than PYTHIA/PHOJET predictions.
Total inelastic pp cross section extrapolated to full ξ using PYTHIA
implementation of Donnachie-Landshoff model:
pp
σ inel (7TeV ) = 69.1± 2.4(exp.) ± 6.9(extr.)mb
Large extrapolation errors èImportant to measure it directly. 22
Rapidity Gap Cross Section Measured
   with the ATLAS Detector in pp
       Collisions at √s=7 TeV
                       Eur. Phys. J.C72 (2012) 1926

Inclusive events: at least two counters of Minimum Bias Trigger Scintillator
detector (MBTS) above threshold on at least one side of ATLAS.

Select diffractive sample with large rapidity gap.

Compare dσ/dη (dσ/dξ) with various MC generators allowing to tune MC.

                                                                               23
Rapidity Gap Definition
• Pseudorapidity acceptance defined by tracker and calorimeters:
-4.9 200 MeV
(ID: |η|< 2.5)
- ≥ 1 calorimeter cell above noise
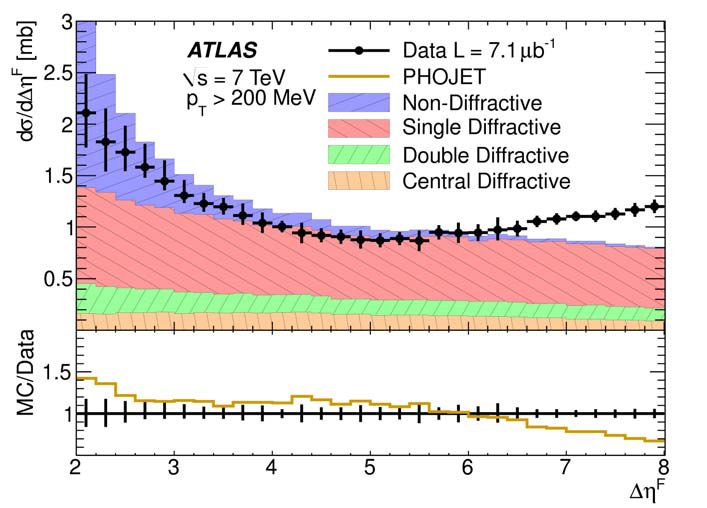
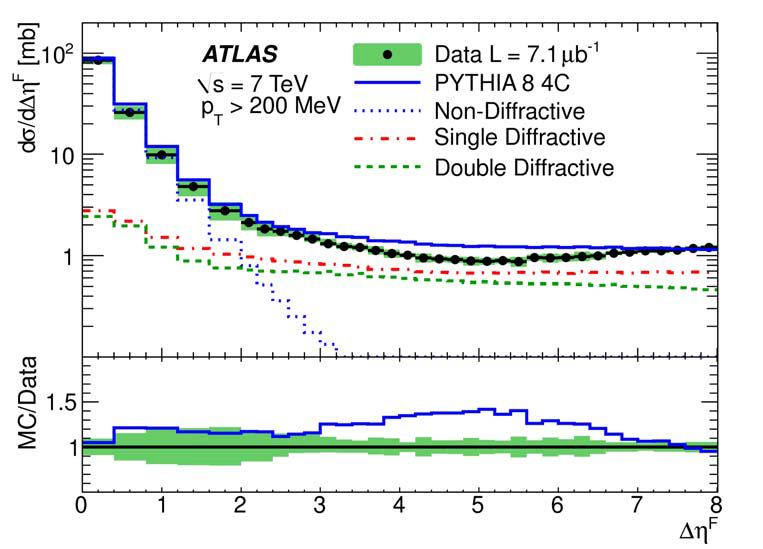
threshold (2.5Differential Inelastic
pp Cross Section
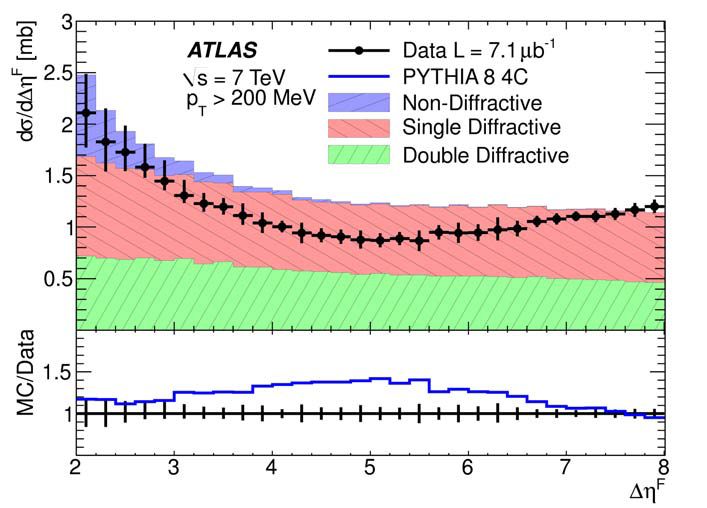
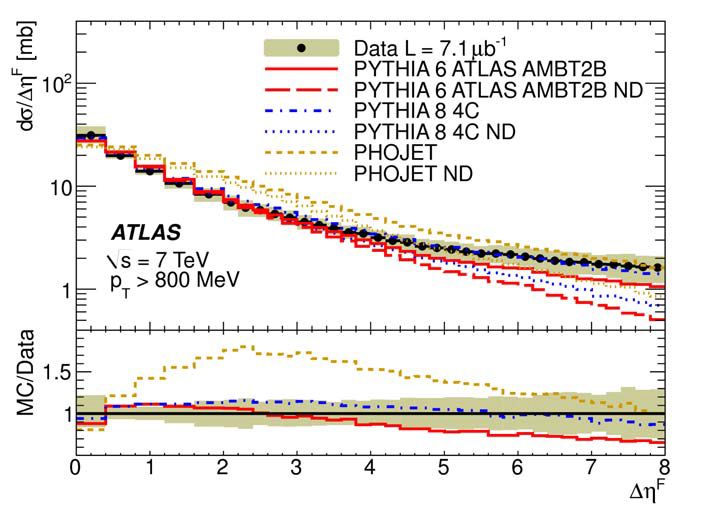
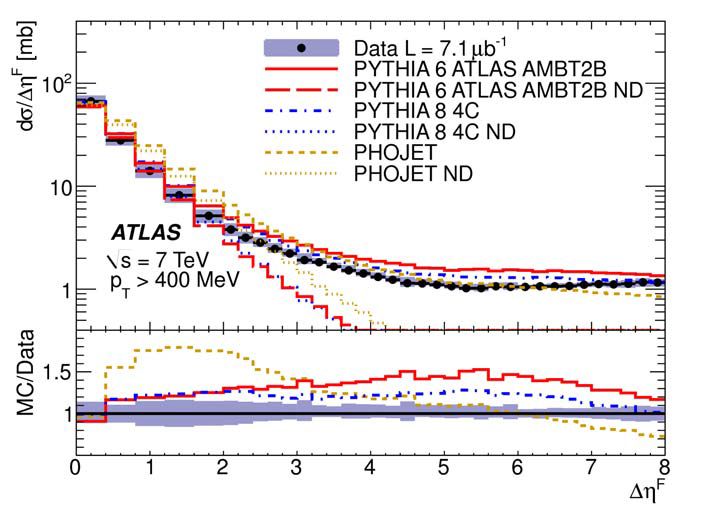
• low ΔηF (dσinel/dΔηF vs Gaps for ΔηF>2
No MC describes all data in all ΔηF range.
PYTHIA reproduces data better at low ΔηF, PHOJET reproduced data better at
intermediate ΔηF. No MC reproduces the rise of cross section at large ΔηF.
PYTHIA:
overshoot of data due to DD overestimation and missing CD components;
PHOJET:
CD contribution modeled but smaller DD contribution. Total inelastic cross
section overestimated.
26
Discussion of results and
comparison with theory


                             27
28


        Comparison of σinel(pp) at √s = 7TeV
                                                                                           TOTEM Total inelastic pp cross
                                                                                           section
                                                                                           σinel=73.5+2.4-1.9 mb

                                                                                           ALICE Visible pp cross section
                                                                                           (2.8
Comparison of Inelastic
pp Cross Section Measurements
29
ATLAS vs Theory
Differential Inelastic Cross Section
    Integrated for ξ>ξcut vs ξcut
                        Total inelast cross section
                        for ΔηFξcut)
                        as function of ξcut

                        log ξ cut = −0.45ΔηF,cut −1.52

                        ATLAS measurements
                        compared with different
                        theoretical models.

                        Similar trend of MC
                        predictions but no one
                        gives a precise description
                        of data.
                                                   30
Conclusions
CMS two independent methods and subdetectors for the
total inelastic cross section.
ATLAS two measurements:
1) total inelastic cross section (MBTS counting)
2) differential inelastic cross section (rapidity gaps)
ATLAS and CMS measured the inelastic cross section in the
kinematic range ξ > 5x10⁻⁶ then extrapolated to the full range:
- agreement for σinel(ξ > 5*10-6);
- extrapolations to total inelastic cross section rely entirely on
theoretical models è more uncertainties.
Future progresses:
direct measurement of σinel via σtot and σel ongoing with ALFA.
31
Back up
 slides

          32
Diffractive Physics
             Theoretically                              Experimentally
1) Interactions where                      Kinematic variable:
beam particles emerge                      mass of diffractive
intact or dissociated into                 system: MX(Y),
low mass states.                           or ξX(Y)≡MX(Y)2/s
2) Interactions mediated                   (fractional squared
by t-channel exchange                      momentum loss).

ladder of gluons with the quantum
                                           Total cross section not directly measured
numbers of the vacuum (color singlet
                                           by ATLAS and CMS yet.
exchange called “Pomeron”).
                                           Direct measurements of MX(Y) difficult:
                                           produced particles escape in the beam-
Diffractive physics not yet completely     pipe. ATLAS/CMS central detectors
described by QCD. Used phenomenological    sensitive to high mass diffraction; low
approaches based on QCD                    mass diffractive dissociation not directly
                                           observable.
Diffractive cross section modeled using
Regge phenomenology.                       Diffractive processes lead to final state
Different models used in the Monte Carlo   particles separated by large rapidity gaps:
simulations: Ryskin, Martin and Khoze      region of no activity (particle production
(RMK); Schuler and Sjöstrand; Bruni and    suppressed).
Ingelman; Berger and Streng; Donnachie     Link between MX and rapidity gap Δη:
and Landshoff; etc etc…
                  Δη = ln s/MX2 ~ - ln ξX.                 33
Analysis Strategy
CMS ATLAS
Total inelastic cross section 1. Total inelastic cross section
Lint=2.78μb-1,7 runs in 2010. Lint=20.3μb-1, single fill in 2010
μmean ϵ [0.007;0.1] μmean = 0.01.
High statistics, systematic effect due to Low statistics, no correction for pile
pile up. up.
Limits on measurements due to
1) Hits in forward calorimeters: detector acceptance:
kinematic limit not geometrical but |η| < 4.9 èξ=MX2/s > 5*10-6
selection efficiency based: (i.e MX>15.7 GeV)
ξ=MX2/s > 5*10-6
(i.e: 5 GeV energy deposited in HF) Inelastic cross section extrapolated at
full range using MC.
2) Visible cross section selecting events
with at least 1 track. 2. Differential cross section
Inelastic cross section extrapolated at Lint=7.1±0.2 μb-1, single fill in 2010.
full range using MC.
μmean=0.01 (negligible pile up).
dσ/dξ as function of ξ.
34
ATLAS: MBTS counting


                           35
MC cross section models

                          36
MBTS multiplicity distribution

                                 37
Choose threshold in ECaloCell

                                38
Comparison of the inelastic cross
   section with prediction

                                39
Optimize the MC for data
       unfolding

                           40
Experimental Effect / Systematics

                                41
MC prediction

                42

                  42
ATLAS: Rapidity Gap


                          43
Hadronization Fluctuation:
 Uncertainty varying pTcut
        Test MC prediction on hadronization
        fluctuations at high ΔηF.
        All models predict by increasing pT:
        - larger ND component at high ΔηF;
        - ND and Diffractive component become similar.

        PYTHIA8 better in describing both shape and
        absolute value.

                                                44
Pomeron-flux Parameterization
Flatness at large ΔηF èPomeron intercept close to 1.
Increase at large ΔηF due to αIP(0) > 1.
α IP (t) = α IP (0) + α ' IP t
In triple Pomeron Regge-model, slope of differential cross section sensitive to
Pomeron intercept value:
dσ Exponential (at
SD differential
2
= G3IP (0)s 2α IP (t )−2 (M X2 )α IP (0)−2α IP (t ) f (t) fixed energy s
cross section dtdM X and MX)
Coupling
Best choice of Pomeron intercept:
- cleanest diffractive region ΔηF>6
- PYTHIA8 + Donnachie-Landshoff flux
parameterization;
- varying αIP(0);
- best estimate: αIP(0)=1.058(40)
Good description of data at ΔηF>5
and ΔηFMC prediction
46
CMS: HFcounting


                      47
Event Selection Efficiency

                    3
  different
  generator

                    and
  for
  two
  threshold

                    energy


                                                     48
CMS: pile up counting
To select vertices with at least 2 track èNDOF > 0.5
NDOF = 2 * Σtracks (weights) − 3 weight ϵ [0;1] (1=perfect track)
49
Vertex Definition


                        50
Vertex reconstruction efficiency


                                  51
Vertex reconstruction efficiency


                                   52
Pile Up Distribution vs Luminosity
                                                                              • The expected distribution of pile
                                                                                up interactions calculated for a
                                                                                specific luminosity interval;
                                                                              • MC simulation reweighted to
Frac,on
  of
  pp
  events
  with
  n
  pile
  up
  ver,ces


                                                                                generate a distribution matching
                                                                                the calculated one;
                                                                              • The generated pile up
                                                                                distributions for inclusive
                                                                                interactions with >1, >2 and >3
                                                                                tracks each with pT>200MeV and
                                                                                |η|
Unfolding
54
Other Measurements: ALFA

                           55
Other Measurements: TOTEM

                            56
57
You can also read