Why Existing Machine Learning Methods Fails At Extracting the Information of Future Returns Out of Historical Sctock Prices : the ...
←
→
Page content transcription
If your browser does not render page correctly, please read the page content below
Why Existing Machine Learning Methods Fails At
                                         Extracting the Information of Future Returns Out
                                         of Historical Sctock Prices : the
                                         Curve-Shape-Feature and
                                         Non-Curve-Shape-Feature Modes
arXiv:2109.06746v1 [cs.CE] 14 Sep 2021

                                         Jia-Yao Yang,a Hao Zhu,a,1 Yue-Jie Hou,a,2 Ping Zhang,b,2 and Chi-Chun Zhoua,3
                                         a
                                             School of Engineering, Dali University, Dali, Yunnan 671003, PR China
                                         b
                                             School of Finance, Capital University of Economics and Business, Beijing 100070, P. R. China

                                         Abstract: The financial time series analysis is important access to touch the complex
                                         laws of financial markets. Among many goals of the financial time series analysis, one
                                         is to construct a model that can extract the information of the future return out of the
                                         known historical stock data, such as stock price, financial news, and e.t.c. To design such
                                         a model, prior knowledge on how the future return is correlated with the historical stock
                                         prices is needed. In this work, we focus on the issue: in what mode the future return is
                                         correlated with the historical stock prices. We manually design several financial time series
                                         where the future return is correlated with the historical stock prices in pre-designed modes,
                                         namely the curve-shape-feature (CSF) and the non-curve-shape-feature (NCSF) modes. In
                                         the CSF mode, the future return can be extracted from the curve shapes of the historical
                                         stock prices. By applying various kinds of existing algorithms on those pre-designed time
                                         series and real financial time series, we show that: (1) the major information of the future
                                         return is not contained in the curve-shape features of historical stock prices. That is, the
                                         future return is not mainly correlated with the historical stock prices in the CSF mode.
                                         (2) Various kinds of existing machine learning algorithms are good at extracting the curve-
                                         shape features in the historical stock prices and thus are inappropriate for financial time
                                         series analysis although they are successful in the image recognition and natural language
                                         processing. That is, existing machine learning methods that are good at handling the CSF
                                         series will fail at extracting the information of future returns out of historical stock prices.
                                         New models handling the NCSF series are needed in the financial time series analysis.

                                         Keywords: Machine learning, Classification, Feature extraction, Financial time series.
                                         Deep learning

                                             1
                                               Hao Zhu and Jia-Yao Yang contributed equivalently to this work.
                                             2
                                               zhangping@cueb.edu.cn. Corresponding author
                                             3
                                               zhouchichun@dali.edu.cn. Corresponding author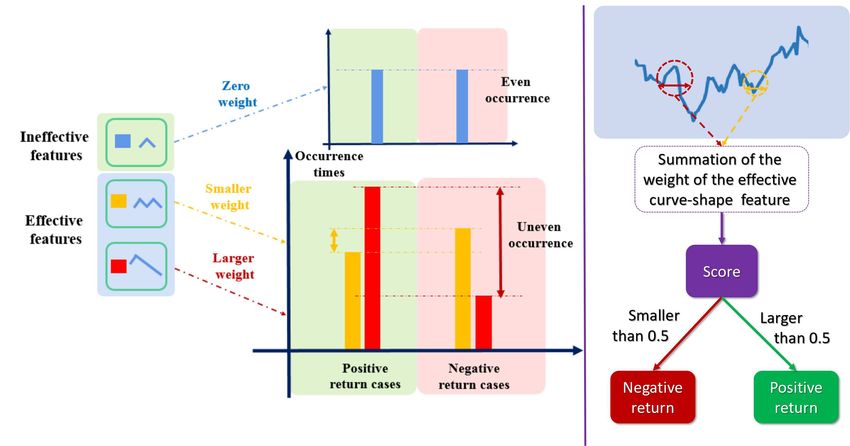
Contents

1 Introduction                                                                              1

2 Pre-designed series: the CSF mode series and NCSF mode series                             3
  2.1 The CSF mode series                                                                   3
  2.2 The NCSF mode series: the momentum-featured series                                    6
  2.3 The selected four kinds of series                                                     6

3 The methods and the experiment settings                                                   7
  3.1 The proposed statistical method for curve-shape features (the SM-CSF model)
        7
  3.2 The existing algorithms: a brief review                                               8
  3.3 The ground truth of the CSF and the NCSF mode series                                  9

4 The    results and     analysis                                                          10
  4.1    The criteria                                                                      10
  4.2    The result of   the   CSF mode series                                             11
  4.3    The result of   the   NCSF mode series                                            11
  4.4    The result of   the   real series                                                 12
  4.5    The result of   the   randomg enerated series                                     13
  4.6    The analysis                                                                      13

5 Conclusions and outlook                                                                  13

6 Acknowledgments                                                                          14

1   Introduction

The financial market is indeed a complex and giant system [1–3]. The financial time series
analysis is important access to touch the complex laws of financial markets [1–3]. Among
many goals of the financial time series analysis, one is to construct a model that can extract
the information of the future return out of the already known historical data, such as stock
prices, financial news, economic events, and political events [4–8].
     Before constructing a model that can extract the information of the future return out
of the historical data, researchers need the prior-knowledge of the markets and investigate
issues such as whether the information of the future return contained in the already known
historical data? Or, is there a correlation between the future return and the historical stock
prices? According to the effective market hypothesis (EMH) [9–11], stocks always trade at
their fair value on exchanges, thus, no investors can outperform the overall market through

                                              –1–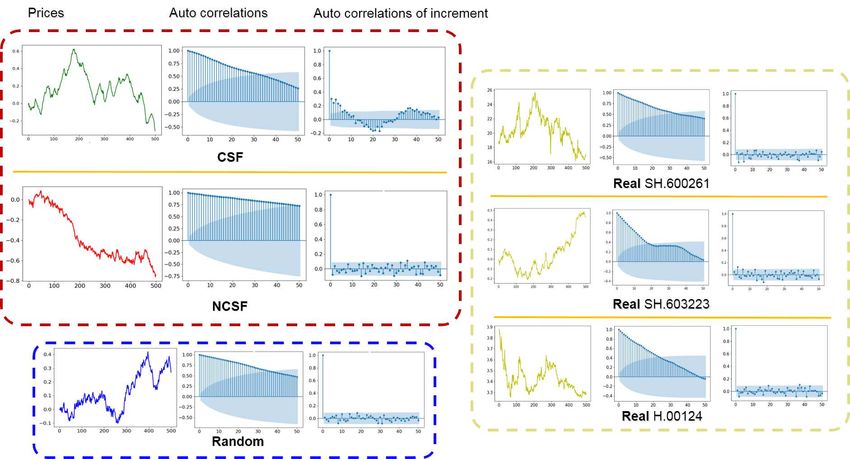
stock selection or market timing, the higher returns can only be obtained by purchasing
riskier investments. Therefore, according to EMH, there is no correlation between the
current price and the future price of the stock market, I.e., any change in the stock price is
completely independent of the past price. However, there are different opinions on the issue
of EMH [9, 11–13] and higher returns can be obtained by technical analysis such as expert
stock selection and market timing in real investments [14–18]. In this regard, we cannot
deny that the historical data of financial markets contains information of the future return.
Therefore, it is of great significance to analyze the hidden features and laws of historical
financial data, including stock prices, financial news, economic events, and political events.
     Stock prices are typical data that are accessible and intuitive. There are research study-
ing how to extract future return from the known historical stock prices. Before the pop-
ularity of machine learning methods, researchers investigate the financial time series from
the perspective of analytical and statistical methods. For example, the fractional market
shows that the financial market has the characteristics of fractional and non-linearity [19–
22]. Spectrum analysis methods [23], such as the Fourier transform [24, 25] and the wavelet
transform [24, 26, 27] are applied to the financial time series analysis. The auto regres-
sive model (AR), the moving average model (MA), the auto regressive and moving average
model (AR-MA), and e.t.c., are proposed to modeling the market [1–3]. Besides is directly
forecasting the future return, the generalized autoregressive conditional heteroskedasticity
model (GARCH) is proposed to model and forecast conditional mean and volatility [28].
Other hybrid models such as ARMA-GARCH [29, 30] and its improved ARMA-GARCH-
M [31] model are proposed . However, the statistical method is not suitable for actively
discovering various potential rules from numerous data [32]
     With the popularity of machine learning methods, researchers use the machine learning
methods to investigate the financial time series. For example, the support vector machines
(SVM) [4, 33] , the recurrent neural network (RNN) [34] and it’s generalization long-short
term memory (LSTM) [35, 36] network, and the convolutional neural network (CNN) [37, 38]
are applied in financial time series forecasting. A multi-scale recurrent convolutional neu-
ral network (MSTD-RCNN) [39] is proposed and proved to improve the accuracy of data
prediction. The hybrid models which is the combination of the statistical method and the
machine learning method such as multi forecast model of ARIMA and artificial neural net-
work (ANN) [40], the FEPA model (FTS-EMD-PCA-ANN) [41], nonlinear autoregressive
neural network model [42] are used in modeling the financial time series. Beyond the model
structure designing, other researchers focus on the data. For example, Ref. [43] evalu-
ates several augmentation methods applied to stocks datasets using two state-of-the-art
deep learning models and show that several augmentation methods significantly improve
financial performance when used in combination with a trading strategy.
     The majority of the research focused on how to improve the model’s behavior in fore-
casting the future return and most of the proposed models report a improving in the fore-
casting accuracy. However, there are research report a failure of the deep learning approach
on financial time series analysis [44]. In our opinions, the prior-knowledge on how the future
stock price or return is correlated with the historical stock price should be obtained before
designing an effect algorithm or model. Unfortunately, to our knowledge, not many research

                                            –2–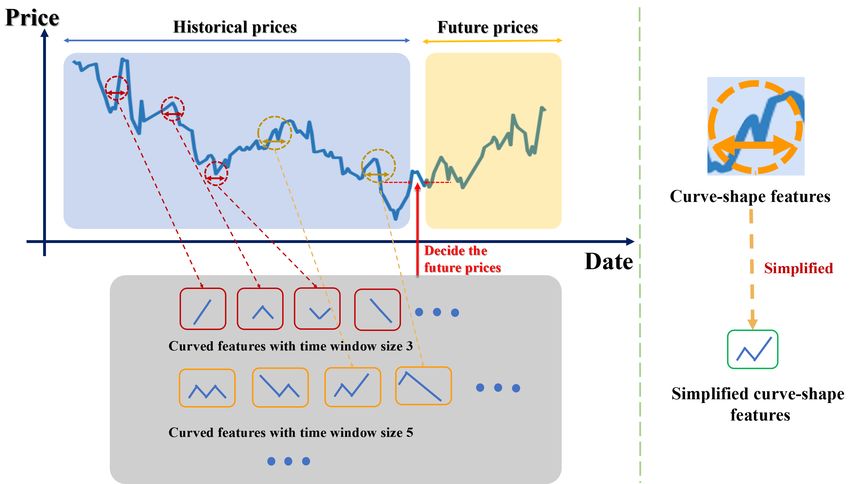
concern the question about in what mode the future return is correlated with the historical
stock price. Or, how is the information of the future return contained in the already known
stock price. With the absence of the prior-knowledge, one might become blind in choosing
models.
     In this paper, under the assumption that the market is not completely effective, we focus
on the issue: in what mode the future return is correlated with the historical stock prices.
We manually design several financial time series where the future return is correlated with
the historical stock prices in pre-designed modes, namely the curve-shape-feature (CSF)
and the non-curve-shape-feature (NCSF) modes. In the CSF mode, the future return can
be extracted from the curve shapes of the historical stock prices. In the NCSF mode,
the information of future return is not contained in the curve shape of historical stock
prices. By applying various kinds of existing algorithms on those pre-designed time series,
we find that various kinds of existing models only perform well on the CSF mode series and
fail on the NCSF mode series. By comparing the behavior of the same algorithm on the
CSF mode series, NCSF mode series, and real financial time series, we conclude that: (1)
the major information of the future return is not contained in the curve-shape features of
historical stock prices. That is, the future return is not mainly correlated with the historical
stock prices in the CSF mode. (2) Various kinds of existing machine learning algorithms
are good at extracting the curve-shape features in the historical stock prices and thus are
inappropriate for financial time series analysis although they are successful in the image
recognition, nature language processing, and e.t.c. It points out that beyond the existing
models, new models that can extract non-curve-shape features are needed in the financial
time series analysis.
     This paper is organized as follows: In Sec. 2, the pre-designed time series, including the
CSF mode series and NCSF mode series, are introduced. In Sec. 3, we firstly give a brief
review on various existing algorithms and secondly apply them on the CSF mode series,
NCSF mode series, and the real series. In Sec. 4, we analyze the results. Conclusions and
discussions are given in Sec. 5.

2     Pre-designed series: the CSF mode series and NCSF mode series

The prior-knowledge that in what mode the future return is correlated with the historical
stock prices is important in financial time series analysis. In this section, we manually
design several financial time series where the future return is correlated with the historical
stock prices in pre-designed modes, namely the curve-shape-feature (CSF) and the non-
curve-shape-feature (NCSF) modes.

2.1    The CSF mode series
In this section, we introduce the CSF mode series. In the CSF mode series the future return
can be extracted from the curve shapes of the historical stock price.
     The curve-shape features and simplified curve-shape features. In the historical stock
price, the curve-shape features are morphological shapes occurring in a window with given
size. There is a large amount of the curve-shape features. In this work, we simplify the

                                             –3–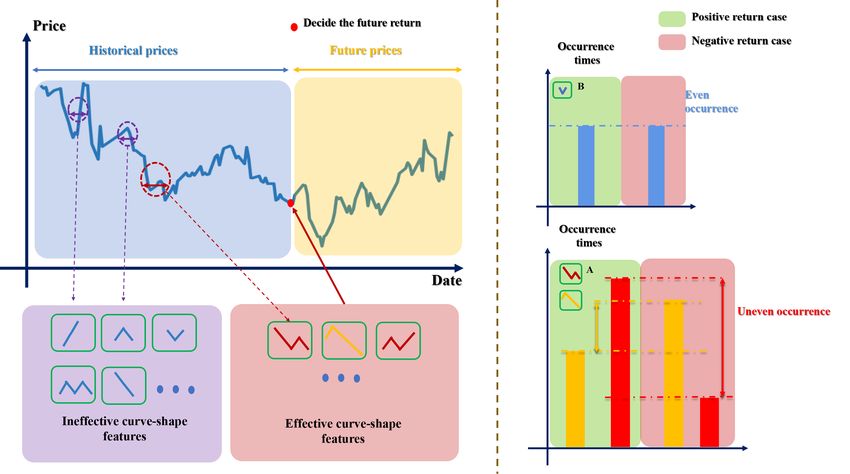
curve-shape features by ignoring the magnitude of the stock prices and only considering the
trend of increase and decrease, as shown in Fig. 1. In the following discussion, we consider
the simplified curve-shape features only and make no distinguish between the curve-shape
features and simplified curve-shape features.

     The effective curve-shape features We can capture numerous different curve-shape fea-
tures from historical financial data. For example, curve-shape features intercepted within
different-size windows, as shown in Fig. 2. The curve-shape features that are strongly
correlated with the future return is the effective curve-shape features. For example, the
curve-shape feature A occurs at a higher frequency in a positive return history series, then,
A is an effective curve-shape feature. The curve-shape feature B occurs evenly in a posi-
tive and negative return history series respectively, then, B is not an effective curve-shape
feature. A combination of effective curve-shape features can predict the future return.

    The CSF mode series. In the CSF mode series the future return can be extracted from
the curve shapes of the historical stock price. We manually assign a weight on the curve-
shape features. The summation of the weight of the features occur in a given historical
stock prices decide the future return. In the CSF mode series, those features with larger
weight are effective curve-shape features, as show in Fig. 3.

Figure 1. Examples of the curve-shape features and simplified curve-shape features. In the sim-
plified curve-shape features only the trend of increase and decrease is considered.

                                            –4–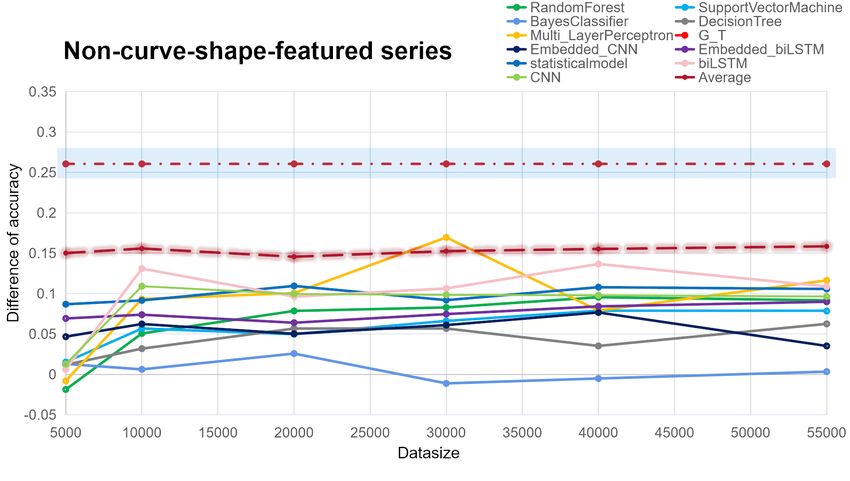
Figure 2. Examples of effective curve-shape features. Effective curve-shape features occur unevenly
in the time series with positive and negative returns and decide the future returns.

Figure 3. Examples of effective curve-shape features with weights and CSF mode series. The
effective curve-shape features with higher degree of uneven occurrences have larger weights. The
summation of the weight of the effective curve-shape features in a time series, namely the score of
the time series, decide the future return. For example, if the score beyond a threshold, the future
return will be positive with a high probability.

                                              –5–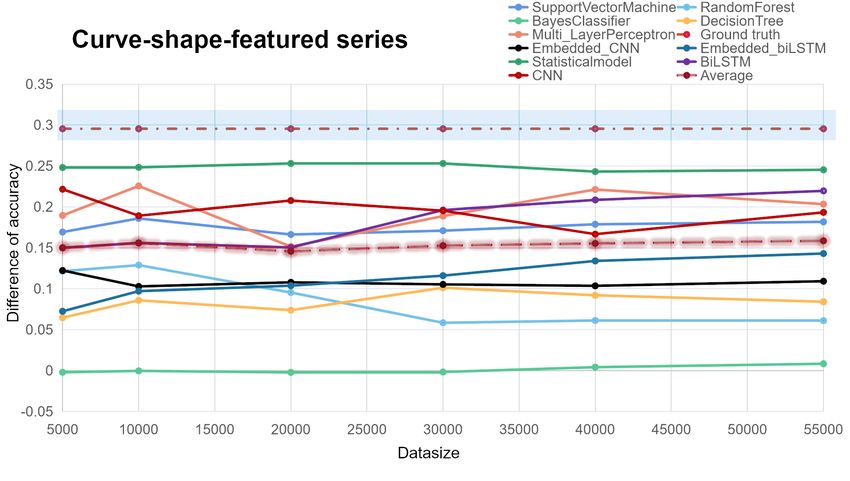
2.2   The NCSF mode series: the momentum-featured series

In this section, we manually design a NCSF mode series, where the future return can not
be extracted from the curve shape of the historical stock prices. In this series, the future
return is determined by the number of rises and falls in the historical data, For the sake of
convenient, we name it the momentum-featured series. For example, for a historical data
with in a fixed-size window, the ratio of the amount of rising data to the total amount of
data is calculated. When the ratio exceeds a given value, say 0.7, the future return will be
positive with a high probability, as shown in Fig. 4. The momentum-featured series is just
one of the NCSF mode series.

                   Figure 4. An example of the momentum-featured series

2.3   The selected four kinds of series

In this section, we introduce the four kinds of series that are used in the following experi-
ment, and they are: (1) the CSF mode series, (2) the momentum-featured series which is
a typical NCSF mode series, (3) the real stock series, and (4) the random generated series.
As shown in Fig. 5.

     In the series, the maximum size of the time window is 20, that is, the next days return
is decided by the prices in previous 20 days.

                                           –6–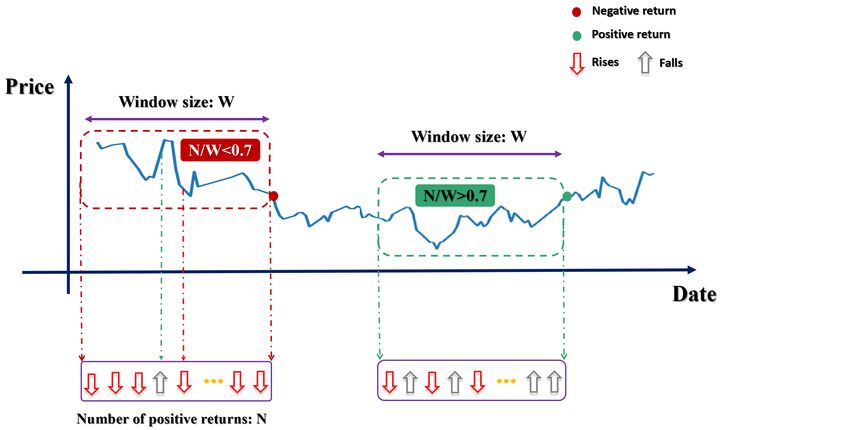
Figure 5. A diagram of the prices and autocorrelation function of the four kinds of series including
the CSF mode, NCSF mode, random generated, and real series.

3     The methods and the experiment settings

In this section, various of existing algorithms are applied on the four kinds of series, in-
cluding a new proposed statistical method, the existing machine learning methods, and the
existing deep learning methods. The result shows that, the existing algorithms are good
at extracting the curve-shape features in the historical stock price. That is, the existing
algorithms are effective for the CSF mode series and are inappropriate for the NCSF mode
series.

3.1    The proposed statistical method for curve-shape features (the SM-CSF
       model)
In this section, we propose a statistical method that is designed to extract the effective
curve-shape features in the series. For the sake of convenient, we name this method sta-
tistical method for curve-shape features (the SM-CSF model). In this section, we give an
introduction of the SM-CSF model.
     In the SM-CSF model, we firstly collect all possible simplified curve-shape features in
given window sizes, say window sizes 4, 5, 6, and 7. Secondly, we count the occurrence times
of each curve-shape features in the positive and negative samples. And the effective curve-
shape features are selected according to their unevenly occurrence times. For example,
if the feature A occurs 100 times in the positive samples and 1000 times in the negative
samples, we consider A as an effective curve-shape feature. Finally, the linear regression
method is applied to find the weight that evaluates the importance of the each effective

                                               –7–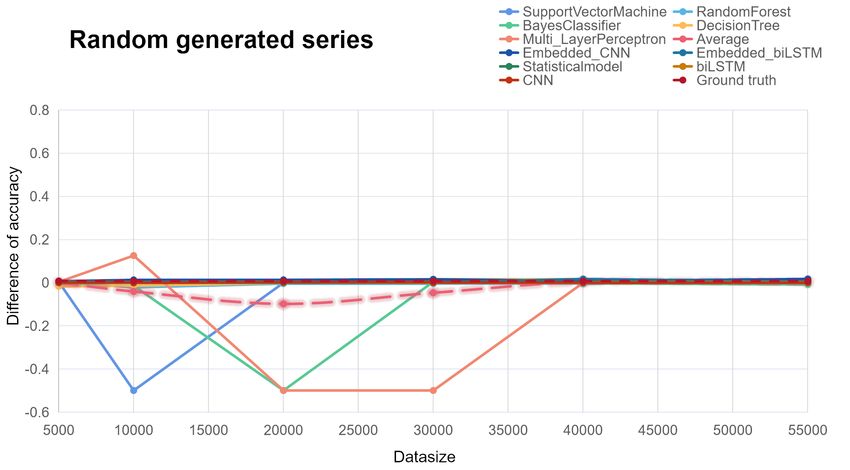
curve-shape feature to the future return. That is, a weight is assigned to each effective
features and the weight is evaluated by linear regression method [45].

3.2   The existing algorithms: a brief review
In this section, we give a brief review of the existing algorithms, including the statistical
methods, machine learning methods, and deep learning methods
     Machine learning methods: support vector machine (SVM) The SVM is a supervised
learning model and related learning algorithm for data analysis in classification and re-
gression analysis. Given a group of training instances, each training instance is marked
as belonging to one or the other of the two categories. SVM training algorithm creates a
model to assign the new instance to one of the two categories, making it a non probabilistic
binary linear classifier [46].
     Machine learning methods: random forest (RF) It can be regarded as a basic classifi-
cation method of decision tree. The decision tree is composed of nodes and directed edges.
The internal nodes represent feature attributes, and the external nodes (leaf nodes) rep-
resent categories. RF is a bagging combination of different decision trees, which is based
on decision tree. The decision tree selects an optimal feature (maximum information gain
ID3, maximum information gain ratio C4.5, minimum Gini index) from the feature set to
branch, while the random forest selects the optimal feature from the randomly selected
feature subset to branch.
     Machine learning methods: multilayer perceptron (MLP) The MLP is a kind of forward
structure artificial neural network, which maps a group of input vectors to a group of output
vectors. MLP can be regarded as a directed graph, which is composed of multiple node
layers, and each layer is fully connected to the next layer. Except for the input nodes, each
node is a neuron with a nonlinear activation function.
     Machine learning methods: bayesian classifier Based on Naive Bayes formula, the maxi-
mum value of a posteriori probability is compared to classify. The calculation of a posteriori
probability is obtained by the product of a priori probability and class conditional proba-
bility. A priori probability and class conditional probability are obtained by training data
set.
     Deep learning methods: the embedded convolution neural network (CNN) The convo-
lutional neural network contains a feature extractor composed of convolution layer and
subsampling layer. In convolution layer of convolution neural network, one neuron is only
connected with some neighboring neurons. In a convolution layer of CNN, there are usually
several feature maps. Each feature plane is composed of some neurons arranged in a rect-
angle. The neurons in the same feature plane share weights, and the weights shared here
are convolution kernels. Convolution kernel is usually initialized in the form of random dec-
imal matrix. In the process of network training, convolution kernel learn to get reasonable
weights. Subsampling, also known as pooling, usually has two forms: mean pooling and
Max pooling [47]. Convolution and subsampling greatly simplify the model complexity and
reduce the model parameters.
     We design an embedded convolution neural network [48]. In this network, firstly, em-
bedding the input series, sparsely representing the original data, converting each value in

                                            –8–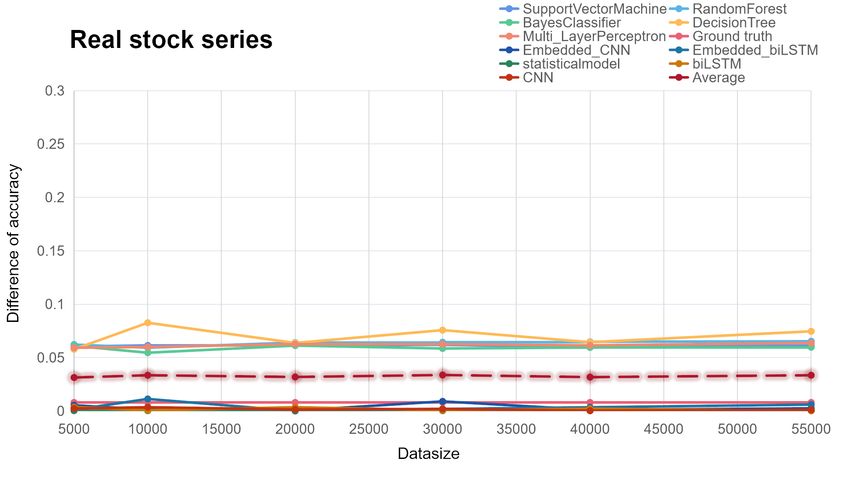
the series into vectors, learning into vector space. After that we convolute the embedded
series by using 32 filters of size 5x7x9, then pooling them to extract the effective features.
Finally, the output prediction value is calculated at the full connection layer.
Deep learning methods: the embedded long short-term memory neural network (LSTM)
LSTM is an improved RNN. LSTM networks consist of LSTM units. LSTM unit is com-
posed of cells having input, output and forget gates. These three gates regulate the infor-
mation flow. With these features, each cell remembers the desired values over arbitrary
time intervals. LSTM cells combine to form layers of neural networks [49].
Based on the biLSTM, we structure an embedded biLSTM, where we embed the input
series firstly, which converts each value in the series into a vector, this process can represent
the series sparsely in vector space. Next,the embedded series is input from forward LSTM
and backward LSTM in one time step. Forward LSTM and backward LSTM are calculated
to get two sets of hidden vectors with valid features. Then two sets of hidden vectors are
stitched together to get the final hidden state [50]. The model’s output layer calculates the
predicted value based on parameters such as hidden state and weight, and the Loss function
use the cross-entropy.
3.3 The ground truth of the CSF and the NCSF mode series
In this work, the CSF and NCSF series are generated manually. According to the generation
rules of the CSF and the NCSF series, we can easily design a model that can extract the
information of future return from such series. With this regard, we consider the model as
the model of ground truth, because it extracts the maximum degree of information from
the CSF and the NCSF series. For the sake of convenient, we name them the ground
truth model for the CSF series (GT-CSF) and ground truth model for the NCSF model
(GT-NCSF).
The GT-CSF model. In the GT-CSF model, the pre-designed rule is used to design the
model. For example, we know the weight for each curve-shape features and the threshold
of the score. By directly calculating the score of the series and comparing it with the
threshold, we can give the trend of future return.
The GT-NCSF model. In the GT-NCSF model, the pre-designed rule is also used to
design the model. For example, we know the ratio between ups and downs that decide the
future return. By directly calculating the ratio of ups and downs and comparing it with
the threshold, we can give the trend of future return.
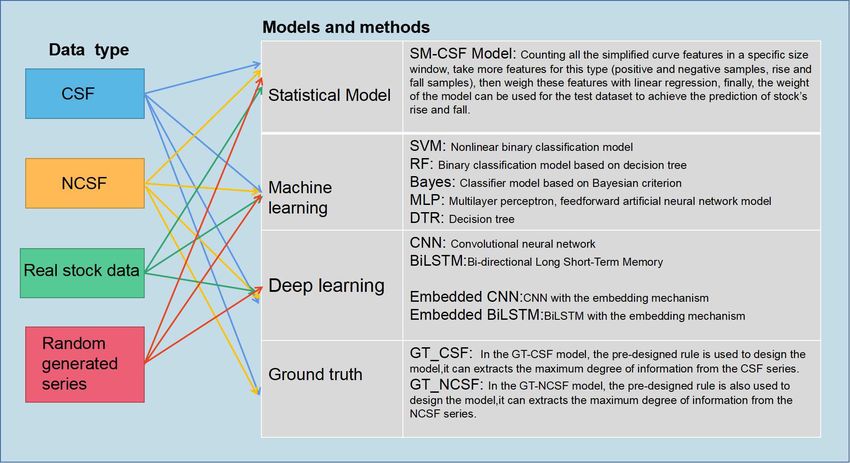
An overview of the methods is given in Fig. 6.
–9–Figure 6. An overview of the methods
4 The results and analysis
In this section, we show the results of different algorithms on the four series.
4.1 The criteria
We give a criterion to judge the behavior of the algorithms as follows: in a given test
data set, we calculate the precision of the positive return cases in selected samples by
each algorithm and compare it with that of the random selected samples. The precision
given by the ground truth gives the upper bound over all the algorithms. For example,
in the randomly selected samples, the precision of the positive return cases is 0.52. The
ground truth is 0.75 evaluates the maximum amount of the information of future return
that is contained in the historical prices. If the precision of selected samples by algorithm
A is obviously larger than 0.52, then algorithm A is concluded to be effective. That is,
algorithm A can extract the mode where the future return is correlated with the historical
price. Otherwise, algorithm A is ineffective on the series.
– 10 –4.2 The result of the CSF mode series
Figure 7. The result of the CSF mode series
4.3 The result of the NCSF mode series
Figure 8. The result of the NCSF mode series
– 11 –Figure 9. The result of several models(deep learning models,statistical model)for CSF mode series
From these different models, we put forward the first four with the best effect and put them
in Figure 8. Through comparison, it can be observed that the deep learning model is more
suitable for extracting the CSF, while the extraction effect for the NCSF is poor.
4.4 The result of the real series
Figure 10. The result of the real stock series
– 12 –4.5 The result of the randomg enerated series
Figure 11. The result of the randomg enerated series
4.6 The analysis
We conclude that in the real financial time series, less information of future return is con-
tained in the curve-shape manner and more information is contained in the non-curve-shape
manner. It points out that beyond the existing models, new models that can extract non-
curve-shape features are needed in the financial time series analysis. We show that various
kinds of existing machine learning models which are successful in the image recognition
and natural language processing are inappropriate in financial time series analysis. We also
point out the reason: various kinds of existing machine learning models are good at extract-
ing the curve shape features and the information of the future return is not all contained
in the curve shape features of historical data.
5 Conclusions and outlook
Through the above research results, we can see that statistical models, machine learning
models, and deep learning models can give effective classification and prediction results for
the curve-shape-featured data, however, for the non-curve-shape-featured data which does
not contain the significant laws, these multi domain models cannot effectively classify them,
that is also completely consistent with our speculation.
This is also sufficient to explain that in the financial data, due to a large number of
combined curve-shape-features and non-curve-shape-features, the current forecasting meth-
ods cannot provide effective answers to the trend of future income. At the same time, we
also pay attention to that in the financial market, different participants and researchers
– 13 –have their own subjective combination of characteristics, because according to the differ-
ent time scales, a lot of combined curve-shape-features can be observed from the historical
data, so everyone form their own judgment methods, such as those experienced investors.
Therefore, the complex and diversified combination of curve-shape-features also affects the
above model to judge the future income results differently.
Our breakthrough in this research is to prove the existence of effective curve-shape-
features from complex financial data. These features of different curve-shape patterns
contain effective information that affects future income results. According to the different
combination methods and orders of various data-shape forms, the formed laws and spec-
ulative results also be different. In addition, the data are mixed with a large number of
non-curve-shape-featured data (disorderly and random data). In the test of A-shares and
Hong Kong stocks data, the test results of the three domain models are invalid, which indi-
cates that the market is not effective under the premise of this theory, if we want to predict
the future trend by analyzing the historical data, we can either analyze more historical
data to extract enough effective features, so as to improve the more accurate basis for the
future trend. Or we can only design more complicated and more powerful models (more in-
telligent models), more accurate parameters, more complicated data processing and model
optimization.
In this experiment, we use supervised models and discrimination models. These models
can be understood as completely relying on data volume, just like use memory. Therefore,
the data classification and prediction effect of curve-shape-features is better. For complex
data that cannot identify the laws, they cannot make effective classification and prediction.
So, we turn to the use of generative models in the next step: AE, GAN, etc.
6 Acknowledgments
We are very indebted to Prof. Wu-Sheng Dai, Guan-Wen Fang, and Yong-Xie for their en-
couragement. This work is supported by Yunnan Youth Basic Research Projects (202001AU070020)
and Doctoral Programs of Dali University (KYBS201910).
References
[1] R. S. Tsay, Analysis of financial time series, vol. 543. John wiley & sons, 2005.
[2] T. C. Mills and R. N. Markellos, The econometric modelling of financial time series.
Cambridge University Press, 2008.
[3] T. G. Andersen, R. A. Davis, J.-P. Kreiß, and T. V. Mikosch, Handbook of financial time
series. Springer Science & Business Media, 2009.
[4] F. E. Tay and L. Cao, Application of support vector machines in financial time series
forecasting, omega 29 (2001), no. 4 309–317.
[5] B. Krollner, B. J. Vanstone, and G. R. Finnie, Financial time series forecasting with machine
learning techniques: a survey., in ESANN, 2010.
– 14 –[6] Q. A. Al-Radaideh, A. A. Assaf, and E. Alnagi, Predicting stock prices using data mining
techniques, in The International Arab Conference on Information Technology (ACIT’2013),
2013.
[7] R. Adhikari and R. Agrawal, A combination of artificial neural network and random walk
models for financial time series forecasting, Neural Computing and Applications 24 (2014),
no. 6 1441–1449.
[8] O. B. Sezer, M. U. Gudelek, and A. M. Ozbayoglu, Financial time series forecasting with
deep learning: A systematic literature review: 2005–2019, Applied Soft Computing 90 (2020)
106181.
[9] S. Basu, Investment performance of common stocks in relation to their price-earnings ratios:
A test of the efficient market hypothesis, The journal of Finance 32 (1977), no. 3 663–682.
[10] B. G. Malkiel, Efficient market hypothesis, in Finance, pp. 127–134. Springer, 1989.
[11] B. G. Malkiel, The efficient market hypothesis and its critics, Journal of economic
perspectives 17 (2003), no. 1 59–82.
[12] A. Degutis and L. Novickytė, The efficient market hypothesis: A critical review of literature
and methodology, Ekonomika 93 (2014) 7–23.
[13] K. Hamid, M. T. Suleman, S. Z. Ali Shah, and R. S. Imdad Akash, Testing the weak form of
efficient market hypothesis: Empirical evidence from asia-pacific markets, Available at SSRN
2912908 (2017).
[14] L. Blume, D. Easley, and M. O’hara, Market statistics and technical analysis: The role of
volume, The journal of finance 49 (1994), no. 1 153–181.
[15] J. J. Murphy, Technical analysis of the financial markets: A comprehensive guide to trading
methods and applications. Penguin, 1999.
[16] W.-K. Wong, M. Manzur, and B.-K. Chew, How rewarding is technical analysis? evidence
from singapore stock market, Applied Financial Economics 13 (2003), no. 7 543–551.
[17] C.-H. Park and S. H. Irwin, What do we know about the profitability of technical analysis?,
Journal of Economic surveys 21 (2007), no. 4 786–826.
[18] C. D. Kirkpatrick II and J. A. Dahlquist, Technical analysis: the complete resource for
financial market technicians. FT press, 2010.
[19] J. A. Scheinkman and B. LeBaron, Nonlinear dynamics and stock returns, Journal of
business (1989) 311–337.
[20] E. E. Peters, Fractal market analysis: applying chaos theory to investment and economics,
vol. 24. John Wiley & Sons, 1994.
[21] E. E. Peters, Chaos and order in the capital markets: a new view of cycles, prices, and
market volatility. John Wiley & Sons, 1996.
[22] N. Laskin, Fractional market dynamics, Physica A: Statistical Mechanics and its Applications
287 (2000), no. 3-4 482–492.
[23] P. Rostan and A. Rostan, The versatility of spectrum analysis for forecasting financial time
series, Journal of Forecasting 37 (2018), no. 3 327–339.
[24] K. Kawagoe and T. Ueda, A similarity search method of time series data with combination of
fourier and wavelet transforms, in Proceedings Ninth International Symposium on Temporal
Representation and Reasoning, pp. 86–92, IEEE, 2002.
– 15 –[25] U. Cherubini, G. Della Lunga, S. Mulinacci, and P. Rossi, Fourier transform methods in
finance, vol. 524. John Wiley & Sons, 2010.
[26] H. Zhang, T. B. Ho, Y. Zhang, and M.-S. Lin, Unsupervised feature extraction for time series
clustering using orthogonal wavelet transform, Informatica 30 (2006), no. 3.
[27] P. S. Addison, The illustrated wavelet transform handbook: introductory theory and
applications in science, engineering, medicine and finance. CRC press, 2017.
[28] L. Bauwens, S. Laurent, and J. V. Rombouts, Multivariate garch models: a survey, Journal
of applied econometrics 21 (2006), no. 1 79–109.
[29] S. Ling and M. McAleer, Asymptotic theory for a vector arma-garch model, Econometric
theory (2003) 280–310.
[30] C. Francq, J.-M. Zakoian, et al., Maximum likelihood estimation of pure garch and
arma-garch processes, Bernoulli 10 (2004), no. 4 605–637.
[31] H. Liu, E. Erdem, and J. Shi, Comprehensive evaluation of arma–garch (-m) approaches for
modeling the mean and volatility of wind speed, Applied Energy 88 (2011), no. 3 724–732.
[32] D. J. Hand, Principles of data mining, Drug safety 30 (2007), no. 7 621–622.
[33] K.-j. Kim, Financial time series forecasting using support vector machines, Neurocomputing
55 (2003), no. 1-2 307–319.
[34] R. Madan and P. S. Mangipudi, Predicting computer network traffic: a time series
forecasting approach using dwt, arima and rnn, in 2018 Eleventh International Conference on
Contemporary Computing (IC3), pp. 1–5, IEEE, 2018.
[35] Y. Wu and J. Gao, Adaboost-based long short-term memory ensemble learning approach for
financial time series forecasting., Current Science (00113891) 115 (2018), no. 1.
[36] J. Cao, Z. Li, and J. Li, Financial time series forecasting model based on ceemdan and lstm,
Physica A: Statistical Mechanics and its Applications 519 (2019) 127–139.
[37] I. E. Livieris, E. Pintelas, and P. Pintelas, A cnn–lstm model for gold price time-series
forecasting, Neural computing and applications 32 (2020), no. 23 17351–17360.
[38] S. Mehtab, J. Sen, and S. Dasgupta, Analysis and forecasting of financial time series using
cnn and lstm-based deep learning models, arXiv preprint arXiv:2011.08011 (2020).
[39] L. Guang, W. Xiaojie, and L. Ruifan, Multi-scale rcnn model for financial time-series
classification, arXiv (2019).
[40] C. N. Babu and B. E. Reddy, A moving-average filter based hybrid arima–ann model for
forecasting time series data, Applied Soft Computing 23 (2014), no. Complete 27–38.
[41] Z. Chengzhao, A Deep Learning Model for Financial Market Forecasting: FEPA Model. PhD
thesis, Chengdu: School of Management and Economics of UESTC, 2016.
[42] G. Benrhmach, K. Namir, A. Namir, and J. Bouyaghroumni, Nonlinear autoregressive neural
network and extended kalman filters for prediction of financial time series, Journal of Applied
Mathematics 2020 (2020).
[43] E. Fons, P. Dawson, X. J. Zeng, J. Keane, and A. Iosifidis, Evaluating data augmentation for
financial time series classification, Papers (2020).
[44] A. Dingli and K. S. Fournier, Financial time series forecasting–a deep learning approach,
International Journal of Machine Learning and Computing 7 (2017), no. 5 118–122.
– 16 –[45] M. Q. Islam and M. L. Tiku, Multiple linear regression model under nonnormality,
Communications in Statistics-Theory and Methods 33 (2005), no. 10 2443–2467.
[46] F. Osisanwo, J. Akinsola, O. Awodele, J. Hinmikaiye, O. Olakanmi, and J. Akinjobi,
Supervised machine learning algorithms: classification and comparison, International Journal
of Computer Trends and Technology (IJCTT) 48 (2017), no. 3 128–138.
[47] D. Palaz, R. Collobert, et al., Analysis of cnn-based speech recognition system using raw
speech as input, tech. rep., Idiap, 2015.
[48] M. Cho, J. Ha, C. Park, and S. Park, Combinatorial feature embedding based on cnn and
lstm for biomedical named entity recognition, Journal of Biomedical Informatics 103 (2020)
103381.
[49] T.-Y. Kim and S.-B. Cho, Predicting residential energy consumption using cnn-lstm neural
networks, Energy 182 (2019) 72–81.
[50] S. Siami-Namini, N. Tavakoli, and A. S. Namin, The performance of lstm and bilstm in
forecasting time series, in 2019 IEEE International Conference on Big Data (Big Data),
pp. 3285–3292, IEEE Computer Society, 2019.
– 17 –You can also read