WILMAR INTERNATIONAL LIMITED - 1Q2017 Results Highlights May 11, 2017 - Media ...
←
→
Page content transcription
If your browser does not render page correctly, please read the page content below
WILMAR INTERNATIONAL LIMITED
1Q2017 Results Highlights
May 11, 2017
IMPORTANT NOTICE

Information in this presentation may contain projections and forward
looking statements that reflect the Company’s current views with
respect to future events and financial performance. These views are
based on current assumptions which are subject to various risks and
which may change over time. No assurance can be given that future
events will occur, that projections will be achieved, or that the
Company’s assumptions are correct.          Actual results may differ
materially from those projected.

This presentation does not constitute or form part of any opinion on
any advice to sell, or any solicitation of any offer to purchase or
subscribe for, any shares nor shall it or any part of it nor the fact of its
presentation form the basis of, or be relied upon in connection with,
any contract or investment decision.

                                                                           1
Content

  1       1Q2017 Financial Performance – Key Takeaways

  2       Business Outlook

  3       Appendix

                                                         2
1Q2017 Financial Performance
– Key Takeaways
Earnings Highlights
vs 1Q16
1Q17 (US$m)
Revenue 10,570 17%
EBITDA 691 24%
Net profit 362 51%
Core profit after tax 313 40%
Earnings per share
5.7 50%
in US cents (fully diluted)
4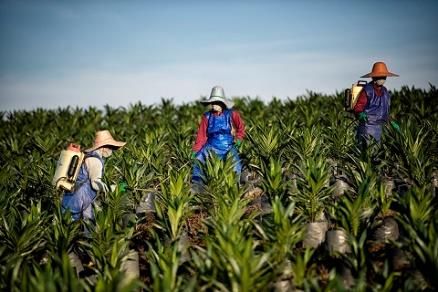
Earnings Highlights – Segment Results (PBT US$m)

                                                                                       1Q17     1Q16       ∆
    Tropical Oils
                                                                                       178.6    149.3    20%
    (Plantation, Manufacturing & Merchandising)
    Oilseeds and Grains
                                                                                       213.7    168.8    27%
    (Manufacturing & Consumer Products)
    Sugar
    (Milling, Merchandising, Refining & Consumer                                       (34.5)   (18.1)   -90%
    Products)
    Others                                                                             69.5     12.1     >100%

    Joint Ventures & Associates                                                        41.9     12.8     >100%

    Unallocated expenses#                                                              (2.0)    (3.6)    43%

    Profit Before Tax                                                                  467.2    321.3    45%

•   # Unallocated expenses refer to expenses in relation to employees’ share options

                                                                                                                 5
Cash Flow Highlights
US$ million                                                                                            1Q17                1Q16                  FY16
Operating cash flow before working capital changes                                                       473                 860                 2,021
Net cash flow from operating activities                                                                  (22)              1,331                 1,124
Less: Acquisitions of subsidiaries, joint ventures and                                                   (10)                  0                 (145)
      associates
      Capital expenditure                                                                               (175)              (165)                 (777)
          Net increase/(decrease) from bank borrowings*                                                1,005              (1,916)                (695)
          (Increase)/decrease in other deposits and                                                      (43)              1,045                   774
          financial products with financial institutions
          Dividends                                                                                        0                   0                 (371)
          Share buy-back                                                                                   0                   0                    (9)
          Others                                                                                          16                (17)                   140
Net cash flow                                                                                            771                 278                    41

Free cash flow                                                                                           (72)              1,245                   592
Note :
* Net bank borrowings include proceeds/repayments of loans and borrowings net of fixed deposits pledged with financial institutions for bank facilities and
unpledged fixed deposits with maturity more than 3 months.

Turnover days are calculated by averaging the monthly turnover days to better reflect the true turnover period in view of the seasonality of the Group’s
business. Monthly turnover days are computed using revenue and cost of sales for the month.

Free Cash Flow = Cashflows (used in)/generated from operations – Capital expenditure – Acquisitions/disposals of subsidiaries,
                                                                                                                                                              6
                                                                                        joint ventures and associates.
Gearing
US$ million                                                               As at                                    As at
                                                                       Mar 31, 2017                             Dec 31, 2016
Debt/Equity (x)                                                            0.79                                     0.81
- Net Debt *                                                             11,883                                   11,692
- Shareholders' funds                                                    15,038                                   14,435

Adjusted Debt/Equity (x)                                                       0.33                                     0.35
- Liquid working capital **                                                   6,979                                    6,706
- Adjusted Net Debt                                                           4,904                                    4,986

Net debt/EBITDA (x) ***                                                        5.00                                        5.21
Adjusted Net Debt/EBITDA (x) ***                                               2.06                                        2.23
*    Net Debt = Total borrowings – Cash and bank balances – Other deposits with financial institutions
** Liquid Working Capital = Inventories (excl. consumables) + Trade receivables – Current liabilities (excl. borrowings)
*** EBITDA for 31 Mar 17 is based on LTM performance.

• Net debt to equity ratio improved marginally to 0.79x compared to 0.81x as at Dec 31,
  2016.
• Adjusted debt to equity ratio improved marginally to 0.33x from 0.35x.

                                                                                                                                  7
Business Outlook
• The Group has shown strong results in the first quarter, particularly
   from our Tropical Oils and Oilseeds and Grains segments. We
   expect our Flour business to continue its growth, while volume
   for consumer products is expected to recover from the seasonal
   reduction in 1Q2017. Although lower CPO prices will impact our
   Plantation and Palm Oil Mills operations, we believe that this will be
   partially offset by anticipated higher palm oil production. Recent
   volatility in sugar prices is expected to impact our Sugar operations.

• Overall,    we are cautiously optimistic              that   the    next
   quarter’s performance will be satisfactory.

• The Group also wishes to announce that it is carrying out an
   internal restructuring of its China operations with the possibility of a
   separate listing. As the proposed listing is still at evaluation stage,
   shareholders are advised to exercise caution in trading their shares.
   There is no certainty or assurance as at the date of this
   announcement that the listing proposal will be carried out.
                                                                          8
Appendix
Business Segment results:
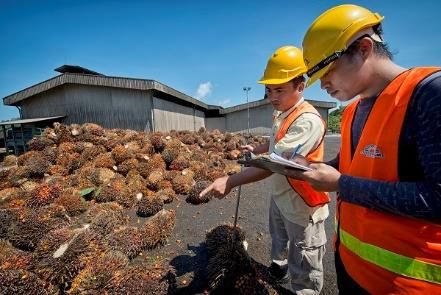
Tropical Oils (Plantation, Manufacturing and Merchandising)
1Q17 1Q16 ∆
Revenue (US$ million) 4,642.9 3,511.6 32%
Plantation 18.1 11.0 63%
Manufacturing & Merchandising 4,624.8 3,500.6 32%
Sales volume (‘000 MT)
5,650 5,557 2%
Manufacturing & Merchandising
Profit before tax
178.6 149.3 20%
(US$ million)
• The PBT increase was mainly attributable to better performance from both refinery
and plantation businesses, with the latter benefitting from higher CPO prices.
• Plantation production yield for 1Q2017 improved by 8% to 4.6 MT per hectare,
resulting in a 4% increase in the production of fresh fruit bunches to 938,771 MT.
10Business Segment results:
Tropical Oils (Plantation, Manufacturing and Merchandising)
1Q17 1Q16 ∆
Planted area (ha) 241,197 240,408 0%
Mature area harvested (ha) 210,928 211,468 0%
FFB production (MT) 938,771 902,035 4%
FFB Yield (MT/ha) 4.6 4.3 8%
Mill Production
Crude Palm Oil (MT) 393,696 375,980 5%
Palm Kernel (MT) 97,061 88,951 9%
Extraction Rate
Crude Palm Oil 20.0% 20.8% -4%
Palm Kernel 4.9% 4.9% 0%
New Planting (ha) 20 143
11Business Segment results:
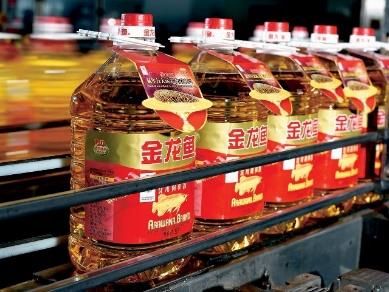
Oilseeds and Grains (Manufacturing and Consumer Products)
1Q17 1Q16 ∆
Revenue (US$ million) 4,464.5 4,496.8 -1%
Manufacturing 2,788.3 2,436.0 14%
Consumer Products 1,676.2 2,060.8 -19%
Sales volume (‘000 MT) 7,118 7,185 -1%
Manufacturing 5,696 5,462 4%
Consumer Products 1,422 1,723 -17%
Profit before tax
213.7 168.8 27%
(US$ million)
• The segment continued its positive performance from 2H2016 and recorded another
quarter of solid performance in 1Q2017. The strong segment profits were achieved
on the back of higher soybean volume crushed and stable crushing margins. This
was partially offset by weaker seasonal sales volume from the Consumer Products
businesses, which had been affected by the early Chinese Spring Festival in 2017.
12Business Segment results:
Sugar (Milling, Merchandising, Refining and Consumer Products)
1Q17 1Q16 ∆
Revenue (US$ million) 1,236.5 770.5 60%
Milling 42.9 29.3 47%
Merchandising, Refining & Consumer Products 1,193.6 741.2 61%
Sales volume (‘000 MT) 2,488 1,955 27%
Milling 203 88 >100%
Merchandising, Refining & Consumer Products 2,285 1,867 22%
Profit before tax
(US$ million)
(34.5) (18.1) -90%
• The segment loss was mainly due to seasonal maintenance in the first half of the year
by the Australian Milling business and weaker performances from both our
Merchandising and Refining businesses.
• Higher Merchandising activities during the quarter resulted in the increase in sales
volume. This, in addition with the higher sugar prices, resulted in the increase in
revenue during the quarter.
13Cash Flow
US$ million 1Q17 1Q16 FY16
Operating cash flow before working capital changes 473 860 2,021
Net cash flow from operating activities (22) 1,331 1,124
Less : Acquisitions of subsidiaries, joint ventures and (10) 0 (145)
associates
Capital expenditure (175) (165) (777)
Net increase/(decrease) from bank borrowings* 1,005 (1,916) (695)
(Increase)/decrease in other deposits and financial (43) 1,045 774
products with financial institutions
Dividends 0 0 (371)
Share buy-back 0 0 (9)
Others 16 (17) 140
Net cash flow 771 278 41
Free cash flow (72) 1,245 592
Turnover days
- Inventories 70 70 64
- Trade Receivables 35 35 33
- Trade Payables 13 13 13
Note :
* Net bank borrowings include proceeds/repayments of loans and borrowings net of fixed deposits pledged with financial institutions for bank facilities and
unpledged fixed deposits with maturity more than 3 months.
Turnover days are calculated by averaging the monthly turnover days to better reflect the true turnover period in view of the seasonality of the Group’s business.
Monthly turnover days are computed using revenue and cost of sales for the month.
Free Cash Flow = Cashflows (used in)/generated from operations – Capital expenditure – Acquisitions/disposals of subsidiaries,
joint ventures and associates. 14Cash Flow
• Inventories decreased 1.1% to US$6.9 billion as at 31 March 2017 due to
lower stockholding of consumer products in China after the festive season.
Average turnover days remained comparable at 70 days in 1Q2017.
• Trade receivables decreased by US$312.8 million to US$3.8 billion in
1Q2017 mainly due to reduction in receivables as a result of sales timing.
Average turnover days remained comparable at 35 days in 1Q2017.
• Trade payables decreased by US$216.7 million to US$1.3 billion in 1Q2017
mainly due to seasonal impact by the Sugar segment. Average turnover
days remained comparable at 13 days in 1Q2017.
15Funding and Liquidity
As at Mar 31, 2017
US$ million Available Utilised Balance
Credit facilities :
Committed 9,935 7,261 2,674
Trade finance 21,318 9,887 11,431
Short term 897 282 615
Total credit facilities 32,150 17,430 14,720
• 57% of utilised facilities were trade financing lines, backed by inventories and
receivables.
• 54% of total facilities were utilised as at March 31, 2017.
16Key Indicators
As at As at
Mar 31, 2017 Dec 31, 2016
Return on Average Equity* 7.4% 6.7%
Return on Average Capital Employed* 4.8% 4.5%
Return on Invested Capital* 5.1% 4.6%
in US cents
EPS (fully diluted) 5.7 15.4
NTA per share 168.7 159.4
NAV per share 237.9 228.5
* Mar 17 returns based on LTM performances
Formulas :
Return on Average Equity = Net profit ÷ Average equity
Return on Average Capital Employed = EBIT x (1 – tax rate) ÷ (Average equity +Average minority interest + Average net debt)
Return on Invested Capital = (Earnings before interest – Fair value of biological assets) ÷ (Average long term assets excl Intangibles &
DTA + Average net working capital excl cash and borrowings)
17You can also read