www.alineanutrition.com - Alinea Nutrition
←
→
Page content transcription
If your browser does not render page correctly, please read the page content below

JULY 2021

www.alineanutrition.com
TABLE OF
           CONTENTS
           What We Know, Think We Know, or Are Starting to Know   03

           Geek Box: Post-hoc Secondary Analysis                  04

           The Study                                              05

           Results                                                06

           The Critical Breakdown                                 09

           Key Characteristic                                     09

           Interesting Finding                                    10

           Relevance                                              12

           Application to Practice                                14

           References                                             15

02   www.alineanutrition.com
Vergara M, Hauser ME, Aronica L, Rigdon J, Fielding-Singh P, Shih CW,
Gardner CD. Associations of Changes in Blood Lipid Concentrations
with Changes in Dietary Cholesterol Intake in the Context of a Healthy
Low-Carbohydrate Weight Loss Diet: A Secondary Analysis of the
DIETFITS Trial. Nutrients. 2021; 13(6):1935.

What We Know, Think We Know, or Are Starting to Know
Ah, dietary cholesterol. That most exacting of nutrients, an intercorrelated conundrum with
70yrs of research and yet, we are not much further along in reconciling the evidence compared
to the metabolic ward studies of the 1950’s.

There are 3 ways to think about the role of dietary cholesterol as it pertains to potential risk of
cardiovascular disease [CVD]:

 •   The absolute impact of dietary cholesterol on LDL-C, as the causal intermediate risk
     factor for CVD

 •   The expected impact of those changes in LDL-C on CVD outcomes

 •   The tight relationships between dietary cholesterol, total energy, saturated fat and
     unsaturated fats, and dietary fibre [which plays a role in cholesterol recycling]

Ancel Keys and colleagues conducted a range of experiments with diets ranging from entirely
free of dietary cholesterol to 700mg/d, and with diets with 0g dietary fat up to 150g dietary fat,
carefully controlling for energy and different sources of fats (1). In a 1958 review (2) of his and
others’work, Keys stated: “The ensemble points strongly to the conclusion that, other things
being equal, the serum cholesterol level in adult man is independent of the cholesterol intake
over the range of zero to at least 700mg daily.”

This was not to state that dietary cholesterol had no effect on blood cholesterol levels at all,
but that the variations in blood cholesterol levels themselves were primarily influenced by
other factor factors, total dietary fat and composition in particular (2). For example, when they
fed participants 15g of fat per day and zero dietary cholesterol, blood cholesterol dropped by
about 80% of baseline values; however, when they added up to 500mg of dietary cholesterol
to 15g fat, the same results were observed. The changes in dietary cholesterol were achieved
by adding egg yolks to the diet.

Dietary cholesterol could never truly be left out, however, because the Keys and Hegsted
Equations developed to predict the effects of saturated fat and polyunsaturated fat on blood
cholesterol levels could not be fully determined unless dietary cholesterol was included in the
equations (1,3). Indeed, despite the greatest magnitude of change in blood cholesterol levels
being observed from saturated fat, and to a lesser extent polyunsaturated fat, it was known
that dietary cholesterol does have an effect in and of itself.

                                                                      www.alineanutrition.com         03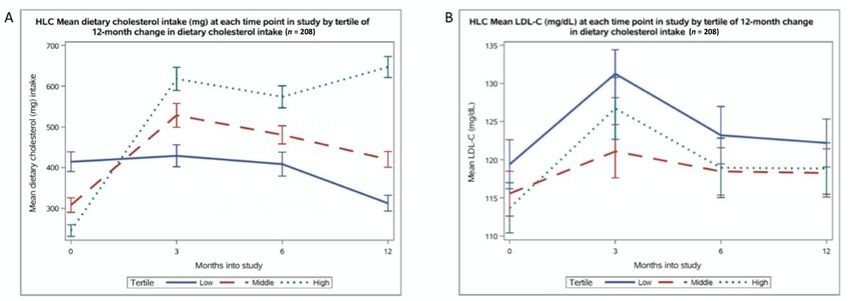
A number of studies have sought to update the evidence for the effects of dietary cholesterol.
     In a 1997 analysis of 395 metabolic ward studies, Clarke et al. (4) showed that a reduction of
     200mg/d dietary cholesterol would be predicted to lower LDL-C by 0.13mmol/L [5.01mg/dL].
     A more recent 2019 (5) study conducted a meta-regression analysis [where data is combined
     from multiple primary sources to estimate the relationship between two variables, e.g., dietary
     cholesterol and blood cholesterol], and found that a 100mg/d change in dietary cholesterol
     would be predicted to alter LDL-C by 0.11mmol/L [4.52 mg/dL]. That analysis investigated
     dose-responses, and found that the greatest magnitude of change in blood cholesterol levels
     occurred in a range of 0-400mg/d, after which the effect on blood cholesterol levels plateaued.

     The magnitude of effect in these studies has been derived from isocaloric trials, i.e., studies not
     designed for weight loss. However, while weight loss may improve blood cholesterol levels,
     the magnitude of effect is relatively small: 0.2mmol/L [8mg/dL] per 10kg weight loss (6). The
     present study conducted a secondary analysis* of the associations between changes in dietary
     cholesterol intake, and changes in blood lipids, from a large weight loss diet trial.

     *Geek Box: Post-hoc Secondary Analysis
     The literal translation of the Latin term ‘post-hoc’ is ‘after this’. Post-hoc means something which
     occurs after an event. A post-hoc analysis is therefore an analysis which is undertaken after a
     trial has concluded, using data from that trial, to look at a question that was not pre-specified.
     So of course, while all data analysis is conducted after a study is concluded, the key feature of a
     post-hoc analysis is that it is secondary to the study, and the question it is addressing was not
     a primary research question. For example, the DIETFITS trial was designed to test the effects of
     baseline insulin secretion and genetic factors on response to either low-carbohydrate or low-
     fat diets. It was not designed to test the effects of different percentages of saturated fat on
     cardiovascular risk factors. However, the researchers had data on both diet and blood lipids.
     Thus, they could do a post-hoc analysis secondary to the intervention, looking at the relationship
     between saturated fat and blood lipids. However, it is important to distinguish that because it
     is a secondary analysis and not part of the pre-planned study, in effect a post-hoc analysis is an
     observational study. It can look at relationships, but not causality. Post-hoc analyses are very
     useful, and informative, tools in research, particularly where a well-conducted controlled trial
     generates a rich data set. Like all research designs, it is important to understand their place, and
     what they can show (associations) and cannot show (causation).

04      www.alineanutrition.com
The Study
The DIETFITS study was a randomised controlled trial with 609 men and women aged 18-50
and BMI of 28-40 whom were randomised to either a healthy low-fat diet [HLF] pattern or a
healthy low-carb diet [HLC] pattern. The primary aims of the trial were to test the effects of
baseline insulin secretion or genetics influenced weight loss on either diet over 12-months.
Participants on either diet were not given prescriptions for energy intake, or percentage targets
for any macronutrient. The intervention began with instructions to maximally reduce either
total fat [HLF] or carbs [HLC], following which individuals could find a level of intake that they
felt could be maintained indefinitely. Both groups were counselled to:
a. maximise vegetable intake;
b. minimise intake of refined flours, added sugars, and trans fats;
c. focus on whole foods that were minimally processed, nutrient-dense, and aim to
prepare food at home where possible.
All participants were counselled over the 12-month duration of the intervention by dietitians
and health educators, and both diet groups received 22 diet-specific education sessions over
the study period. The study was single-blinded, with data collectors blinded to diet group
allocation. Data collection, including blood sampling for examination of blood lipid levels,
occurred at baseline, 3-months, 6-months, and 12-months. At each of these data collection
points, dietary intake was assessed via three unannounced 24-hour dietary recalls using the
multiple-pass interview method.
For this present study, a post-hoc secondary analysis was performed using data from subjects
on the HLC diet [n = 208] to examine whether changes in dietary cholesterol intake were
associated with changes in LDL-C, HDL-C, and triglycerides. Only subjects with complete diet
and blood lipid data for the entire intervention period were included. Subjects were divided
into tertiles of dietary cholesterol intake according to their 12-month change in dietary
cholesterol intake, from highest to lowest [i.e., highest change, moderate change, lowest
change]. For completeness, the analysis was repeated for the LF diet group.
www.alineanutrition.com 05Results: Participants on average were aged 40yrs and 39yrs in the HLC and HLF groups,
respectively. Average LDL-C levels at baseline were 3.0mmol/L [116mg/dL] and 2.8mmol/L
[111mg/dL] in the HLC and HLF groups, respectively. Baseline dietary cholesterol intake
was 322mg/d and 320mg/d in the HLC and HLF groups, respectively. 50% of the HLC group
consumed >300mg/d dietary cholesterol at baseline.
For the overall group differences, the HLC group increased dietary cholesterol by 137mg/d,
compared to an 82mg/d decrease in the HLF group. The following findings set out the results
by tertile of change in dietary cholesterol intake.
Change in Dietary Cholesterol and Correlations with LDL-C:
• HLC:
• Lowest: Dietary cholesterol decreased by 102mg/d, for an average daily intake at
12-months of 312mg/d. This correlated with an increase in LDL-C of 0.07mmol/L
[2.8mg/dL] in this group.
• Middle: Dietary cholesterol increased by 112mg/d, for an average daily intake at
12-months of 420mg/d. This correlated with an increase in LDL-C of 0.06mmol/L
[2.7mg/dL] in this group.
• Highest: Dietary cholesterol increased by 401mg/d, for an average daily intake at
12-months of 647mg/d. This correlated with an increase in LDL-C of 0.13mmol/L
[5.1mg/dL] in this group.
The 12-month changes in dietary cholesterol in the HLC group were not significantly correlated
with changes LDL-C, HDL-C, or triglycerides.
06 www.alineanutrition.comFigure from paper illustrating (top) the change in dietary cholesterol intake in each
tertile of dietary cholesterol change [from left to right], and (bottom) the related change
in LDL-C levels after 12-months of consuming the healthy low-carb diet. The ‘x’ in each
boxplot represents the mean level, while the horizontal line represents the median; as
you can see, both are practically identical, which indicates that the mean was not overly
influenced by outlier values. The size of the box itself, from top to bottom, represents the
75th percentile and 25h percentile, respectively; again you can see these were largely
similar, reflecting the lack of average differences between groups despite substantially
different dietary cholesterol intakes. The ‘whiskers’ either side of the box represent 1.5 x
the interquartile range [the box], which shows range of values higher or lower than the
75th percentile and 25h percentile, respectively.
• HLF:
• Lowest: Dietary cholesterol decreased by 263mg/d, for an average daily intake at
12-months of 181mg/d. This correlated with a decrease in LDL-C of 0.10mmol/L
[3.9mg/dL] in this group.
• Middle: Dietary cholesterol decreased by 61mg/d, for an average daily intake at
12-months of 216mg/d. This correlated with a decrease in LDL-C of 0.02mmol/L
[0.8mg/dL] in this group.
• Highest: Dietary cholesterol increased by 79mg/d, for an average daily intake at
12-months of 316mg/d. This correlated with a decrease in LDL-C of 0.04mmol/L
[1.6mg/dL] in this group.
The 12-month changes in dietary cholesterol in the HLF group were not significantly correlated
with changes LDL-C, HDL-C, or triglycerides.
www.alineanutrition.com 0712-month Change in LDL-C per 100mg Increase in Dietary Cholesterol:
• HLC: Without adjusting for any other factors, the 12-month change in LDL-C levels for
each 100mg increase in dietary cholesterol was 0.009mmol/L [0.37mg/d]. Adjusting for
age, gender, baseline dietary cholesterol, and 12-month changes in saturated fat and
body weight, that change in LDL-C per 100mg dietary cholesterol was 0.0002mmol/L
[0.01mg/dL].
• HLF: Without adjusting for any other factors, the 12-month change in LDL-C levels for
each 100mg increase in dietary cholesterol was 0.03mmol/L [1.17mg/dL]. Adjusting
for age, gender, baseline dietary cholesterol, and 12-month changes in saturated fat
and body weight, that change in LDL-C per 100mg dietary cholesterol was 0.01mmol/L
[0.57mg/dL].
Thus, there was no significant correlation with changes in LDL-C per 100mg increase in dietary
cholesterol in either the HLC or HLF groups.
Figure from the paper illustrating (left) the average dietary cholesterol intake at each data
collection point in the study [i.e., baseline, 3-months, 6-months, 12-months]. The solid
royal blue plot line is the lowest tertile of change in dietary cholesterol; the red dashed plot
line is the middle tertile; the green dashed plot line is the highest tertile. The figure on the
right illustrates the average LDL-C level measured at each of those data collection points.
As can be clearly seen, while the dietary intake increased significantly by 401mg in the
highest tertile group, this increase was almost entirely within the first 3-months of the study.
However, while LDL-C was measured at its highest at 3-months, it appears to have declined
by 6-months and plateaued by 12-months.
08 www.alineanutrition.comThe Critical Breakdown
Pros: Randomisation method was appropriate [computer generated] and was conducted by
a statistician not involved in the study. Participants did not find out which diet they had been
assigned to until after baseline data collection was completed. The trial emphasised overall
diet patterns, rather than targeting specific thresholds of intake. The dietary quality in both diet
groups was high. Both groups received equally intensive counselling, a positive as nutrition
trials may often be biased toward the intervention group. The trials had nearly 50:50 men and
women, had a large sample size, and had excellent retention for a weight loss trial. The present
analysis contained a large sample of 208 in the HLC diet group with full dietary data and lipid
measurements for the entire study.
Cons: The present study was a post-hoc secondary analysis, and is therefore a correlative study
and does not demonstrate potential cause-effect relationships. As a secondary analysis, the
authors were unable to distinguish whether the results were due to the reduction in refined
carbohydrate and added sugars that occurred on the HLC diet, which could have explained
the lack of overall impact on blood lipids. It would have been helpful to know whether the
three 24hr diet recalls included, for example, two weekdays and one weekend, given typical
variances in diet that occur thereto. It would also have been informative if change in energy
intake was added as a variable in the regression analysis. While not a necessarily a major‘Con’,
the participants baseline LDL-C levels were not particular high, i.e., but this reflects the fact that
the DIETFITS intervention was primarily a weight loss trial, not a trial assessing CVD risk.
Key Characteristic
One of the methodological barriers with RCTs in nutrition is the relatively narrow range
of variability in nutrient intake in participants at baseline. This often means that, after
randomisation, there isn’tthat much of a difference in levels of intake between two comparison
groups, and it can mean it is difficult to see meaningful differences between groups. To
compound this, most trials will simply report on the mean change in a group as a whole. For
example, we know from the present study that for the overall group mean differences, the
HLC group increased dietary cholesterol by 137mg/d, compared to an 82mg/d reduction in
the HLF group.
Many studies would just leave it at that. However, the present study divided the diet groups
into tertiles, based on changes in the exposure of interest, i.e., dietary cholesterol. While it is
standard practice in nutritional epidemiology to rank participants according to levels of intake
of an exposure [whether that is a food or nutrient], it is seldom done in RCTs. This allowed for
important insights into the varying levels of change in dietary cholesterol, both increases and
decreases, and the potential relationship with other dietary factors.
However, as the authors note, division into tertiles creates differences between groups that
may influence the findings, e.g., differences in baseline dietary cholesterol levels; this is why
the regression analysis was important, because the effects of changes in dietary cholesterol
on LDL-C levels could be analysed while adjusting for factors like age, gender, baseline dietary
cholesterol, and 12-month changes in saturated fat and body weight.
www.alineanutrition.com 09Interesting Finding
The change in egg consumption over the 12-months, and the contribution of daily egg
consumption to dietary cholesterol intake in the HLC group, showed that participants in the
highest tertile of dietary cholesterol change increased consumption from 1 to 2 whole eggs
per day. This occurred in the context of substantial reductions in both sugars and refined
grains in this group. We certainly know that refined grains and sugars may have their own
effects on blood lipids, particularly on post-prandial triglycerides, and potential knock-on
effects for LDL particle size (7). Did the reduction in refined grains and sugars attenuate the
effects of profoundly increasing dietary cholesterol intake by 401mg/d in the highest HLC
tertile? Maybe. While this finding is interesting, unfortunately it is a secondary outcome in a
post-hoc secondary analysis, meaning that there is no further analysis to determine whether
the change in refined grain and sugar intake was associated with change in LDL-C levels.
Figure from the paper illustrating the change in egg consumption at each data collection
point in the study in, from left to right, the lowest, middle, and highest tertile change in
dietary cholesterol.
10 www.alineanutrition.comFigure from the paper illustrating the change in sugar consumption at each data
collection point in the study in, from left to right, the lowest, middle, and highest tertile
change in dietary cholesterol.
www.alineanutrition.com 11Relevance
The primary finding of the present secondary analysis is that a range of substantial changes in
dietary cholesterol intake of up to 401mg/d did not correlated with changes in LDL-C or other
blood lipid biomarkers. The r -value from the Pearson’s correlation analysis [-1 is a perfect
negative correlation, 0 is no correlation at all, and 1 is a perfect positive correlation] for the
change in dietary cholesterol on the HLC diet was r = 0.04, and on r = 0.09 on the HLF diet. Per
100mg/d increase in dietary cholesterol, there was no significant change in LDL-C levels.
What to make of this, in light of the expected differences in blood lipid levels from differences
in dietary cholesterol intake?
The first point is that these studies attempt to determine effects of dietary cholesterol
independent of other variables, which does not necessarily reflect the fact that the effect of
dietary cholesterol is mostly dependent on other variables. Secondly, despite their sophisticated
analyses, they are not immune from methodological issues. Remember that for analyses like
these, the output data reflects the input data. The Vincent et al. (5) meta-regression was based
on the reported variation in effect of dietary cholesterol on blood cholesterol in the primary
included studies, but the variance is going to be influenced by the type of exposure and
comparison in the primary study. For example, the primary studies included:
• A comparison between lean red meat and white meat in free living healthy subjects
[Arch Intern Med. 1999;159(12):1331-8.]
• 2 eggs per day in subjects with elevated blood cholesterol
[J Am Coll Nutr. 1997;16(6):551-61.]
• The effects of different forms and levels of hydrogenated fats
[N Engl J Med. 1999;340(25):1933-40.]
• The effects of 20% of energy from walnuts
[N Engl J Med. 1993;328(9):603-7.]
Thus, the variance itself was likely influenced by the substantial differences in primary
interventions, and even adjusting for different fat types etc. in the ultimate analysis doesn’t
change the fact that, to quote Sander Greenland; “No statistical technique can compensate for
fundamental limitations of the input data.”
The meta-analysis of metabolic ward studies by Clarke et al. (4) and predicted effects from
dietary cholesterol were derived from isocaloric interventions, with no change in total energy
intake or body weight. Thus, the effect of changing dietary cholesterol by 200mg/d was
predicted to lower LDL-C by 0.13mmol/L [5.01mg/dL] without changes in energy intake. We
could then expect that the energy deficit in the DIETFITS study and related weight loss would
lead to more reductions in LDL-C, on top of changes in dietary cholesterol.
So, what of weight loss? This is important, because the HLC and HLF groups lost 6.3kg and 5.6kg
of body weight, respectively, over 12-months. In the analysis in the present study, change in
body weight did not predict the changes in LDL-C associated with each 100mg/d increase in
dietary cholesterol. The magnitude of change in LDL-C remains divorced from expected changes
12 www.alineanutrition.comfrom either reductions in body weight, changes in dietary cholesterol, or a combination of
both. Consider the HLF tertile which achieved the lowest reduction in dietary cholesterol of
265mg/d; this group lowered energy intake by 723kcal/d, saturated fat by 19g/d, bodyweight
by 7kg. If we were to just sum up the expected change in LDL-C from dietary cholesterol,
saturated fat, and bodyweight [there are no predictions for total energy], this would roughly
equate to an expected decrease in LDL-C of 0.45mmol/L [17.4mg/dL]. Although potentially
confounded by the energy deficit, this would likely be expected to enhance the reduction in
LDL-C. Yet, this group experienced a decline in LDL-C of a mere 0.10mmol/L [3.9mg/dL].
Consider that both the lowest tertile of the HLC group [102mg/d decrease in dietary cholesterol]
and the middle tertile [112mg/d increase] exhibited an identical change in LDL-C levels. While
the bodyweight changes and change in saturated fat were different between these tertiles,
the analysis indicated that neither of these factors correlated with changes in LDL-C. The
Vincent et al. regression predictions would suggest that LDL-C should have increased by
0.44mmol/L [18.08mg/dL] in the highest tertile, highlighting the discord between the isolated
dietary cholesterol predictive changes and the effects of multiple dietary variables in a whole
dietary pattern.
Another recent meta-regression analysis confined included studies to controlled feeding
studies where the ratio of saturated to polyunsaturated fats [the‘P:S ratio’] was matched in
both intervention and control groups; there was no significant association observed between
dietary cholesterol ranges of 155 to 828mg/d and LDL-C (8). Clarke et al. showed that the
impact of various types of fat on total blood cholesterol were observed with either over or
under 300mg/d dietary cholesterol intake, although dietary cholesterol was nonetheless
shown to have an impact on increasing LDL-C. This was Ancel Keys’insight: that with these
other variables in the mix - energy, saturated fat, polyunsaturated fat, bodyweight - the effects
of dietary cholesterol were likely to be relatively negligible (2,9).
We also know that there are substantial inter-individual variations in blood cholesterol levels,
and the response of blood cholesterol to dietary cholesterol [influenced strongly by variation
in absorption] (10). Future research should focus more on elucidating the factors influencing
such inter-individual differences, rather than deriving crude predictive estimates of effects
which may have no translational relevance to free-living, whole-diet contexts.
The predictive changes from the Clarke et al. and Vincent et al. analyses are often cited as
providing biological plausibility for the observational studies which show an increase in risk
associated with dietary cholesterol and/or eggs. However, this may be an over-simplistic
extrapolation given the ambiguous associations for both exposures and health outcomes at
the population level (8,11,12). It assumes that the predictive effect size holds true invariantly
from absolute changes in dietary cholesterol, which is an unsustainable assumption given
that LDL-C responses to dietary cholesterol may largely be independent of the absolute levels
of dietary cholesterol intake. The present study also indicates a disconnect in the predicted
changes in LDL-C from dietary cholesterol, particularly because it would be presumed that
weight loss may have an additive effect. We are left to assume that weight loss and a modest
energy deficit almost entirely attenuates any correlations between substantial increases in
dietary cholesterol and effects on blood lipid levels, in particular LDL-C.
www.alineanutrition.com 13Application to Practice
There isn’t a question in nutrition science to which I bow more in epistemic humility than
dietary cholesterol and health effects. I remain far from persuaded that in isolation from the
P:S ratio, fibre, and other related factors, dietary cholesterol poses any considerable risk for
cardiovascular health. Yet I remain unpersuaded that it does not. The present study invites to
conclude that in the context of a healthy dietary pattern and energy deficit, large changes in
dietary cholesterol are not correlated with changes in LDL-C, and indeed that such changes
that were observed must be explained by factors other than changes in dietary cholesterol. As
a secondary analysis, we are not left with many answers as to what those other factors could
be. This was Keys’s understanding. I appreciate my ambiguity on this topic may be frustrating.
If I had to make a call, I would be inclined to think that at levels of dietary cholesterol habitually
consumed in the population [~References
1. Keys A, Anderson JT, Grande F. PREDICTION OF SERUM-CHOLESTEROL RESPONSES OF MAN
TO CHANGES IN FATS IN THE DIET. Lancet. 1957;Nov 16(73(7003)):959=966.
2. Keys A. Human Atherosclerosis and the Diet. Circulation. 1958;V(January):115–9.
3. Hegsted MD, Ausman LM, Johnson JA, Dallal GE. Fat and Serum Lipids: Am J Clin Nutr.
1993;57(6):875–83.
4. Clarke R, Frost C, Collins R, Appleby PN, Peto R. Dietary lipids and blood cholesterol:
quantitative meta-analysis of metabolic ward studies. BMJ. 1997;314:112–7.
5. Vincent MJ, Allen B, Palacios OM, Haber LT, Maki KC. Meta-regression analysis of the effects
of dietary cholesterol intake on LDL and HDL cholesterol. Am J Clin Nutr. 2019;109(1):7–16.
6. Mach F, Baigent C, Catapano AL, Koskinas KC, Casula M, Badimon L, et al. 2019 ESC/
EAS Guidelines for the management of dyslipidaemias: Lipid modification to reduce
cardiovascular risk. Eur Heart J. 2020;41(1):111–88.
7. Umpleby AM, Shojaee-Moradie F, Fielding B, Li X, Marino A, Alsini N, et al. Impact of liver fat
on the differential partitioning of hepatic triacylglycerol into VLDL subclasses on high and
low sugar diets. Clin Sci. 2017;131(21):2561–73.
8. Carson JAS, Lichtenstein AH, Anderson CAM, Appel LJ, Kris-Etherton PM, Meyer KA, et al.
Dietary cholesterol and cardiovascular risk: A science advisory from the American heart
association. Circulation. 2020;E39–53.
9. Keys A. The diet and the development of coronary heart disease. J Chronic Dis. 1956;4(4):364–
80.
10. Sehayek E, Nath C, Heinemann T, McGee M, Seidman CE, Samuel P, et al. U-shape relationship
between change in dietary cholesterol absorption and plasma lipoprotein responsiveness
and evidence for extreme interindividual variation in dietary cholesterol absorption in
humans. J Lipid Res [Internet]. 1998;39(12):2415–22. v
11. Zhuang P, Wu F, Mao L, Zhu F, Zhang Y, Chen X, et al. Egg and cholesterol consumption and
mortality from cardiovascular and different causes in the United States: A populationbased
cohort study. PLoS Med [Internet]. 2021;18(2):1–23.
12. Key TJ, Appleby PN, Bradbury KE, Sweeting M, Wood A, Johansson I, et al. Consumption
of Meat, Fish, Dairy Products, and Eggs and Risk of Ischemic Heart Disease: A Prospective
Study of 7198 Incident Cases among 409 885 Participants in the Pan-European EPIC Cohort.
Circulation. 2019;139(25):2835–45.
www.alineanutrition.com 15You can also read