2020/2021 AUTOMOTIVE LOGISTICS RESEARCH REPORT - Ports ...
←
→
Page content transcription
If your browser does not render page correctly, please read the page content below

AUTOMOTIVE LOGISTICS RESEARCH REPORT
 A project completed by the Economic Regulation department of the Ports Regulator of
South Africa. The intention of this project is to obtain a detailed view on the automotive
                    logistics chain with a focus on maritime logistics.

                                2020/2021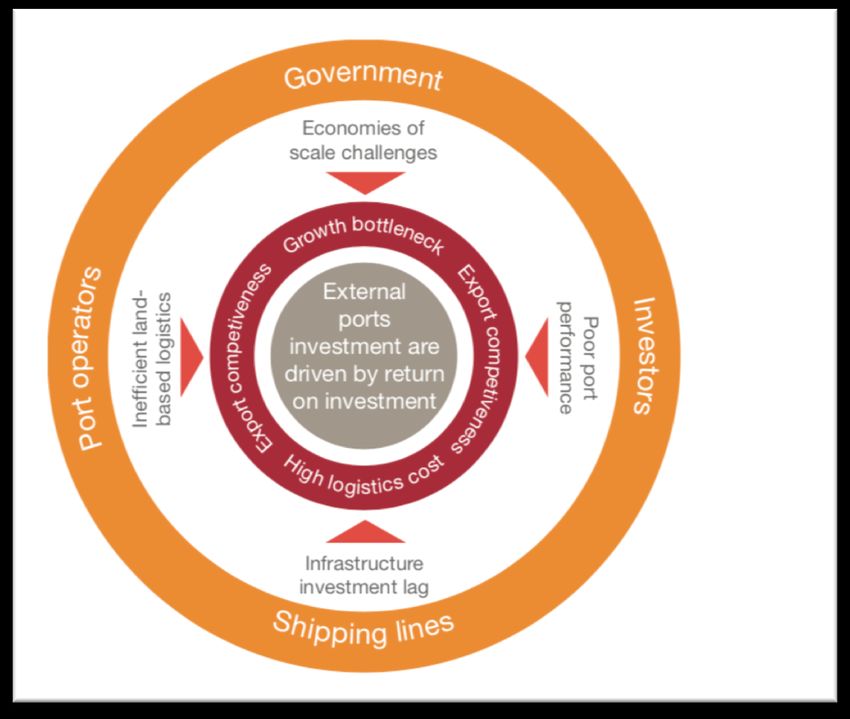
Contents

1.    Executive Summary ............................................................................................................................4

2.    Background .........................................................................................................................................6

3.    Purpose...............................................................................................................................................6

4.    Introduction........................................................................................................................................7

5.    Industry Overview ..............................................................................................................................8

6.    History of the Sector........................................................................................................................ 12

7.    The South African Automotive Masterplan ..................................................................................... 18

8.    Port Infrastructure ........................................................................................................................... 24

9.    Port Infrastructure Capacity Analysis .............................................................................................. 25

10.   Capacity Utilization: Supply and Demand for Port Infrastructure Mismatch .................................. 26

11.   Port Tariffs ....................................................................................................................................... 28

12.   The Impact of Logistics Costs on Competitiveness .......................................................................... 31

13.   Port Efficiency .................................................................................................................................. 32

14.   Impact of COVID-19 On the Automotive Sector .............................................................................. 35

15.   COVID 19: Government Support and Intervention.......................................................................... 37

16.   Limitations ....................................................................................................................................... 39

17.   Confidentiality ................................................................................................................................. 39

18.   Conclusion ....................................................................................................................................... 40

                                                                 Page 2 of 45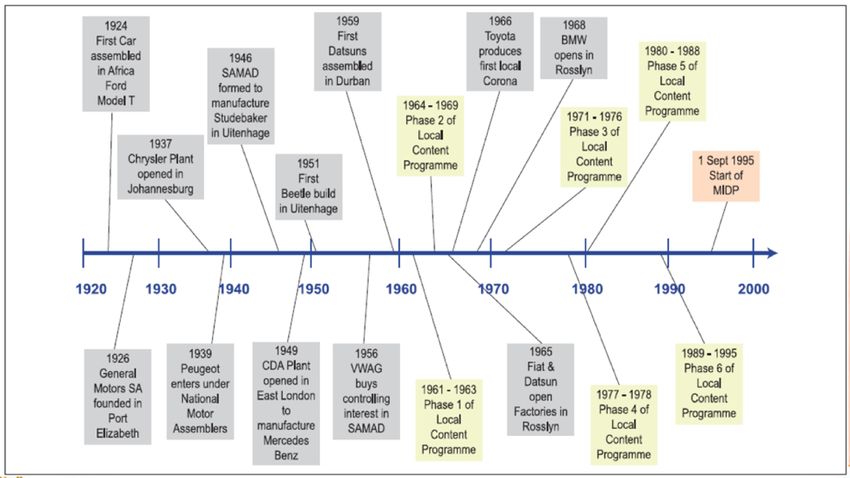
Table of Figures

Figure 1: Value Addition Breakdown of Global and SA automotive supply chains (Source: Barnes, 2014)............ 9
Figure 2: Automotive Clusters in SA (Source: AutomotiveExportManual, 2020).................................................. 10
Figure 3: Timeline of Automotive Industry in SA .................................................................................................. 12
Figure 4: Structure of the APDP (Source: thedti, 2003) ........................................................................................ 14
Figure 5: Breakdown of Local Content within Component Supply to six of SA's seven OEMs, Jan - March 2017
(Source: CCRED. 2017) .......................................................................................................................................... 16
Figure 6: SAAM 2035 Vision, Objectives & Strategic Focus Areas (Source: thedti, 2017) .................................... 18
Figure 7: SA Port Ro-Ro Cargo Distribution........................................................................................................... 24
Figure 8: Ro-Ro Vessel Calls per Port .................................................................................................................... 24
Figure 9: SA Port Ro-Ro Volumes .......................................................................................................................... 24
Figure 10: Determinants of Maritime Charges ..................................................................................................... 28
Figure 11: Tariff Indices over the Regulatory Period ............................................................................................ 29
Figure 12: Tariffs over the Regulatory Period ....................................................................................................... 29
Figure 13: GPCS 2019/20 Automotive Total Cost ................................................................................................. 30
Figure 14: GPCS 2019 Automotive Cargo Dues ..................................................................................................... 30
Figure 15: Hypothesis for Port Efficiency (Source: Benchmark and Competitive Analysis of Port Performance
Model: Algeciras Bay, Rotterdam, New York-New Jersey, Tangier Med (Babounia & Imian, 2018)) ................... 32
Figure 16: Shortcomings of African Ports as proposed by PWC (Source: PWC, 2018).......................................... 33
Figure 17: SA Top 10 Vehicle Export Markets by Volumes, 2019 (Source: Deloitte, 2020) .................................. 35
Figure 18: Impact of COVID-19 on Automotive Value Chain (Source: India Times, 2020) .................................... 37

 Table of Tables

Table 1: SA Automotive Industry Role Players (Source: AIEC 2020 & ITAC 2020) ................................................ 11
Table 2: Summary Outline of the MIDP and the APDP (Source: BMA Intelligent Systems, 2016) ........................ 14
Table 3: SWOT Analysis of the Domestic Industry (Source: Barnes, 2016) ........................................................... 17
Table 4: The Development Objectives of SAAM and its Interventions (Source: thedtic, 2019)............................ 19
Table 5: Comparison between APDP and APDP Phase II (Source: thedti) ............................................................ 22
Table 6: Ro-Ro Characteristics Summary at SA Ports (Source: Transnet, 2021) ................................................... 26
Table 7: Contribution of Port Costs to Vehicle TdC Value (Source: NAAMSA & PRSA Calculations) .................... 31

                                                                       Page 3 of 45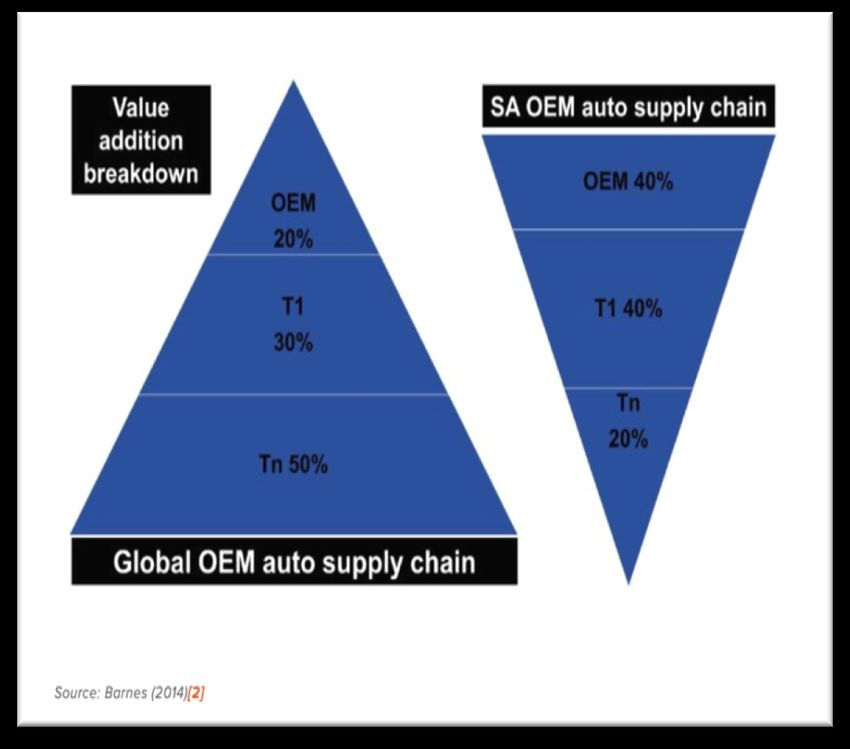
1. Executive Summary

The automotive sector in South Africa (SA) plays a large role in both the economy and numerous cities
and ports have been sustained through this industry. Although the domestic automotive industry is
considered to be a small player in global market, producing approximately 0.69% of total global
manufacturing output, it is a significant contributor to total manufacturing output, exports, employment
creation, and gross domestic product (GDP). Contributing approximately 6.4% to annual GDP, employing
approximately 112 000 employees, and contributing 15.5% of the total South African export value; it is
evident that the contribution of this sector cannot be ignored.

Further, from a port tariff perspective, port tariffs only contribute less than 4% of total delivered costs
for a vehicle. However, the importance of the sector, and the narrow margins as a result of the
international competition between plants results in every little bit counting. It is therefore important
that the industry should be considered as key role players in the SA ports system. Especially as it requires
specialised infrastructure to handle Ro-Ro cargo and vessels.

The SA automotive value chain is currently largely concentrated around seven Original Equipment
Manufacturers (OEM) (i.e. vehicle assemblers) and their Tier 1 suppliers, with Tier 2 and 3 activity
significantly underdeveloped. A large share of the components required for domestically assembled
models are imported and local content levels have remained stagnant over time, at just below 40%
(thetic, 2020). Manufacturing operations are centered around five provinces, namely the Eastern Cape,
Gauteng, Western Cape, and Kwa-Zulu Natal, however the Western Cape’s contribution to total industry
output remains insignificant.

The industry has enjoyed extensive Government support through various initiatives since early 1920;
with local content driving the earlier industry incentives. The participation of SA in the World Trade
Organization (WTO), and the introduction of the General Accepted Terms of Trade (GATT) Agreement
saw the abolishment of local content requirements across WTO member states changing the structure
of incentives afforded to the industry. The introduction the Motor Industry Development Programme
(“MIDP”) and later the Automotive Production Development Programme (“APDP”) shifted the focus from
local content requirements to export and production-based incentives. Under the latter programmes,
manufacturers earn benefits and incentives based on manufacturing output and exports. Although the
latter programme, the APDP, has resulted in a significant growth in manufacturing output, improved
exports, and the diversification of the components in the domestic’s market; manufacturing output fell
short of the targeted 1.2 million vehicle production target as set by National Government. Additionally,
local content remained stagnant at 38% in 2020. The development of the South African Automotive
Masterplan (“SAAM”), aims to address the challenges of the existing programme and further aims to
grow vehicle production to 1% of global output by 2035.

The domestic industry is export driven, exporting vehicles and components to 151 destinations globally,
and is highly dependent on an efficient and cost-effective logistics value chain. Manufacturing output is
mainly transported using road, rail and sea; but is highly dependent on the efficiency and cost

                                               Page 4 of 45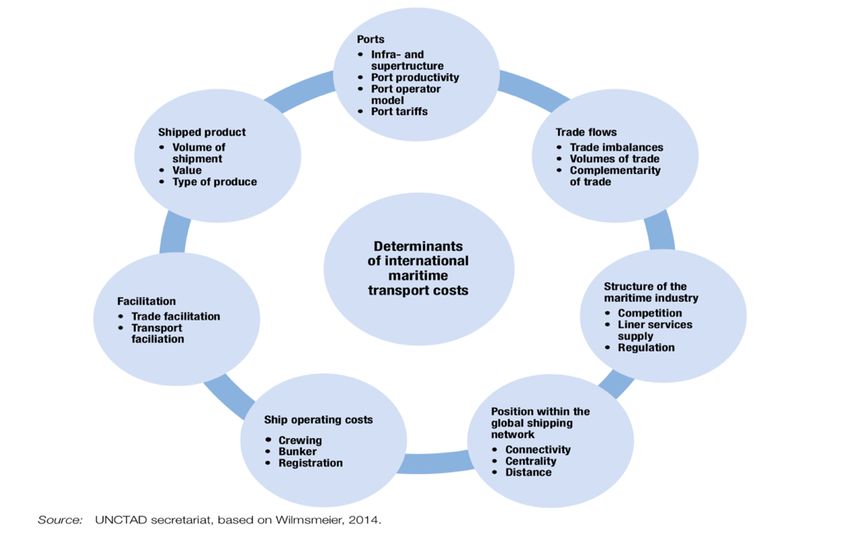
effectiveness of our ports to remain competitively globally. Automotives are handled through four SA
ports namely, Durban, Port Elizabeth, East London, and Mossel Bay through dedicated Ro-Ro terminals.

Although port infrastructure is available to support international trade, various challenges exist within
our ports; with historic and current port tariffs above the global sample average and port efficiency
significantly below the global average. It has become evident that a greater effort is required to remove
the barriers of trade which exist within the port system and to support international trade. Since the
introduction of the Tariff Strategy (“the Strategy”) by the Ports Regulator (“the PRSA / the Regulator”) in
2015, port tariffs for Ro-Ro have significantly declined and volume discounts applicable to certain OEMs
have been removed. Although there is still a discrepancy between current tariffs compared to the global
sample average as calculated by the Regulator; the contribution and importance of economic regulation
of the ports cannot be ignored. The long-term impact of the Strategy will see tariffs converge to a cost-
reflective tariff as depicted by the Strategy.

The National Port Development Framework developed by the Authority, further aims to address the
existing inefficiencies within the port system and increase port capacity in line with forecasted volume
demand by 2035. Further, additional plans to invest in rail infrastructure by Transnet Freight Rail (“TFR”),
will play a crucial role in the improving the efficiency of the ports through reduced inland transportation
tariffs and reduce port congestion.

The Covid-19 pandemic has had a negative impact on manufacturing output and exports for the
automotive industry. The consequence of the lockdown resulted in restrictions of trade, the halting of
manufacturing operations, the halting of all maritime services, and the closure of all ports of entry. For
the automotive sector it can be said that the effect of the covid-19 pandemic was felt prior to the
shutdown of the SA economy; with many of its trading partners having introduced lockdown restrictions
months prior to SA’s lockdown in March 2020. Not only was the export of motor vehicles and
components severely affected; the sourcing of inputs used in the manufacturing process was severely
affected as well.

The resumption of manufacturing operations, on 01 May 2020, provided relief to the industry however,
OEM’s could not operate at 100% capacity due to COVID-19 social distancing requirements. With firms
not operating at the optimal capacity to achieve economies of scale combined with a depressed vehicle
market, it was imminent that employment would be affected. OEM’s were forced to retrench workers
amidst cashflow, and liquidity concerns and expansion plans were held-off. Although the industry has
since seen significant improvements in vehicle and component sales since the reopening of economies
across the world, the automotive industry remains under severe strain. However, the overall economic
impact of the pandemic on the industry will be revealed once industry performance data for 2020 has
been released. The pandemic effects have been forecasted to have long term effect on all stakeholders
across the value chain ranging from shortage of raw materials, shifting of production to other countries,
liquidity crunch to delays in availability of models, deferred launches, and shrinkage in consumer
demand.

                                                 Page 5 of 45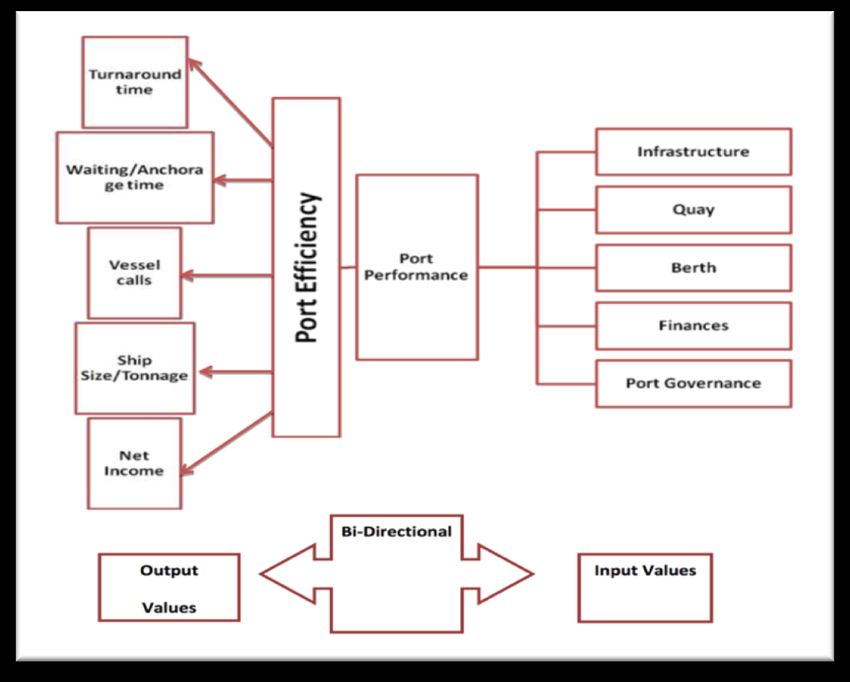
2. Background

The South African model used in the ownership and management of the country’s port system is that of
a ‘landlord model’. The National Ports Authority (the NPA), as a division of Transnet Ltd, is the owner
and landlord of all nine ports in South Africa, through the National Ports Act, 12 of 2005. In 2007, through
the promulgation of the same Act, the Ports Regulator of South Africa (the Regulator) was established as
‘an independent ports regulatory body’ (S29 of the Act), with a mandate to, amongst others, ‘exercise
economic regulation of the ports system in line with government’s objectives’ ((S30)(1)(a)).

In 2015, the Regulator published the first version of the Tariff Strategy, a long-term vision for the South
African ports system. In 2019, this Strategy was updated in terms of cost allocations and advancements
already made. The guiding principles and rules have however, remained the same.

In order to fully understand the extent of the effects of regulation, as well as to ensure effective
regulation going forward, the Regulator must understand the various industries and their specific
challenges. As set out in the Regulator’s Strategic Plan for 2020/21 – 2024/25, the Economic Regulation
department will conduct one logistics research report per annum on a specific industry within the
maritime sector. The focus of the 2020/21 research has been set as the Automotive Industry.

3. Purpose

The purpose of the Automotive Logistics Research project is to gain an in-depth understanding of the
automotive sector within South Africa. This includes an understanding of the overall logistics chain, and
how the port, and its effective and efficient functioning (both working efficiency and tariffs) plays a role
therein.

An understanding of the history of the sector, the logistics chain, the major players, the effect of
international economies as well as imports and exports, as well as the trajectory of the sector should
contribute to ensuring that regulation thereof is effective and aiding to the industry.

The Automotive sector in South Africa plays a large role in the employment sector, and numerous cities
and ports have been built / sustained through this industry. The Regulator is committed to economic
regulation which is in line with Governments objectives and the long-term success of the country as well
as ultimately regulating to lower the overall cost of doing business in South Africa.

                                               Page 6 of 45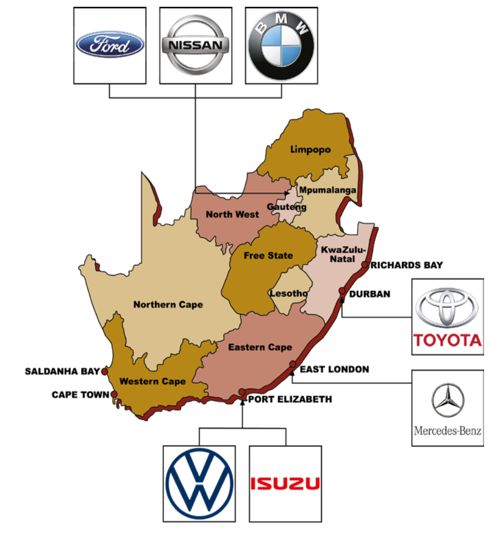
4. Introduction

SA’s manufacturing industries vary across commodities and include steel, clothing, chemicals, forestry,
agro-processing, and automotive. The sectors are all subject to legislation and localisation requirements
of some form in order to effectively contribute to the economy. To ignore the integration of supply chains
when understanding an industry would be a mistake and may lead to serious, unintended consequences.

The SA ports system is but a component in the larger logistics chain of production and all decisions which
affect a part, subsequently affect the whole. The purpose of this research project is to gain an
understanding of the automotive sector within SA, its contribution to the economy, the support received
from the State, as well as the extent that ports affect the supply chain process. The research is intended
to form part of the internal body of knowledge of the Regulator in order to arrive at more effective
regulatory decisions in the future. This includes an understanding of the overall logistics chain, and how
the port, and its effective and efficient functioning (both working efficiency and tariffs) plays a role
therein.

                                              Page 7 of 45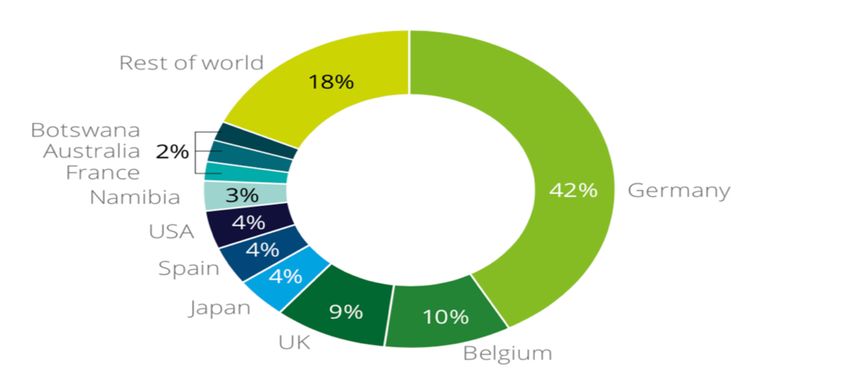
5. Industry Overview

Globally, developed economy markets have experienced limited vehicle demand growth but continue to
consume ever-more technologically advanced vehicles conforming to enhanced environmental, safety
and connectivity standards. This is while emerging economies consume an ever-greater number of less
technologically advanced vehicles at a substantially lower average unit value.

While developed economic markets continue to lead the development of the global automotive industry
in terms of technology, safety, and environmental standards, the future growth of the industry is likely
to be strongly driven by emerging and middle-income markets.

The national automotive economies that appear to have experienced a significant growth trajectory over
the last few years are China, India, Mexico, Thailand, Turkey, Slovakia, and Morocco, while those that
have experienced the most severe contractions include Australia and Brazil.

In respect of the comparator findings of the overview of the global automotive sector by thedti during
the automotive masterplan process in 2014; it was noted that the most successful economies had
implemented automotive policies that had increased their attractiveness to multinational automotive
producers through a twin-focus on deepening market access opportunities (domestically, regionally and
internationally) and advancing their asset capabilities (advanced production and product capabilities).

Local production is therefore being driven less by local or regional market factors, which underpin the
competitive advantage being secured by almost all the country’s competitor economies: most notably
Thailand (LCVs), Morocco (entry level passenger vehicles), Turkey (small LCVs, medium sized passenger
vehicles, and M&HCVs), Brazil (small passenger vehicles), and “new” EU economies such as Slovakia and
Hungary (small passenger vehicles), but rather a focus on international competitiveness.

Globally, electric mobility is growing at a rapid pace with 2,21 million vehicles sold in 2019. The growth
of electric vehicles is largely driven by government policy such as public procurement programs, financial
incentives, tightened fuel-economy standards and regulation on the emission of local pollutants. The
United Kingdom has banned the circulation of internal combustion engines from 2030.

Regionally, the development of a competitive automotive sector in Africa has been faced with many
hindrances, with only South Africa and Morocco being successfully industrialized. The African Association
of Automotive Manufacturers (AAAM) attributes the following factors as contributors to the lack of
development of a competitive automotive industry in Africa (AAAM,2020):

    -   Low demand of new vehicles;
    -   Grey imports make up more than 80% of vehicle sales on the continent;
    -   Poor infrastructure and high logistics costs which does not support a competitive value chain;
    -   Poor fuel quality which does not conform to internationally recognized standards;
    -   High reliance on the export of high-volume models to countries outside the continent; and
    -   A plethora of fragmented, small automotive production facilities on the continent as a result of
        ineffective automotive policies.

                                              Page 8 of 45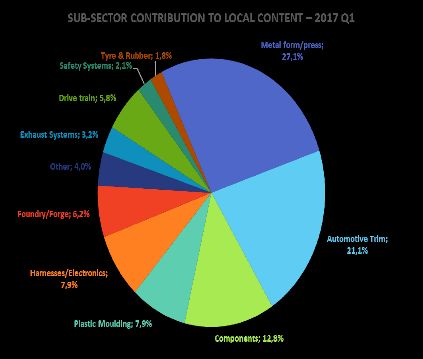
However, substantial work has been conducted in recent years by various African countries such as
Ghana, Kenya, Egypt, Rwanda, Algeria and Nigeria to develop an automotive pact ‘’The Pan African Auto
Pact”. which aims to systematically grow new vehicle demand and value addition in the African
economies, through substantially expanding vehicle assembly, automotive component production and
value chain services on the continent (AAAM, 2020).

When positioning SA within the global scale in terms of contribution and ranking, it may be considered
as a marginally light vehicle player with its current 0,68% global production contribution and 0,69% global
consumption market share (OICA 2016). As an automotive producer, the economy holds second tier
status, with the industry being ranked 26th for passenger vehicle production, and 15th for light
commercial vehicle production in 2019.

For instance, at 615 658 units of total vehicle production in 2015, SA is a relatively insignificant producer
compared to the world’s Tier 1 automotive producers, which each manufactures more than 1,5 million
vehicles annually. The same applies in respect to Medium and Heavy Commercial Vehicles, SA produced
only 0,9% of all heavy trucks globally in 2015, and 0,4% of all buses and coaches.

The SA automotive value chain is currently largely concentrated around OEMs (original equipment
manufacturers i.e. vehicle assemblers) and their Tier 1 suppliers, with Tier 2 and 3 activity significantly
underdeveloped (Centre for Competition, Regulation and Economic Development (CCRED, 2018). A large
share of the components required for domestically assembled models are imported and local content
levels have remained stagnant at just below 40% (thedtic, 2020). It is in this regard that port tariffs start
to play a more significant role.

The M&HCV sector comprises a set of Semi-Knocked Down (SKD) -type assembly operations, with
pockets of significant value addition in bus
assembly and the related yellow metals assembly
industry. Further, there is no domestic motorcycle
production, with the local market of 21 000 units
so small that it is highly unlikely to support even
the most basic local motorcycle assembly.

Domestic componentry manufacturing operations
are mainly centered on the manufacturing of
automotive products with low value addition such
as pressed parts as opposed to powertrains and
telematics. Empirical studies show that for a
country to improve its manufacturing capabilities
and increase the level of local content within a
value chain, firms must upgrade from low value
                                                               Figure 1: Value Addition Breakdown of Global and SA
and productivity products to high value and high        automotive supply chains (Source: Barnes, 2014)
productivity products (UNECA, 2016; ADBG, 2017; Chang, 2003).

                                                Page 9 of 45
While the South African automotive industry is reasonably small on a global scale, it is a critical part of
the domestic economy, with its contribution to GDP (including multipliers) estimated at 6,4% in 2019.
This is inclusive of retail and aftermarket repair activities, although the manufacturing contribution
represents most of this amount. In 2019, 631 983 vehicles were produced domestically, with 387 125
vehicles exported to 151 countries. Total industry employment was recorded at approximately 110 250
employees in 2019. The export value of vehicles and automotive components comprised a record R201,7
billion, equating to 15,5% of South Africa’s total exports (Automotive Export Manual, 2020).
The interests of the industry are represented by the industry bodies with NAAMSA, the National
Association of Automobile Manufacturers of South Africa, representing vehicle assemblers’ and
independent vehicle importers and the National Association of Automotive Component and Allied
Manufacturers (“NAACAM”) representing component manufacturers. Various other industry bodies
exist such as Automotive Industry Development Centre (“AIDC”), the Durban Automotive Cluster
(“DAC”), and the Industrial Development Corporation (“IDC”).
The industry enjoys a strong relationship with Government which is considered crucial to its success and
long-term sustainability, as well as its ability to grow the manufacturing sector. In most economies,
strong relationships exist between governments and automotive industry who are inter-dependent on
each other, for improving overall economic activity and job creation, and for improving industry viability.
Figure 2: Automotive Clusters in SA (Source:
AutomotiveExportManual, 2020)
Page 10 of 45The major industry players are strategically situated across the country in close proximity to the ports in
KZN, and the Eastern Cape. The additional players are situated in the Gauteng region with a small number
of component manufacturers located in the Western Cape. Table 1 below lists the industry’s role players.
Table 1: SA Automotive Industry Role Players (Source: AIEC 2020 & ITAC 2020)
Category Gauteng Kwa-Zulu Natal Eastern Cape Western Cape
Light motor vehicles - BMW SA - Toyota SA Motors - Volkswagen Group No vehicle
(OEMs) - Nissan SA SA manufacturers
- Ford Motor - Mercedes-Benz SA of LMV
Company of - Isuzu Motors SA
Southern Africa Ford Motor
Company of
Southern Africa
engine plant
Medium, heavy and - Babcock - Bell Equipment, - Faw Trucks No vehicle
commercial vehicles - Eicher Trucks - MAN Truck & Bus - Isuzu Motors manufacturers
(MHCVs) and yellow - Fiat Group - Toyota (Hino) - Mercedes-Benz SA of MHCVs
metals - Ford (Freightliner and
- Hyundai Fuso) Volkswagen
Automotive Group SA
- Iveco
- JMC
- MAN Truck & Bus
MarcoPolo
- Peugeot Citroen
- Powerstar
- Scania
- Tata Trucks
- Volvo Group
Southern Africa
Number of automotive 200 80 150 18
component companies
Page 11 of 456. History of the Sector
Local content has been a critical element of determining the success of the automotive industry. From
the early 1900s, countries have introduced local content requirements (LRC’s) or thresholds as a means
of promoting the development and growth of the industry. Throughout, vehicle assemblers were forced
to achieve set targets in order to receive incentive support from the State.
SA’s Industrial Policy Action Plan (“IPAP”) identifies local content as a strategic industrial policy
instrument to leverage the power of public procurement; address market failures, increase international
competitiveness, foster infant industries and increase the government’s tax base (the ditc, 2016).
In promoting the development of the automotive industry, SA initially followed a programme of import
substitution similar to that adopted in other developing countries. High tariffs and prospects of market
growth acted as a magnet to a large number of foreign firms establishing plants in the country.
Nearing its 100th anniversary mark, the automotive industry in SA has a long and rich history which
began in the Eastern Cape city of Port Elizabeth. In 1926, the first General Motors SA plant was founded
in P.E and ten years later, the first Chrysler Plant opened in Johannesburg. Since then, the sector has
expanded its footprint to three major regions within South Africa and has grown to house more than
seven manufacturing houses, including Mercedes Benz, BMW, VW, and Toyota.
According to the Department of Trade and Industry, the industry was first supported through an official
programme in 1961, known as the Local Content Programme, which was implemented over six phases
up until the period 1995. These Programmes saw the rapid increase of local content reaching
approximately 52% by mass by 1971. In later phases, the local content requirement (on a mass basis)
was raised to 66%. By late 1986, there were seven assemblers producing over twenty basic model
variants for a market of only 172 000 passenger cars. These low volumes meant that the industry was
uncompetitive. Exports were minimal but there had been substantial development of a domestic
supplier industry (Black, 1994; Duncan, 1997). Figure 2 below illustrates the history of the automotive
industry in South Africa.
Figure 3: Timeline of Automotive Industry in SA
(Source: http://www.thedtic.gov.za/wp-content/uploads/Automotives.pdf)
Page 12 of 45The strategic shift from an inward looking strategy to an export oriented strategy in late 1995, the
introduction of the Motor Industry Development Programme (MIDP) and later the Automotive Production
Development Programme (APDP) in 2013, saw the abolishment of Local Content Requirements, the
subsequent reduction of protection for the domestic industry, the increase in imported components and the
stifling of local content from 66% in 1982 to 38,7% in 2015. These incentives were mainly rebate incentives
adopting an export-import complementation strategy which promoted one model mass vehicle production
whilst granting assembler’s credit to offset duties of models not domestically manufactured. It is argued that
the early localization programmes, introduced in the 1960’s ,were coupled with various multiplier effects in
the form of increased employment, technological advancements, and the development of a low volume
components industry oriented towards the production of heavier components such as body pressings
(Bhanini and Black, 2006).
The successor of the MIDP, the APDP, evolved from an export-based incentive to a local manufacturing
incentive, regardless of whether the motor vehicles were being sold locally or abroad. The existing incentive
programme consists of four elements namely Stable Tariffs, The Production Incentive, the Automotive
Investment Scheme, and the Volume Assembly Allowance. The key objectives behind the APDP are no
different from MIDP in that the following concerns are still primarily in place namely to:
- Improve the international competitiveness of the automotive industry;
- Continue to encourage overall production growth and improve the industry’s current trade
imbalance by optimizing export levels, while at the same time encouraging a greater usage of
domestically manufactured products as part of the South African auto value chain;
- Stabilize and potentially increase employment levels;
- Encourage the rationalization of platforms so as to achieve economies of scale in assembly;
and
- Encourage further capital investment into South Africa.
However different from the MIDP, the APDP incorporated two crucial objectives namely:
- Increase vehicle production to 1.2 million vehicles per annum. This saw the introduction an
additional incentive for vehicle assemblers through the Volume Assembly Allowance (VAA) which
provides additional credits based on the number of units produced; and
- Deepening and diversifying the automotive component supply chain (thedtic, 2013).
Page 13 of 45Import Vehicle Automotive
Production
Duty Assembly Investment
Incentive
Allowance Scheme
Duty Rebates Cash Grant
Figure 4: Structure of the APDP (Source: thedti, 2003)
The table below represents a summary outline of the APDP and the MIDP based on the pillars of the two
programmes:
Table 2: Summary Outline of the MIDP and the APDP (Source: BMA Intelligent Systems, 2016)
MIDP (1995-2012) APDP (2013-2020)
Customs Tariffs The level of protection offered by customs The level of protection offered by
tariffs reduced consistently from 65% and tariffs remains constant at 25% and
49% for CBUs and CKDs respectively in 20% for CBUs and CKDs respectively
1995, to 25% and 20% in 2012. from 2013 to 2020.
Local OEMs vehicle Duty Free Allowance: 27% of the local VAA (Volume Assembly Allowance):
Allowance assembled vehicle’s wholesale price is 20-18% of local assembled vehicles
rebated against duty payable on imported wholesale price is rebated against the
components that are used in the duty payable on imported
production of vehicles deemed for the components that are used in the
domestic market production of vehicles provided that
at least 50 000 units are produced per
annum.
Industry Incentives Export linked duty credits earned: Market neutral Production Incentive:
benefits calculated on local material used Benefit calculated on local production
value add. Vulnerable industries
receive higher benefits.
Page 14 of 45Investment Assistance (PAA) Production Asset Allowance: AIS (Automotive Investment
- Benefits limited to OEMs and 1st tier Scheme):
suppliers whose investment is linked - Benefits OEMS and auto
to a local OEM components suppliers for auto
- 20% benefit, payable over 5 years. focused investments
- 20-30% benefit payable over 3
years.
The 2013 mid-term review saw the revision of the 1,2 million units target to approximately 800 000 units
by 2020 and a revision of the minimum participation threshold of 50 000 units over four rolling quarters
for VAA to 10 000 units with the VAA percentage of 10% increasing by 1% for every 5 000 unit. The policy
maker was off the view that the 50 000-unit requirement served as a barrier to entry and served as a
hindrance to attracting new investment to access grants from the Automotive Investment Scheme (“AIS”)
(thedtic, 2013).
Black, Barnes and Monaco (2018) found that the structure of the APDP policy encouraged uneconomic
investments, resulted in the rapid growth in imports and has created no incentive for domestic
manufacturers to operate in the domestic market and has significantly rendered the use of tariffs as a
meaningful industrial policy inefficient. The adoption of the export-import complementation strategy is
identified as a key contributor to the policy distortions.
Thwala (2018) found that that current policy support to the automotive industry is inadequate to achieve
the objectives of the APDP and encourage the localization of components. He attributes his findings mainly
to the exclusion of component manufacturers producing components for online fitment and second and
third tier suppliers from benefiting under the production incentive and the absence of an incentive, similar
to the VAA, for component manufacturers to grow production volumes and achieve economies of scale
(Thwala, D, 2018). The reduction in the general rate of duty for CBU and components under the programme
and the reduction in the minimum VAA volume participation requirement in the 2015 APDP mid-term
review do not aim to serve as an incentive to prioritize investment to increase plant capacity and improve
efficiency.
According to the Centre for Competition Regulation and Economic Regulation (CCRED, 2018) “A highly
contested issue in the development of the automotive sector both in South Africa and other developing
countries has been the level of local content in domestically assembled vehicles”. Additionally, the
bargaining power of the Multi-National Companies ensured that it remained relatively easy to import
vehicles and parts into the South African market whilst offsetting almost all duties (Barnes et al, 2017). The
recently developed 2035 South African Automotive Masterplan (SAAM) sets an objective of 60% local
content, a substantial increase on the level of 38% currently achieved. It remains to be seen how this can
be achieved in a policy environment which provides little protection for the component sector”.
Page 15 of 45Empirical studies show that for a country to improve its manufacturing capabilities and create linkages
within a value chain, firms must upgrade from low value and productivity products to high value and high
productivity products (UNECA, 2016; ADBG, 2017; Chang, 2003). This supports the argument by Black,
Barnes and Monaco (2018) that supplier development and increased local content will not be achieved if
production is segmented amongst products that constitute declining shares of automotive values addition
as opposed to high value components (Black, Barnes and Monaco ,2018; Barnes, Kaplinsky and Morris,
2003).
Figure 5: Breakdown of Local Content within Component Supply to six of SA's seven OEMs, Jan -
March 2017 (Source: CCRED. 2017)
According to the Centre for Competition, Regulation and Economic Development (“CCRED”) “The
competitiveness challenge confronting the South African automotive industry extends beyond measures
of operational effectiveness. A key issue relates to the cost effectiveness of South African production.
According to OEMs interviewed in 2017, South African vehicle production is between 10% and 25% more
expensive than the lowest cost production bases which range from India, to China, Mexico, Thailand, and
Turkey” (Black, Barnes and Monaco, 2018).
Despite the challenges facing the SA automotive industry, it remains a core focus of the national
government’s industrialization strategy for the domestic economy. In 2016, a study was facilitated by B&M
Analysts to review the current APDP. The identified opportunities and challenges facing the local
automotive industry have been summarised as follows:
Page 16 of 45Table 3: SWOT Analysis of the Domestic Industry (Source: Barnes, 2016)
STRENGTHS AND OPPORTUNITIES WEAKNESSES AND THREATS
National government’s targeted support e.g., The local industry remains a marginal player
APDP. globally contributing a current 0.68% of global
production
The Sub-Saharan African market growth. The significant decline in local content to below
40%.
Demonstrated production capabilities across a Growing low-cost competition in domestic,
range of vehicle and component product regional and broader international markets.
categories.
The strong presence of multinational firms Deteriorating and increasingly expensive
resulting in fully integrated local industry within industrial infrastructure.
global chains.
A functioning industrial infrastructure. Reluctance to comply with transformation
requirements.
An established OEM presence in South Africa Labour relations instability.
(with substantial sunk capital).
Page 17 of 457. The South African Automotive Masterplan
Reporting to the Minister of Trade, Industry and Competition and a select group of industry stakeholders,
consultants were appointed to lead the process on behalf of Government in April 2016. In addition, the
consultants were tasked with developing an automotive policy framework post-2020 that aligned with
the masterplan’s vision and objectives, with both the masterplan and the policy recommendations to be
subjected to extensive stakeholder scrutiny and engagement prior to finalisation. Following five phases
of intensive activity, the project commenced in April 2016 and concluded in May 2017. Phase 4 and 5 of
the project were considered the most crucial, with Phase 4 culminating in the development of the South
African Automotive Masterplan (SAAM, completed November 2016) and Phase 5 the policy
recommendations to support the realization of the SAAM. The policy recommendations were endorsed
by Cabinet in November 2018.
The SAAM’s 2035 vision is the achievement of “a globally competitive and transformed industry that
actively contributes to the sustainable development of South Africa’s productive economy, creating
prosperity for industry stakeholders and broader society.”
This vision essentially has four components namely global competitiveness, industry transformation,
sustainable development, and societal contribution which together represent the aspirational heart of
SAAM’s vision.
The first component relates to the enhancement of the domestic industry’s competitive position by
2035. The second component relates to the industry’s contribution to the transformation of the SA
economy which encompasses multiple elements including employment equity and the greater inclusion
of black-owned firms within the automotive value chain. The third component relates to the sustainable
development of the economy. The critical elements encompassed within this component relate to the
growth of the industry, employment created, skills developed, and the improved environmental impact
of products and production processes. The final component relates to the shared prosperity created by
the industry, with the critical
elements here comprising the
financial health and wellbeing of
firms within the value chain, fair
employee remuneration, and the
broader contribution of the value
chain to the South African fiscus.
Figure 6 below summarizes the
vision, objectives and the strategic
focus areas of the SAAM.
Figure 6: SAAM 2035 Vision, Objectives & Strategic Focus Areas (Source:
thedti, 2017)
Page 18 of 45Furthermore, in order to realise the automotive industry’s vision for 2035, six key development objectives
were identified. The realisation of these six, mutually reinforcing objectives are projected to have a
fundamentally transformative impact on the position of the industry, and for the private sector, government,
organised labour, and broader society, all likely to benefit substantially from their attainment. Table 4 below
represents the development objectives and the proposed interventions to achieve the development
objectives.
Table 4: The Development Objectives of SAAM and its Interventions (Source: thedtic, 2019)
Objectives Areas of Intervention
Grow SA vehicle production - Grow demand of domestic market to support vehicle production objective of
to 1% of global output 1.4 million vehicles by 2035
- Potential for local manufacturers to capture a substantially greater portion of
the South African vehicle market than is presently the case.
- Development of regional market. Establishment of a regional automotive
trade and production block that positions South Saharan Africa as a viable
automotive space.
Increase local content in SA - Improve South Africa’s factor cost profile (overheads, labour, and materials
assembled vehicles to 60% costs) and productivity, along with the economy’s ability to ensure technology
and skills availability ahead of industry demand.
- The creation of targeted specialization within the automotive value chain such
as drivetrains and engines,
- And the potential to strategically link South Africa’s materials base with
emerging automotive opportunities.
Double employment in the - increase demand for locally produced components and CBU,
automotive value chain - regional market development,
- targeted specialization within the automotive value chain,
- support the transformation of the country’s dealership network and
authorized vehicle repair facilities
Improve industry - secure environment comprising advanced logistical linkages and associated
competitiveness levels to transport infrastructure (land, air, sea); efficient industrial parks (factory
that of leading international infrastructure, along with required energy, water, and other amenities); and
competitors ready access to semi-skilled labour, as well as more advanced administration,
artisan, and professionally skilled staff
- prioritize employee education and skills development thereby ensuring that
technical and advanced management skills are transferred into the South
African economy
- Develop a technology and associated skills development roadmap to support
the evolution of the industry in alignment with each of the key SAAM elements
identified.
- Deployment of new production technologies in South Africa. These may
require new types of industrial infrastructure that need to be understood and
responded to, to ensure South Africa does not fall too far behind the
automotive technology frontier, and that domestic production continues to
Page 19 of 45qualify for supply into developed economy markets with ever-more
demanding environmental requirements that are likely to represent new
forms of Non-Trade Barriers in future.
Achieve transformation of - Industry must broadly represent the demographic profile of South African
the South African society (in terms of race, gender, and physical abilities), with this evident
automotive value chain across the full spectrum of automotive industry employment categories,
including artisans, professionals, management, and executives.
- support the transformation of the country’s dealership network and
authorized vehicle repair facilities through to 2035.
Deepen value addition - Develop a discreet set of automotive-linked materials supply in alignment
within SA automotive value with the evolution of new automotive technologies. These materials, including
chains Platinum Group Metals, aluminum, and certain grades of steel, represent core
areas of potential sustained competitive advantage for the South African
automotive industry.
- Advance base South African capabilities across core materials in support of
automotive industry requirements through to 2035.
The objective of phase two of the APDP is support the vision of the South African Automotive Masterplan of
creating a “globally competitive and transformed automotive industry that actively contributes to the
sustainable development of South Africa’s productive economy, creating prosperity for industry stakeholders
and broader society”. The key focal point of the amendments is to ensure the APDP benefits earned are
correlated with industry localization levels, and hence industry employment aggregates.
The objectives of this Programme are summarized as follows:
- Grow SA vehicle production to 1% of global production by 2035 (1.4 million vehicles per annum);
- Increase local content in SA manufactured vehicles to 60% (from 39% in 2015);
- Double automotive employment in the supply chain (from 110 000 to 224 000);
- Improve automotive industry competitiveness levels to that of leading international competitors;
- Transformation of the SA automotive value chain; and
- Deepen value-addition within SA automotive value chains.
The following amendments to the post- 2020 programme were endorsed by Cabinet:
- The introduction of a level 4 broad black-based economic empowerment (B-BBEE) requirements for
APDP participants to be phased-in from 2021;
- The inclusion of motorcycle components as qualifying products under the APDP (excluding fully-built
motorcycles);
- Maintain CBU and CKD tariffs at 20% and 25% respectively;
Page 20 of 45- The replacement of the Volume Assembly Allowance (VAA) with the Volume Assembly Localization
Allowance (VALA), which will be implemented on a phased basis over the period 2021 to 2026 to
protect existing OEM model investments in South Africa. VALA will be based on local value addition
and not on manufacturing sales value.
- The replacement of Production Rebate Credit Certificates (PRCC’s) to Duty Credits to ensure that
components earn one benefit value tied to local value addition.
- The removal of the vulnerable status benefits under the Production Incentive (PI); and
The reduction of the Automotive Investment Scheme (AIS) grant by 5 per cent. The AIS-2 provides for a non-
taxable reimbursable cash grant of fifteen to twenty-five percent (15%-25%) of the value of qualifying
investment in productive assets.
Page 21 of 45The Table below, shows the comparison between the current APDP and APDP Phase 2 key elements.
Table 5: Comparison between APDP and APDP Phase II (Source: thedti)
APDP (2013-2020) APDP 2 (2021-2026)
Tariffs The level of protection offered by tariffs remains The level of protection offered by tariffs remains
constant at 25% and 20% for CBUs and CKDs constant at 25% and 20% for CBUs and CKDs
respectively from 2013 to 2020. respectively from 20121 to 2026.
Local OEMs vehicle VAA (Volume Assembly Allowance): Volume Assembly Localisation Allowance
Allowance 20-18% of local assembled vehicles wholesale price is (VALA):
rebated against the duty payable on imported VALA is based on local value-addition and not
components that are used in the production of manufacturing sales value. VALA is set at 35% of
vehicles provided that at least 50 000 units are local value add for OEMs above 10 000 units
produced per annum. produced annually per plant from 2026.
Transition is set at 40% in 2021 and will reduce
annually to 35% by 2026.
Industry Incentives Production Incentive (PI): Production Incentive (PI):
- Benefit calculated on local production value - Production incentive benefit factor
add. In 2013, the PI conversion factor started at increased to 25% (was 20%) for
55% of the designated local value addition, components (representing an increase
which was reduced progressively by 1% annually from 10% to 12,5% of value-addition).
to 50%, in the form of duty-free import credits. - Duty credits to replace Production Rebate
- The equivalent value is the incentive multiplied Credit Certificates (PRCCs).
by the component/vehicle duty rate, so this - Removal of vulnerable status benefits].
represented from 5% to 11% (on components)
of value-added in 2013 and was reduced to 4%
to 10% by 2018.
- “vulnerable products” which earned higher
benefits receiving a PI of 80% in 2013 and 2014,
reduced thereafter by 5% annually to 50% in
2020, with the exception of catalytic converters,
which remained at 65%.
- The incentive is calculated through the supply
chain and is earned by the end-user, which is
the OEM, or, in the case of component exports
or replacement parts, the component
manufacturer.
Page 22 of 45Investment AIS (Automotive Investment Scheme): AIS (Automotive Investment Scheme):
Assistance - The AIS provides for a non-taxable cash grant of - Maintain cash grant for investment,
20% of the value of qualifying investment in reducing by 5% if not locally manufactured
productive assets by light motor vehicle tooling or machinery.
manufacturers manufacturing 50 000 units - Reduction of base grant by 5%.
annually, and increased support of 25% of the - The AIS2 provides for a non-taxable cash
value of qualifying investment in productive grant of 15% of the value of qualifying
assets by component manufacturers and tooling investment in productive assets by light
companies. motor vehicle manufacturers,
- In addition, by achieving certain performance manufacturing 10 000 units annually, and
objectives, companies will be able to earn an increased support of 20% of the value of
additional 5% or 10%. This support is available qualifying investment in productive assets
to encourage investments by OEMs and by component manufacturers and tooling
component manufacturers in a manner that companies.
supports productive capacity upgrading. - Inclusion of motorcycle components and
- 20-30% benefit payable over 3 years. motorcycle under AIS
- Inclusion of electric vehicles and fuel cell
vehicles above 2 000 units per annum
- 15%-25% payable over 3 years.
Page 23 of 458. Port Infrastructure
Automotives are handled through four SA ports namely, Port of Durban, Port of Port Elizabeth, Port of
East London, and the Port of Mossel Bay through dedicated Ro-Ro terminals currently operated by
Transnet Port Terminals, a division of Transnet SOC Ltd (‘’Transnet”) at multi-purpose terminals (as in
the case of Mossel Bay).
The terminal facilities include access to the ro-ro vessel through ramps, storage facilities, as well as
dedicated access and transfer facilities to the OEM plants. These ports are utilised for their strategic
location to manufacturing sites for efficient logistics purposes.
With an average of 474 067 units per annum, the Port of Durban handles the majority of ro-ro cargo in
South Africa, servicing OEMs with manufacturing plants in the Gauteng and Kwa-Zulu- Natal provinces
and independent importers mainly for the import and export of motor vehicles and automotive
components.
The Port of East London and the Port of Port Elizabeth handle volumes similar to each other with an
average of 104 293 units going through East London, and an average of 129 446 units going through Port
Elizabeth. These ports mainly service Mercedes-Benz
P.E.
South Africa in East London and Isuzu Motors South Africa 26%
and Volkswagen South Africa in Port Elizabeth.
Although vessel calls in the Port of P.E have decreased over
Dbn
the period, the volumes being handled by the port have 56%
steadily increased; the same can be said for the Port of E.L.
18%
Durban. A phenomenon which may be attributed to the
growing sizes of vessels.
Figure 7: SA Port Ro-Ro Cargo Distribution
600 000
400
500 000
400 000 300
300 000 200
200 000
100
100 000
- -
P.E. E.L. Dbn P.E. E.L. Dbn
2015/16 2016/17 2017/18 2018/19 2019/20 2015/16 2016/17 2017/18 2018/19 2019/20
Figure 9: SA Port Ro-Ro Volumes Figure 8: Ro-Ro Vessel Calls per Port
Page 24 of 45The automotive industry is not limited to the sales of manufactured vehicles, or merely the import and
export thereof. The export of automotive components and automotive tooling, not shipped in ro-ro
vessels, but through other mediums which include containers, equate to a large percentage of the
country’s export trade. According to NAAMSA (2020, pg. 5), “The export value of vehicles and automotive
components comprised a record R201,7 billion, equating to 15,5% of South Africa’s total exports. A
record 387 125 vehicles worth a record R148,0 billion, along with a record R53,7 billion in automotive
components, were exported to 151 countries in 2019.”
9. Port Infrastructure Capacity Analysis
Port of Durban
Located in the Cato Creek precinct at the Port of Durban, five berths are dedicated to servicing ro-ro
vessels, namely berths F, G, M, R, & Q. The berth draft ranges from 10,1m to 10,6m and the largest vessel
that can be accommodated is 26 300 DWT.
Ro-Ro infrastructure at the port has an installed capacity of 520 000 units and a design capacity of 900
000 units. Receiving an average of 358 vessel calls per annum, ro-ro vessels make up 10% of the total
vessels calling at the Port. When comparing the number vessel calls and the overall ro-ro volumes
handled over a five-year period, one notes a declining trend in the number of vessel calls and an increase
in the roro volumes handled over the period.
Port of Elizabeth
Located at the Charles Malan Quay, Berth 100, and Berth 101 are dedicated to the handling of ro-ro
cargo. With a depth of 11m and a length of 358m, the Port can accommodate vessels up to 240m in
length. Occupying a terminal area of 168 220m2. the Port has an installed capacity of 24 000 units and a
design capacity of 410 000 units.
Receiving an average of 134 vessel calls per annum, the Port has noted a decline of 26% in vessel calls
over the period 2015/16 – 2019/20, With ro-ro vessels making up 16% of the total vessels calling at the
Port.
Although recording declining vessel calls over the five-year period; the Port of PE has recorded an
increase in ro-ro volumes.
Port of East London
Located at the Car Terminal, Berths N and R, are dredged between depths of 8,5m to 10,2m and a total
berth length of 549m. Occupying a terminal area of 121 653m2, the Port has an installed capacity of 163
200 units and a design capacity of 790 000 units. The automotive industry in the Port of East London
utilises 28% of port land through its operations and contributes 27% of the real estate revenue collected
by the Authority in the Port. Mercedes Benz is contracted through a lease with the NPA and is equipped
with a dedicated road linking the OEM to the Port.
The Table below illustrates some characteristics of the Ro-Ro facilities at the three ports.
Page 25 of 45Table 6: Ro-Ro Characteristics Summary at SA Ports (Source: Transnet, 2021)
Port of Port Elizabeth Port of Durban Port of East London
Installed Capacity 150 000 528 000 139 000
Average Ro-Ro Vessel
134 358 117
Calls per Annum
Number of Berths 2 3 2
Terminal Area 121 653 m2 26 420 m2
Container Capacity 40 000 TEU 3.6 million TEU 90 000 TEU
Estimated Roro-Ro
82% 85% 75%
Capacity Utilization
10. Capacity Utilization: Supply and Demand for Port Infrastructure Mismatch
With reference to SAAM’s main objective of increasing vehicle production to 1% of global output by 2035
and the drive to promote the sale and export of vehicles within the African continent, it remains doubtful
as to whether SA ports will be able to effectively handle the increased volumes without experiencing a
deterioration in operational efficiency when comparing projected voulmes with the existing installed
capacity within the three ports. However when comparing projected volumes in relation to the SAAM
with the design capacity of the three ports, it was found that existing infrastructure is insufficient to
support the vision of the SAAM. With the average capacity utilization for the three ports currently
estimated at 81%, the Authority will be able to meet long-term demand with the existing port
infrastructure and further support the recent capacity investments by the various OEMs such as MBSA,
TSAM, and VWSA, and the introduction of new vehicle models and domestic OEMs such at Baic and
Haval. The existing capacity utilization estimation was based on the number of vehicles exported in 2019
based on data provided the the Automotive Export Manual of 2019 and excluded imported vehicles.
The IPAP 2018/2019 lists port charges, port inefficiencies, and lack of policy cohesion as significant
barriers on export value-add goods and industrial development and state that “economic infrastructure
blockages limit the country’s economic development, thus impeding industrial development and
competitiveness” (thedtic, 2019). With BMWSA already exporting 20% of its vehicles through the Port of
Maputo in order the improve both competitiveness and efficiency, there is a need to align the sector
specific masterplans of the DTIC and the infrastructure investment plans of the NPA to ensure that future
capacity demand by the various users are met. This concern was echoed by NAAMSA in their response
to the Authority’s Tariff Application for financial year 2020/2021 citing that currently “there is low level
of investment which can be directly linked to the automotive objectives which have been highlighted in
the masterplan’’.
Page 26 of 45You can also read