2020 CAISO Blackouts and Beyond - LSI Electric Power in the West Conference PRESENTED FOR - NET
←
→
Page content transcription
If your browser does not render page correctly, please read the page content below

2020 CAISO Blackouts and Beyond
THE FUTURE OF CALIFORNIA RESOURCE PLANNING

PRESENTED BY              PRESENTED FOR
Frank Graves              LSI Electric Power in
John Tsoukalis            the West Conference
Sophie Leamon

JANUARY 29, 2021
Agenda

I. CAISO Resource Adequacy Events of August 2020
II. California Wildfire Experience and Broader Resiliency Issues
III. Long-Term Resource Adequacy Challenges

                                                                   Brattle.com | 1
CAISO Resource Adequacy
Events of August 2020

Review of August 2020 Events

                         •   Two rolling blackout events, first on August 14th and then August 15th
                         •   Heat wave throughout the western U.S., constituting a 1-in-30 year
                             weather event
                         •   Peak load more than 3,000 MW below CAISO’s all-time peak (50,270
     System Conditions       MW in 2006) and the highest load in recent years (50,116 MW 2017)
     During the August   •   Rolling outages occurred after peak load on each day
     2020 California     •   Solar ramp down of more than 5,000 MW in 2 hours on each day
     Resource Adequacy   •   Wind output lower than expected each evening, with >1,000 MW
     Events                  unexpected ramp down of wind on August 15th
                         •   On both days, CAISO called for voluntary load reductions and
                             additional resource bids several hours prior to load shedding
                         •   CAISO initiated load shedding events in order to maintain 6%
                             operating reserves in compliance with WECC standards

                                                                                                      brattle.com | 3
Review of August 2020 Events

                                             CAISO Load Shedding Event, August 14, 2020

  The first load shedding
  evening occurred on
  August 14th at 6:38pm

  Outage Statistics, August 14th, 2020
  Start of Outage             6:38 p.m.
  Duration of Outage             2 hours
  MW of Outage                     1,000
  Customers Affected            491,600

  Assuming a $1-$2/kWh value of lost load (VOLL), the loss was approximately $2-$4 million

                                                                                          brattle.com | 4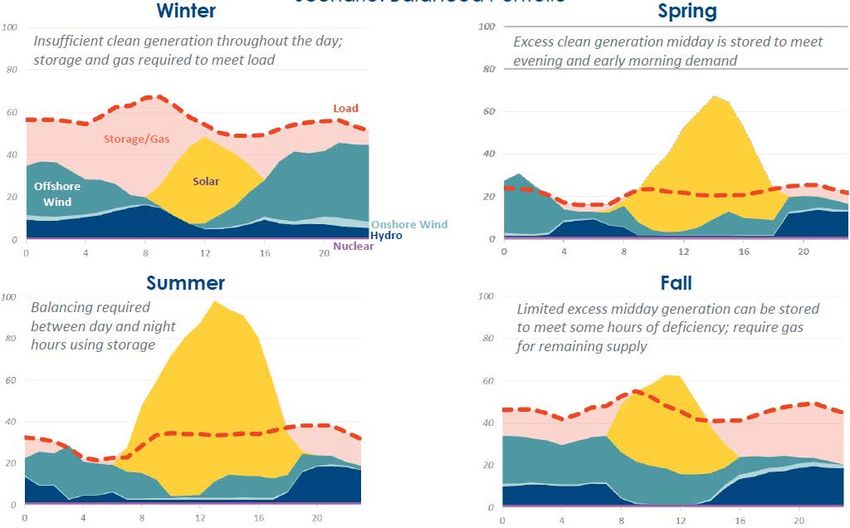
Review of August 2020 Events
       CAISO Load Shedding Event, August 15, 2020
                                                      The second load
                                                      shedding event began on
                                                      August 15th at 6:28pm,
                                                      lasting about 20 minutes

                                                      Outage Statistics, August 15th, 2020
                                                      Start of Outage             6:28 p.m.
                                                      Duration of Outage         20 minutes
                                                      MW of Outage                      500
                                                      Customers Affected            321,000

               Assuming a $1-$2/kWh VOLL, the loss was < $500,000

                                                                                              brattle.com | 5
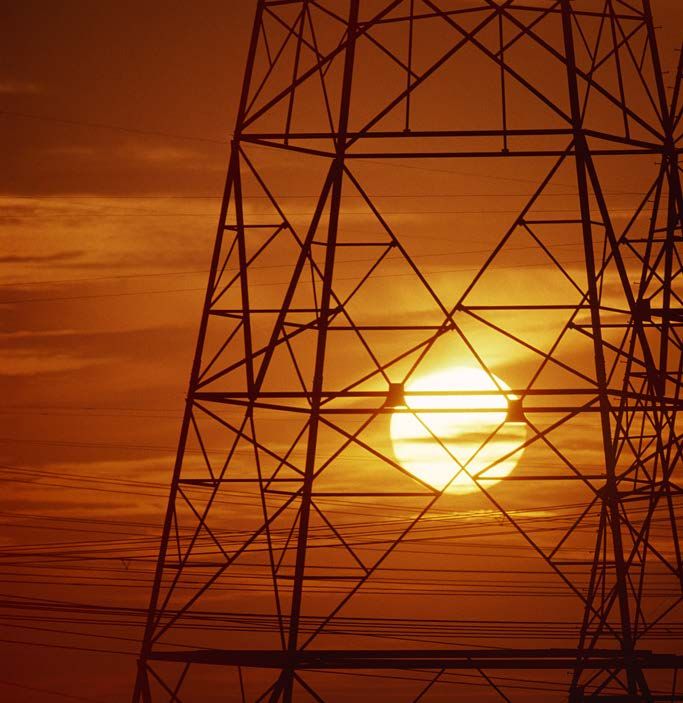
Historical Context for August 2020 Events
Customer’s Affected by California Blackouts (2001-2020)
The August 2020 events were the first RA
related load shedding events since 2001
January and March 2001 events affected about
2 million customers and lasted for weeks
– Largely the result of improper early market
design and supplier manipulations, not
resources adequacy
Public Safety Power Shutoffs (PSPS) outages
related to wildfire prevention have affected
over 3 million customers in the last two years
Note: Public Safety Power Shutoff (PSPS) events are implemented by utilities to help prevent wildfires
Estimates for 2001 RA events result from the sum of “several hundreds of thousands of customers”
affected January 17-18 (estimated at 300,000), 1.5 million customers affected on March 19-20, and
167,000 customers affected May 7-8, 2001 as reported by CNN, ABC and PBS. brattle.com | 6
Review of August 2020 Events
  CAISO’s Root Cause Analysis identified several issues responsible for the load
  shedding events

                                      •   Counting rules based on contribution to serving gross peak instead of net peak
          Resource Adequacy
                                      •   May not account for extreme temperature events caused by climate change
          Planning
                                      •   Potentially insufficient reserve margin of 15%
          Day-Ahead Market            •   Ineffective DA load scheduling, DA-RT price convergence due to virtual trading, and RUC
          Processes                       commitment process led to higher export volumes than the system could support
                                      •   Transmission capacity to Pacific NW de-rated by 650 MW, preventing the import of RA
                                          capacity from the region

          RA Resource                 •   Unplanned NG capacity outages of 475 MW on the 14th and unexpected ramp (due to
          Performance                     scheduling error) of 248 MW on the 15th
                                      •   650 MW of DR resources unavailable on the 14th, 820 MW on the 15th
                                      •   Solar and wind resources performed below procured RA capacity levels

Sources and Notes: CAISO, “Report on System and Market Conditions, Issues and Performance”
                                                                                                                                    brattle.com | 7
CPUC and CAISO Proposed Solutions

      Solutions being pursued                            •   Ongoing Review of Changes to Resource
      by CPUC and CAISO focus                                Adequacy Requirements
      on the reforming the                                    • CPUC initiated a rule making procedure and directed the
                                                                IOUs to procure additional resources for this summer
      Resource Adequacy                                       • CAISO recommends Planning Reserve Margin (PRM) apply
      requirements and Day-                                     to gross and net peak, and be increased to 17.5%
                                                                     Consistent with latest SCE IRP finding that 17.5% PRM will be
      Ahead market processes                                     o
                                                                     needed by 2026
      and rules
                                                         •   Review and Update CAISO Market Rules
                                                              • Improved load scheduling by LSEs
                                                              • Stakeholder processes recommended to discuss: RA
                                                                resource counting against net load, performance
                                                                incentives, market design enhancements

Sources and Notes: CAISO, “Report on System and Market Conditions, Issues and Performance”
                                                                                                                                     brattle.com | 8
Key Takeaways from August Resource Adequacy Events
The rolling blackouts of August 14th and 15th in CAISO illustrate some of the resource
adequacy challenges facing the power system as we transition to clean electricity
August events are the first resource adequacy events in California since 2001, which
frequency (rarity) is consistent with a 1-in-10 planning requirement
– The last major resource adequacy event in 2001 lasted more than 38 days combined and
affecting 2,000,000 customers
– Wildfire prevention outages have affected over 3,000,000 customers over the last 2 years
Coupled with recent wildfire-related outages, frustration with the rolling blackouts is
understandably high among California customers
The CAISO has proposed good solutions (though expensive) to shore up RA
Resource adequacy issues highlighted by August’s events are familiar and relatively easy
to address compared to emerging long-term issues facing the power system
brattle.com | 9The California Wildfire Experience
Recent Wildfires in California
California’s recent experience with wildfires highlights a larger long-term issue
for system planners everywhere – Resiliency and System Hardening
Acres Burnt in California by Year
California has lost ~2 million
4,500,000
acres/year in the last four years
4,000,000
3,500,000
4x increase over the prior 15 year Calfire Database
history of wildfires in California 3,000,000
Increase development in Wildland-
2,500,000
NIFC Database
Urban Interface (WUI), magnifies risks 2,000,000
of long transmission lines 1,500,000
CPUC reports that historically power 1,000,000
infrastructure has caused < 10% of fires 500,000
– However, several large fires recently have
0
been from caused by transmission lines
Sources: CalFire Incident Archives, accessed https://www.fire.ca.gov/incidents/2020/ and
National Interagency Fire Center (NIFC) Database, accessed
https://data-nifc.opendata.arcgis.com/datasets/historic-perimeters-combined-2000-2018 brattle.com | 11California Public Safety Power Shutoffs
Summary of PSPS Event Outages
A new disruption to power service is occurring
Number of Total Hours of Total Customers
Year
Outage Events Outage Affected due to Public Safety Power Shutoffs (PSPS),
2013 5 35 183 first approved in 2012 by the CPUC
2014 10 158 1,367 Guidelines for PSPS amended by new legislation in
2015 0 0 0 response to the devastating 2017 wildfire season
2016 0 0 0
2017 66 2,382 20,820 Utilities are responsible for monitoring wind conditions
2018 91 3,422 84,565 affecting their assets, and other weather conditions
2019 2,293 105,138 2,230,459 that increase or mitigate the risk of fire spread
2020 1,112 36,339 836,005
Utilities required to notify customers and public safety
Sources: California Public Utilities Commission (CPUC)
https://www.cpuc.ca.gov/deenergization/
officials ahead of any likely PSPS events
During and after the historically severe 2017 fire season
PSPS events increased dramatically
brattle.com | 12Response from California Utilities and Policymakers
PG&E Transmission and
90,000
PG&E allocated $3 billion to resiliency against wildfires Distribution Lines
– Undergrounding 4,000 miles of distribution lines (at a 80,000
cost of $800,000/mile*)
70,000
– While significant, the investment will affect ~5% of
PG&E distribution lines 60,000 Portion to be Undergrounded
with Allocated Funds
California AB 1054 created $21 billion to insure against
50,000
future wildfire-related costs (hopefully through 2030)
– Half funded by SCE, SDG&E, and PG&E, the rest by 40,000
ratepayers
30,000
New legislation introduced to provide $300 million for the
Forest Service and Department of Agriculture to conduct 20,000
controlled burns on federal, state, and private lands
10,000
Sources and Notes: In urban areas, Edison Electric Institute estimates this cost at up $1.5
0
million/mile. Edison Electric Institute, “Out of Sight, Out of Mind, An Updated Study on the
Undergrounding of Overhead Power Lines” Overhead Underground Overhead
Distribution Distribution Transmission
brattle.com | 13Parallel Experiences in other Regions of the U.S.
Resiliency is a growing concern across the
U.S., often creating far worse outages than RA Cost of Major Natural Disasters in the U.S.
problems $350
Hydrological
Cost of Major Natural Disasters ($ Billion)
“Once-in-a-century” disasters recently happening $300 Climatological
every few years: Meteorological
$250
– Superstorm Sandy, Hurricanes Harvey, Katrina, Ike, Rita, Overall Cost of Events
Laura all in the last 15 years $200
– Three “1-in-500-year” floods for Houston since 2005 2010-2020
$150 ($82B/yr)
– Increasing cold-weather events (blizzards, polar vortex)
– Wildfires becoming common outside of CA (Alaska, $100
2000-2009
Northwest, Rockies, and Southwest) 1980-1999 ($51B/yr)
$50 ($23B/yr)
Average annual cost of major natural disasters has increased
4x in 20 years to over $80 billion/year $0
1980 1990 2000 2010 2020
– Justifying significant investments in system resiliency Sources and Notes:
“Billion-Dollar Weather and Climate Disasters,” NOAA National Centers for Environmental Information (NCEI), accessed
January 2021, https://www.ncdc.noaa.gov/billions/time-series. See tab "NOAABillionDisasters".
The increase in losses may be due to a combination of heightened climate risk and increased concentration of property
value in at-risk areas. Both factors are also at play in California with regard to wildfires.
brattle.com | 14Meeting the Challenge of Improving System Resiliency
The power industry does not yet have an agreed planning or regulatory framework to
address system resiliency challenges
The problem is statistically very complex: risks are “Black Swan” events not easily measured (unlike resource
adequacy); very hard to predict where or how natural disasters will strike, but with severe economic consequences.
What is the right balance of money spent on system hardening vs. insurance and after-the-fact repairs?
– System hardening (e.g., undergrounding, redundant infrastructure, micro grids) is expensive.
– And commercial insurance for damages is increasingly limited and very costly: about $.30/$ for CA wildfires!
Should just affected ratepayers bear the cost of hardening and repairs, or will taxpayers (or customers in other
systems) chip in?
Who has authority to determine how and where funds are spent (utilities, system planners, regulators, or
policymakers)?
Creating an effective framework will require customers, system planners, utilities, policymakers, and
regulators to analyze and form consensus on several key challenges and open questions.
brattle.com | 15Emerging Long-Term Resource Adequacy Challenges
Evolving Resource Adequacy Challenges on a Decarbonized Grid
Economy-wide decarbonization further requires our industry to re-think
resource adequacy and system planning
Planning problem is fundamentally different: getting
Renewable sufficient clean energy with a viable time pattern to
Droughts match load and intermittency risks. Many new RA
challenges in a high renewables system:
Renewable droughts – multi-day periods without
significant wind or solar production
Changing Seasonal Resource Needs – wind and solar
Changing production are lower in winter months while electrification
Declining ELCCs
Seasonal is likely to increase winter peak load
of Renewables
Resource Needs Declining Effective Load Carrying Capability (ELCC) of
Renewables – higher adoption of wind and solar reduces
their ability to provide resource adequacy
brattle.com | 17Evolving System Design & Management Challenges on a Clean Grid
Average Hourly Generation Profile by Season
Brattle analysis of New
Seasonal storage
England’s economy-wide needed to shift
clean energy to
decarbonization policies winter
illustrates evolving
seasonal resource needs
• Huge ramping needs
Renewables and
storage adequate
• RE overbuilds plus storage on average summer
and spring days
and curtailments
• New clean dispatchable
techs become attractive
Source: Weiss, et al., “Achieving 80% GHG Reduction in New England by 2050,” September 2019, Accessed here.
brattle.com | 18Evolving System Design & Management Challenges on a Clean Grid
Brattle modeling for NYISO illustrates substantially declining RA value of renewables
and exposure to renewable droughts on a highly decarbonized system
Simulated NYISO 2040 Installed Capacity Declining Marginal Capacity Value of
to Meet 100% Clean Energy Standard Solar and Wind in NYISO
Summer Marginal Capacity Value Winter Marginal Capacity Value
Declining ELCCs requires
Nearly 3x ~48 GW of dispatchable high levels of ICAP to Offshore
ICAP is less than ~57 GW maintain reliability
Peak Load Wind
ICAP peak load, leaving
system exposed to Offshore
renewable droughts Wind
2040 Modeled
Peak Load Onshore
Solar Wind
Onshore Solar
Wind
Installed Capacity (MW) Installed Capacity (MW)
Source: Lueken, et al., “New York’s Evolution to a Zero Emission Power System,” May 2020, Accessed here.
Privilegd and Confidential. Prepared at the Request of Counsel. brattle.com | 19Increasing Cost of Resource Adequacy under Deep Decarbonization
System Costs for New England at Different Decarbonization Levels
Brattle model of New
England illustrates resource
adequacy is extremely
expensive on the margin at
decarbonization levels above
about 80%, if relying only on
solar, wind, and battery
storage
Lower-cost solutions likely include
other technologies: interregional
transmission, carbon capture and
storage, renewable natural gas,
Source: Graves, et al., “Clean Energy and Sustainability Accelerator,” January 14, 2021, accessed: hydrogen
https://brattlefiles.blob.core.windows.net/files/20809_clean_energy_and_sustainability_accelerator.pdf
brattle.com | 20Solution Elements to System Design & Management Challenges
Emerging Effective Retail Pricing & Direct & Smart
Technologies & Market Design Demand Side Load Control
Infrastructure & Pricing Management Measures
Interregional Scarcity Pricing in Greater Deployment System Control of
Transmission Shortage Conditions of Demand Response Water Heating &
Carbon Capture and Based on Value of Electric Vehicle HVAC
Storage Lost Load Managed Charging Coordinated EV
Green Hydrogen New Ancillary Services Load Shaping Charging and Dispatch
to Manage Ramping of Storage
Renewable Natural Variable Pricing
Needs
Gas
System planners, regulators, utilities, and customers will need to determine the correct balance between
deploying emerging technologies, relying on price signals to drive system behavior, and mandating control of
load and distributed resources
brattle.com | 21Final Thoughts and Takeaways
Emerging and Expanding Grid
Performance Challenges Increasingly difficult, but
addressable with existing
Resource solutions and frameworks
Adequacy
No framework yet exists to
prioritize solutions and
System Resiliency coordinate implementation
Integrated System Design & Size and scope of the challenge still
unknown; some potential solution
Management elements are emerging, but technology
costs and capabilities continue to evolve
brattle.com | 22Presented By
Frank Graves specializes in regulatory and financial economics,
especially for electric and gas utilities, and in litigation matters
related to securities litigation and risk management.
He has over 30 years of experience assisting utilities in forecasting,
valuation, and risk analysis of many kinds of long-range planning and
service design decisions, such as generation and network capacity
expansion, supply procurement and cost recovery mechanisms, network
flow modeling, renewable asset selection and contracting, and hedging
strategies. He has testified before the Federal Energy Regulatory
Frank Graves Commission (FERC) and many state regulatory commissions, as well as in
state and federal courts.
PRINCIPAL
BOSTON, MA
Frank.Graves@brattle.com
+1.617.864.7900
The views expressed in this presentation are strictly those of the presenter(s) and do not necessarily state or reflect the views of The Brattle Group or its clients.
brattle.com | 23Presented By
John Tsoukalis has broad experience helping clients respond to a
range of issues related to wholesale power markets. He is an expert
in electric market modeling, analyzing regional market
participation, transmission rate design, market design, detection of
market manipulation and damages analyses, and strategic planning.
Mr. Tsoukalis has assisted electric utilities, cooperatives, public power
authorities, transmission developers, generation owners, and power
traders. Mr. Tsoukalis has led numerous efforts in modeling the power
system to assess the benefits of participating in wholesale power markets,
John Tsoukalis value generation assets, and analyze the benefits of new transmission.
Among his transmission experience, Mr. Tsoukalis has assisted clients in
analyzing alternative transmission rate designs and led strategic planning
initiatives to help clients plan for the ongoing clean energy transition.
John.Tsoukalis@brattle.com
+1.202.955.5050
The views expressed in this presentation are strictly those of the presenter(s) and do not necessarily state or reflect the views of The Brattle Group or its clients.
brattle.com | 24About Brattle
The Brattle Group answers complex economic, finance, and regulatory questions for corporations, law firms,
and governments around the world. We are distinguished by the clarity of our insights and the credibility of
our experts, which include leading international academics and industry specialists. Brattle has over 350
talented professionals across three continents. For more information, please visit brattle.com.
Our Services Our People Our Insights
Research and Consulting Renowned Experts Thoughtful Analysis
Litigation and Support Global Teams Exceptional Quality
Expert Testimony Intellectual Rigor Clear Communication
brattle.com | 25Our Practices and Industries
ENERGY & UTILITIES
Competition & Market Manipulation Electrification & Growth Opportunities Gas/Electric Coordination
Distributed Energy Resources Energy Litigation Market Design
Electric Transmission Energy Storage Natural Gas & Petroleum
Electricity Market Modeling & Environmental Policy, Planning & Compliance Nuclear
Resource Planning Finance and Ratemaking Renewable & Alternative Energy
LITIGATION
Accounting Consumer Protection & False Mergers & Acquisitions Litigation
Alternative Investments Advertising Disputes Product Liability
Analysis of Market Manipulation Cryptocurrency and Digital Assets Regulatory Investigations & Enforcement
Antitrust/Competition Environmental Litigation & Regulation Securities Class Actions
Bankruptcy & Restructuring Intellectual Property Tax Controversy & Transfer Pricing
Big Data & Document Analytics International Arbitration Valuation
Commercial Damages International Trade White Collar Investigations & Litigation
INDUSTRIES
Electric Power Natural Gas & Petroleum Transportation
Financial Institutions Pharmaceuticals & Medical Devices Water
Infrastructure Telecommunications, Internet & Media
Brattle.com | 26Our Offices
BOSTON BRUSSELS CHICAGO LONDON
MADRID NEW YORK ROME SAN FRANCISCO
SYDNEY TORONTO WASHINGTON, DC
brattle.com | 27You can also read