4 Forecast of Aviation Demand - Port of Bellingham
←
→
Page content transcription
If your browser does not render page correctly, please read the page content below
November 27, 2017, 2017 Forecast of Aviation Demand 4 | 1
4 Forecast of Aviation Demand
4.1 Introduction
This master plan chapter presents forecasts of future aviation activity at the Bellingham International
Airport (BLI). Developing forecasts is a key step in the airport planning process and provide the basis
for determining the airport’s role in the larger aviation system and determining improvements to the
airfield, terminal facilities, apron areas, airside/landside access and parking facilities that may be
needed to accommodate growth in demand. These are then used to estimate potential environmental
effects, such as noise, of the airport’s operation on the surrounding community and to evaluate the
financial feasibility of alternative airport development proposals.
Aviation activity forecasts start with an analysis of past trends as well as an assessment of activity
forecasts prepared by others. Historically, BLI was the fastest growing airport in Washington State in
terms of commercial service from 2006 through 2013. The introduction of low-cost service as well as
increased travel destinations led to the development of a substantial passenger market that ranged
from southern British Columbia to the northern Puget Sound Region.
Forecasts that were prepared, both in the previous master plan and the FAA’s TAF reflected this
growth and showed an expectation of it continuing into the future, at a lesser rate. With the master plan
projecting growth to 1,145,989 annual passengers by the year 2013 (based on historical data through
2011).
Since a high of 595,074 enplaned passengers in 2013 however, the airport has experienced steady
decreases in passenger levels to 417,930 in 2016. This is primarily due to the fact that much of the
passenger growth at BLI was the result of a low price carrier offering service to resort destinations.
This attracted passengers from both Southeastern British Columbia and the Puget Sound Region.
Changes in border conditions, currency exchange rates and the introduction of low cost service at
Vancouver International Airport (YVR) have changed the demand levels. These decreases have several
explanations including;
Airline marketing and business plans have shifted at BLI.
Ticket-costs have increased at BLI.
Allegiant’s has shifted their marketing strategy, and
The regional operational environment has changed.
These factors point to the fact that the passenger levels at BLI are dependent on regional conditions
more so than local factors. Therefore, forecasts for BLI must consider regional factors such as
exchange rate, service changes at other regional airports and the local (Whatcom County)
socioeconomic environment.
From 2000 through 2011, the number and types of operations recorded at BLI reflected the change
seen in commercial service. As airlines such as Allegiant and Alaska increased service, the number of
annual air carrier flights increased. These flights typically carried high load factors ranging from 90% or
better on peak flights but lower yields for off peak or commuter flights.
Bellingham International Airport | Master Plan DRAFT
4 | 2 Forecast of Aviation Demand November 27, 2017
The air taxi/commuter category reflected the departure of United Express but stabilized somewhat as
Alaska Airlines (Horizon), West Isle Air, Rite Brothers, San Juan Airlines (merged with Northwest Sky
Ferry) and the air cargo flights that make up the base of these continue to provide service.
During the same period the number of annual operations by general aviation showed a steady
decrease, mostly in the local operations that are generally associated with training and all touch-and-
go activity. Military activity has remained a minor portion of the activity recorded at BLI consisting of
approximately 1,200 annual operations–most of which are itinerant. Table 4-1 shows the historic
operations data for BLI from 2004 through 2015.
Table 4-1: Historic Operations Data (CY)
Itinerant Local
Air Air General Total General Total Total
Year Carrier Taxi Aviation Military Itinerant Aviation Military Local Operations
2004 399 15,839 42,753 1,091 60,082 21,145 394 21,539 81,621
2005 898 15,471 42,950 1,214 60,533 21,093 474 21,567 82,100
2006 4,246 14,051 38,974 1,079 58,350 15,344 341 15,685 74,035
2007 4,638 17,780 34,327 798 57,543 16,305 426 16,731 74,274
2008 6,173 14,914 31,970 514 53,571 11,263 99 11,362 64,933
2009 6,446 13,188 32,416 608 52,658 14,712 228 14,940 67,598
2010 7,295 12,380 28,577 1,012 49,264 13,296 336 13,632 62,896
2011 8,471 11,502 28,440 862 49,275 19,702 457 20,159 69,434
2012 9,341 11,796 27,127 861 49,125 19,030 277 19,307 68,432
2013 9,908 11,123 28,079 742 49,852 15,941 587 16,528 66,380
2014 8,968 11,165 26,659 655 47,447 13,857 518 14,375 61,822
2015 7,301 11,428 28,758 820 48,307 16,175 1,403 17,578 65,885
Source: FAA Air Traffic Activity Systems (ATADS) Data
The background data used in preparing this forecast included the following sources;
Bellingham International Airport Master Plan (URS) – May 2015,
Airport management records,
Airport Traffic Control Tower (ATCT) records for BLI,
Bureau of Transportation Statistics T-100 Data for Domestic Operations,
The FAA Aerospace Forecast 2016-2036,
The Operations Network (OPSNET)data,
FAA Traffic Flow Management System Counts (TFMSC) data,
FAA Terminal Area Forecast (TAF) – 2015 through 2040.
The Boeing Company Current Market Outlook 2014-2033
Airbus General Market Forecast – Navigating the Future 2016-2035
IATA Air Passenger Forecasts Global Report April 2015
DRAFT Bellingham International Airport | Master PlanNovember 27, 2017, 2017 Forecast of Aviation Demand 4 | 3
Although these documents were not prepared at the same point in time nor have they used identical
baseline data strings or modelling assumptions, they do offer a perspective as to the thoughts of
industry experts as to the potential growth and development of aviation trends that could influence
activity at BLI over the next 20 years. What these documents show is that the aviation industry as a
whole is expected to continue to grow into the future despite the annual fluctuations experienced. The
purpose of this forecasting effort is to determine whether BLI will grow at the same rate.
4.2 Summary of Forecasts
Herein is a summary of the forecasting results developed for BLI using process described in FAA
Advisory Circular (AC) 150/5070-6B, Airport Master Plans. Enplaned passenger forecasts assumed the
following factors would influence future enplaned passenger levels.
2017 - 2021
Due to weakness in the Canadian exchange rate in relation to the US Dollar and labor issues
resulting from contracts negotiated, Allegiant Air has indicated that it will reduce seating capacity
at BLI by approximately 9 percent in 2017. This is assumed to result in a decrease in passengers by
9 percent.
BLI demand will decrease with the start of commercial air-service at Snohomish County
Airport/Paine Field (PAE) in 2018. This will be due to the fact that tickets are likely to be priced low
to attract initial customers, induce demand and “prove” the service. However, the capacity at PAE
has been established at 550,000 annual passengers over the long term so the impact of new
service will not be long-term. Although most of the passengers attracted to PAE are expected to
be drawn from Seattle-Tacoma International Airport (SEA) service area, a reduced demand on BLI
can be expected as its current catchment area extends to the north Seattle region. This forecast
assumes that the decrease will be approximately 10 percent.
By 2019 PAE will have established itself, the current terminal will be operating at or near capacity,
and its impact on the market will be established.
Increasing service by low cost carriers Rouge and WestJet at Vancouver International Airport (YVR)
and Abbotsford Airport (YXX) will reduce the number of Canadian customers who cross the border
to fly out of BLI. A comparison completed in 2016 shows that ticket prices are generally cheaper at
YVR than at BLI but YXX tickets are still higher.
The relative value of the Canadian Dollar to the US Dollar will not change substantially in the short-
term hovering around the 1.3 mark through the end of 2017. This will also discourage the cross
border customer base.
2020 - Growth at BLI will continue, but at a rate that is less than the FAA forecast rate for
commercial passengers due to the maturing regional commercial air-service market.
2022 – 2027
Gate and capacity expansion will be stalled at SEA and PAE leading to BLI regaining market share.
Growth during this period is projected at the FAA rate of 1.6% annually, which matches the growth
rate for Puget Sound passenger demand growth forecasted in the SEA Sustainable Airport Master
Plan (SAMP).
Bellingham International Airport | Master Plan DRAFT4 | 4 Forecast of Aviation Demand November 27, 2017
Beyond 2027
SEA and PAE will add capacity and draw from BLI’s current catchment area resulting in a
suppression of the growth rate at BLI where passenger levels will continue to increase but at a rate
lower than FAA projections (estimated to be approximately 1.3% annually).
Commercial air carrier operations will continue to grow as passenger levels increase but the
airlines will seek higher load factors before they add flights. This will make airplane operations
grow slower than the growth in passengers.
The Air taxi category includes the on-demand carriers, air cargo flights, and other for hire air taxi
activity. Historically this category has represented a healthy segment of the BLI market. This is
expected to continue in the future with growth rates tied to projected growth in the overall national
aviation market, as forecast by FAA as well as growth in the regional population.
General aviation including corporate and business activity makes up the most significant portion of
the total operations at BLI. The growth in this category is expected to be moderate over the 20-
year forecast period driven primarily by local population growth and economic conditions.
Military activity at BLI has fluctuated in the past but is a minimal portion of overall activity and in the
future is expected to remain flat.
Table 4-2 shows a summary of the forecasts prepared for BLI that will be used in the remainder of this
master plan. Details of historical information, assumptions, and decisions regarding these forecasts
are contained in this chapter.
Table 4-2: Summary of Forecasts BLI
Category 2016 2022 2027 2032 2037
Enplaned Passengers 417,930 392,209 424,606 459,679 497,649
Air Cargo Tons 1,450 1,535 1,623 1,710 1,792
Based Aircraft 189 207 222 238 256
Annual Operations
Air Carrier 8,022 7,599 7,630 8,021 8,320
Air Taxi 9,379 9,747 10,058 10,361 10,653
Air Cargo 5,736 6,006 6,349 6,689 7,012
General Aviation 56,701 60,984 63,636 66,489 69,610
Military 2,770 2,770 2,770 2,770 2,770
Total 82,608 87,106 90,443 94,330 98,365
Source: Base year 2016 operations from FAA ATADS data with some additional classification distribution
to account for forecasting categories. In this case commuter airline operations by the Q- 400
have been included in the air carrier numbers.
Base year 2016 passenger and air cargo data from airport records
All forecasts by AECOM
DRAFT Bellingham International Airport | Master PlanNovember 27, 2017, 2017 Forecast of Aviation Demand 4 | 5 4.3 Forecast Categories While the nature and scope of aviation demand forecasts vary from airport to airport the primary forecast elements are relatively consistent. For BLI, the forecast will address the following activity categories: Commercial Activity (Air Carrier and Commuter) Enplaned passengers (Domestic & International) Commercial airplane fleet Annual commercial service operations Air Taxi Activity Total air cargo tonnage Air cargo airline fleet Annual air cargo operations Annual air taxi operations General Aviation Activity Total number of based aircraft Based aircraft fleet mix Annual general aviation operations Local and itinerant operations Military Activity Annual Instrument Operations Peak Period Forecasts for Peak Month, Design Day, and Design Hour Critical Aircraft and Operations Activity 4.4 The Forecasting Process The process used to develop aviation demand forecasts follows the same basic steps regardless of the type or size of the airport. Key steps are defined in Advisory Circular 150/5070-6B, Airport Master Plans and include: Collect and review previous forecasts; Gather additional data as needed; Select the forecast methods to include, Apply the forecast methods and evaluate the results, Select the preferred forecast based on judgement. Bellingham International Airport | Master Plan DRAFT
4 | 6 Forecast of Aviation Demand                                                               November 27, 2017

Subsequent sections of this chapter provide the background information on how the forecasts were
developed. Forecasts have been prepared for periods ending 5, 10, and 20 years from the base year of
the forecast (year 2016).

4.5        Forecast of Commercial Activity

4.5.1      Background
As described in the Existing Conditions chapter, commercial activity at BLI has changed dramatically
since 2004. The airport underwent a transition from a regional service airport served primarily by
commuter aircraft with feeder flights to Seattle, into a small-hub airport where the introduction of low-
cost carrier service to leisure and vacation destinations, led to a rapid increase in the number of
enplaned passengers. The period of continuous passenger enplanement growth from 2004 through
2013 was driven by the introduction of service by Allegiant Airlines. Allegiant focused on drawing new
passengers to Bellingham from southwestern British Columbia and the northern Puget Sound Region.
For those passengers, the attraction was a combination of ease of access, low fares to new
destinations, and the extremely low cost of parking.

As the passenger levels at BLI increased, Alaska Airlines expanded service in 2008 to include 737-
service to several destinations. During the initiation of this competing service, both Allegiant and
Alaska used low demand inducement fares to attract additional passengers to BLI. This combined with
the fact that the relative value of the Canadian dollar vis-à-vis the American dollar made tickets at BLI of
greater value to the Canadian passenger which led to the rapid increases in passenger levels.

By 2014 the passenger market at BLI had developed to the point where both airlines sought to better
define the value of the market by raising ticket prices and reducing seating capacity to more profitable
levels. At the same time airline corporate offices have refocused their attention on new markets or
other factors that advanced the overall business goals of the airlines. These decisions, as well as
changes in the currency exchange rates and the general conditions and changes in the national air
carrier industry have led to three years of declining passenger levels (2013 through 2016).

Table 4-3:      Historical Enplaned Passenger Levels               Table 4-3 shows the historical levels
                (Fiscal Year)                                      of enplaned passengers at BLI over
                                                                   the past decade.
    Year          Air Carrier        Commuter             Total
                                                                   Over the years the fleet used to
 2007             94,399             117,261       211,660
                                                                   transport these passengers has also
 2008            162,086             112,734       274,820
                                                                   changed.      In 2007 and 2008 the
 2009            219,212              91,365       310,577
                                                                   majority of flights at BLI still consisted
 2010            270,332             104,992       375,324
                                                                   of Horizon Airlines flights back and
 2011            368,859             125,098       493,957
                                                                   forth to SEA. From 2008 forward the
 2012            426,397             137,039       563,436
                                                                   increase in scheduled service by
 2013            461,863             141,204       603,067
                                                                   Alaska and Allegiant changed the fleet
 2014            420,768             127,867       548,635
                                                                   mix to higher seat capacity aircraft
 2015            330,472             123,030       453,502
                                                                   (MD-80’s for Allegiant and 737’s for
 2016            299,417             118,513       417,930
                                                                   Alaska). This increased the average
Source: Bellingham Airport records
                                                                   seats available per departure at BLI.
                                                                   The data in Table 4-4 shows the

DRAFT                                                      Bellingham International Airport | Master Plan
November 27, 2017, 2017 Forecast of Aviation Demand 4 | 7
relationship between the enplaned passenger levels and the airline departures, expressed and
passenger load factor.
Table 4-4: Historical Load Factors
Enplaned Commercial Commercial Pax per Avg Seats per Avg Load
Year Passengers Operations Departures Dep Departure Factor
2007 211,660 3,362 1,681 126 130 96.86%
2008 214,820 6,190 3,095 69 130 53.39%
2009 310,557 6,357 3,179 98 162 60.31%
2010 375,324 6,981 3,491 108 162 66.37%
2011 493,957 8,128 4,064 122 162 75.03%
2012 563,436 9,307 4,654 121 162 74.74%
2013 603,067 9,911 4,956 122 162 75.12%
2014 548,635 9,321 4,661 118 162 72.67%
2015 453,502 7,357 3,679 123 162 76.10%
2016 417,930 7,583 3,792 110 162 68.04%
Notes:
Enplaned Passenger levels taken from airport records
Operations from the TAF published January 2017
Currently (2017) Allegiant and Alaska Airlines have split the market at BLI with Alaska dominating the
market to SEA due to their Horizon Q-400 commuter air-service that is used to connect with other
Alaska flights. Allegiant’s largest market remains Las Vegas (LAS). The details of the airline service are
shown in Figure 4–1 and Figure 4–2.
Figure 4–1: Alaska Airlines Service at BLI
180,000
160,000
140,000
Available Seats
120,000 2011
100,000 2012
80,000 2013
60,000 2014
2015
40,000
2016
20,000
0
HNL LAS OGG PDX SEA KOA
Cities Served
Bellingham International Airport | Master Plan DRAFT4 | 8 Forecast of Aviation Demand November 27, 2017
HNL – Honolulu International Airport PDX – Portland International Airport
LAS – McCarren International Airport (Las Vegas) SEA – Seattle-Tacoma International Airport
OGG - Kahului Airport KOA – Kona International Airport
Figure 4–2: Allegiant Service at BLI
180,000
160,000
140,000 2011
120,000 2012
Available Seats
100,000 2013
80,000 2014
60,000 2015
40,000 2016
20,000
0
AZA HNL LAS LAX LGB OAK OGG PSP SAN
Cities Served
AZA – Phoenix-Mesa Gateway Airport OAK – Oakland International Airport
HNL – Honolulu International Airport OGG - Kahului Airport
LAS – McCarren International Airport (Las Vegas) PSP – Palm Springs International Airport
LGB – Long Beach Airport SAN – San Diego International Airport
The challenge faced in developing a new forecast at BLI is to understand the factors that pushed
growth (and decline) in the past and anticipate changes that will influence commercial activity in the
future. The first step in making this forecast is to analyze the relative position of BLI within the larger
aviation system. These cover a variety of physical, operational and socio-economic considerations
and include the following.
The Regional Marketplace: Bellingham and Whatcom County are situated between two large
Metropolitan Areas (Seattle and Vancouver B.C.). There are currently three commercial service airports
operating within this area in addition to BLI. These are the Seattle-Tacoma International Airport (SEA),
Vancouver International Airport (YVR) and Abbotsford Airport (YXX) as shown in Figure 4–3.
DRAFT Bellingham International Airport | Master PlanNovember 27, 2017, 2017 Forecast of Aviation Demand 4 | 9
Figure 4–3: Bellingham International Airport Passenger Catchment Area
Airport Location Distance
Seattle-Tacoma International Airport SeaTac, Washington 110 miles – 1 hour 55 minutes
46 miles – 1 hour 45 minutes
Vancouver International Airport Vancouver, British Columbia
(with border crossing)
23 miles – 1 hour 10 minutes
Abbotsford International Airport Abbotsford, British Columbia
(with border crossing.)
Physical Facilities: The airports within the region have prepared forecasts that indicate a potential
market of 54,000,000 enplaned passengers by 2037. As shown in the following table, previous
forecasts have indicated that BLI’s share of this regional base was forecast to be from 1.25 to 1.5
percent of the total. Most of the passengers are assumed to continue to use the larger and better
airline served facilities at SEA and YVR.
The Sustainable Airport Master Plan for SEA assumes that the airport’s ability to provide sufficient gate
capacity to keep up with demand is questionable in both the short- and long-term periods. Likewise, at
YVR the master plan is currently under development and keeping airport capacity in sync with demand
growth will be difficult.
Bellingham International Airport | Master Plan DRAFT4 | 10 Forecast of Aviation Demand November 27, 2017
Table 4-5: Forecasts for Regional Airport Passengers
Year BLI PAE SEA YVR YXX Total Regional
2015 461,578 0 19,025,000 10,150,000 406,302 30,042,880
2016 423,949 0 19,450,000 10,424,050 414,428 30,721,427
2017 392,837 56,000 19,875,000 10,705,499 422,717 31,396,053
2022 432,919 238,200 22,000,000 12,230,921 466,713 35,368,753
2027 468,896 262,992 25,040,000 13,973,698 515,289 40,260,876
2032 512,006 290,364 28,690,000 15,964,804 568,921 46,026,095
2037 559,517 320,586 34,990,000 18,239,621 628,135 54,737,858
Sources: ● SEA forecast as prepared in the Sustainability Master Plan
● BLI forecast taken from the FAA Terminal Area Forecast (TAF)
● PAE forecast assumes a terminal opening in 2018 with both opening year passenger levels and 5-years hence
from the Finding of No Significant Impact Record of Decision ( FONSI/ROD) issued by FAA for the institution of
commercial service. From that point forward a 2 percent annual rate is applied based on the passenger
growth/regional population ratio.
Changing the distribution of passengers between these airports will be based largely on ticket price. A
Passenger Retention Analysis conducted for BLI identified the top 20 Destination Markets and a
comparison of the cost of tickets to those destinations from each of the regional airports shows that
passengers can generally get a better bargain today by purchasing their tickets for SEA or YVR rather
than for BLI or YXX (Table 4-6). This is contrary to the situation that existed from 2012 through 2015.
When the cost of parking and ease of travel are included the situation becomes less clear. For
instance, at Bellingham automobile parking fees are $12.00 per day compared with YXX at $9.00 per
day and $28.00 per day at either SEA or YVR. Depending on how long a trip is being taken the
difference in parking can be considerable. However, the decision point for deciding which airport to
use continues to be ticket price.
DRAFT Bellingham International Airport | Master PlanNovember 27, 2017, 2017 Forecast of Aviation Demand 4 | 11 Table 4-6: BLI Top 20 Destination Markets – Airline Ticket Price Comparison # Destination BLI YVR SEA YXX 1 Las Vegas, NV $141.20 $227.91 $96.20 $269.12 2 San Diego, CA $235.20 $223.98 $188.70 $422.24 3 San Francisco, CA $218.20 $217.32 $141.20 $380.67 4 Phoenix, AZ $231.20 $249.87 $121.20 $383.84 5 Los Angeles, CA $231.20 $188.99 $116.20 $352.37 6 Washington DC $412.20 $309.55 $305.20 $541.30 7 Honolulu, HI $623.00 $337.41 $518.00 $562.03 8 Norfolk, VA $389.20 $322.53 $268.20 $1,090.78 9 Reno, NV $239.20 $249.76 $212.20 $438.83 10 Jacksonville, FL $438.83 $310.61 $368.20 $563.82 11 Orlando, FL $494.20 $256.62 $361.20 $381.74 12 Dallas/Fort Worth, TX $317.20 $341.02 $256.20 $487.87 13 Orange County, CA $235.20 $220.55 $170.20 $488.59 14 Chicago, IL $325.20 $351.10 $272.20 $508.31 15 San Jose, CA $631.99 $309.85 $537.49 $583.95 16 Denver, CO $230.20 $266.79 $141.20 $493.03 17 Atlanta, GA $337.20 $309.55 $366.70 $423.32 18 Baltimore, MD $412.20 $309.55 $305.20 $602.18 19 Kahului, HI $645.00 $358.51 $518.00 $654.47 20 Oakland, CA $227.20 $217.23 $191.20 $404.28 Date of Research: Oct. 31, 2016 (per expedia.com) Analyzed Travel Days: December 5 - December 7 Bellingham International Airport | Master Plan DRAFT
4 | 12 Forecast of Aviation Demand November 27, 2017
Figure 4–4: BLI Top 20 Market Destinations – Airline Ticket Price Comparison
$1,200.00
$1,000.00
$800.00
Ticket Price
$600.00
$400.00
$200.00
$0.00
Bellingham (BLI) Vancouver (YVR) Seattle (SEA) Abbotsford (YXX)
In addition to the airports shown, new commercial service is expected to begin at Paine Field in
Snohomish County in 2018. This service will likely be initiated with low ticket prices offered to attract
initial customers and “prove” the viability of service. However, opening day service will be limited by the
capacity of the 30,000 sf two-gate terminal and has been estimated to be limited to 150,000
enplanements during the first year with eventual growth to 550,000.
At BLI however, terminal expansion completed in 2014 allows the Port of Bellingham to offer new state-
of-the-art terminal facilities within a low operating cost structure with adequate capacity to handle up
to 800,000 annual enplaned passengers – not currently expected to be reached within the next 15 to
20 years.
Service Enhancements: BLI is a Designated International Port of Entry. Although the majority of the
international flights are General Aviation, the Port of Entry could be expanded to include commercial
flights in the future.
Border Conditions: Historically a percentage of BLI’s passengers have been drawn from British
Columbia. This portion of the market has been subject to changes in international border dynamics
such as economics, currency exchange rates, changes to Canadian airport taxation rules, or border
clearance procedures.
Airline Market Factors: Given the competitive regional marketplace BLI’s future is particularly
sensitive to changing airline business models or service patterns such as;
Airline consolidations and capacity discipline,
DRAFT Bellingham International Airport | Master PlanNovember 27, 2017, 2017 Forecast of Aviation Demand 4 | 13
Fluctuations in the price of oil and
Changes in the currency exchange rates
Community Input: Although there has been opposition expressed to airport operations in the past,
these have been related to noise levels, aircraft emissions and the overall growth in automobile traffic
near the airport. There is some general recognition that the increased travel convenience and positive
economic impacts at the airport have been positive.
Socioeconomic Conditions: The growth in population and general economy picture for the primary
service area (Whatcom County) indicates that demand for air transportation services generated locally
will continue.
4.6 Forecast of Enplaned Passengers
The forecast of enplaned passengers at BLI has been prepared to include all passengers whether
traveling by air carrier or commuter airline. A variety of methods are available for forecasting air carrier
passengers. However most techniques share a common shortcoming that assumes relationships
which existed in the past will continue unchanged into the future. Consequently, they do not allow for
the effects of airline marketing decisions, changing service levels, and other changes at BLI that are
independent of past indicators but which have been the driving forces behind BLI’s passenger levels.
For instance, an econometric model that compared passenger growth to population and economic
growth within the passenger service area showed no correlation between the number of enplaned
passengers and the typical socioeconomic factors that have been linked to such growth. In the case of
Bellingham, the primary factor in the past growth levels has been the US/Canadian exchange rate.
However, arriving at independently produced projections for how this could change in the future is not
possible. To account for these forecasting issues, a deeper dive into local factors has been applied to
the forecasts derived from the statistical techniques.
The first method we used for projecting future passenger levels is the market share technique. Market
share analyses involve a review of historical activity levels at an airport and comparing these to levels
for a larger area. This comparison can be used to determine what share of the larger market area uses
the individual airport for which forecasts are being prepared. This share can then be applied to
forecasts of passengers prepared for the larger market by the FAA in the Terminal Area Forecast (TAF)
to project future activity levels at BLI. Market share models used for these forecasts are as follows:
BLI enplanements as a percentage of total enplanements for the FAA Northwest Mountain Region
(Washington, Oregon, Idaho, Montana, Wyoming, Utah and Colorado)
BLI enplanements as a percentage of the total enplanements for all commercial service airports in
Washington State
The underlying assumption in this method is that the FAA’s overall passenger market projections
reflect realistic national and regional growth rates and that, based on historical trends, BLI can be
expected to perform in a manner that maintains its demonstrated share of that larger market over time.
In the case of BLI, with a customer base that includes southeast British Columbia, these regional
forecasts were felt to reflect the best analysis of the growth of the airline passenger market.
To supplement the market share analyses, forecasts were also developed using growth rates in
enplaned passengers independently projected by industry and government agencies other than FAA.
In the case of these enplaned passenger forecasts, three industry sources were used 1) The Boeing
Bellingham International Airport | Master Plan DRAFT4 | 14 Forecast of Aviation Demand November 27, 2017
Company, 2) Airbus, and 3) the International Air Transportation Association (IATA). These publications
provide a detailed analysis of the demand for airline travel globally broken down by markets. In our
forecasts the growth rates projected for North America were used as an indicator of the latent demand
for service, regardless of the airport chosen by the passengers. The growth rates projected in these
sources were compared with those found in the FAA’s Aerospace Forecasts. These sources project
that the air passenger market in North America will grow at a rate of from 1.6 to 3.0 percent per year.
4.6.1 Summary of Enplaned Passenger Projections and Preferred Forecast
Selecting the preferred forecast of enplaned passengers for BLI was approached as a three-step
process. 1) in the short-term, (0 to 5 years) forecast is developed using a scenario based process that
applies the judgement of the forecaster to the knowledge of the local market conditions. This results in
a “best guess” as to the direction of the local and regional market on a year-by-year basis, 2) the mid-
term (6 to 10 years) is based on a series of local and national factors to give a rate of growth that is
reflective of the specific situation at BLI, and 3) the long-term (11 to 20 years) forecast will be
developed in more general terms to provide a generalized trend. Table 4-7 shows the range of
forecasts produced and presents the preferred forecast for this master plan.
Table 4-7: Bellingham International Airport Forecast of Enplaned Passengers
Market Market
Share Share IATA Terminal
(WA (NWM Growth Aerospace Preferred Area
Year State) Region) Rate Forecasts Forecast Forecast
2016 417,930 417,930 417,930 417,930 417,930 417,930
2022 496,648 512,424 499,030 459,691 392,209 432,919
2027 548,645 564,095 578,513 497,662 424,606 460,869
2032 603,451 619,125 670,655 538,769 459,679 512,006
2037 662,303 678,290 777,473 583,272 497,649 549,800
Source: AECOM
DRAFT Bellingham International Airport | Master PlanNovember 27, 2017, 2017 Forecast of Aviation Demand 4 | 15
Figure 4–5: Forecast of Enplaned Passengers
900,000
Annual Enplaned Passengers
800,000
700,000
600,000
500,000
400,000
300,000
200,000
100,000
0
Years
Market Share - WA State Market Share - NWM Region
IATA Growth Rate FAA Aerospace Forecast Growth Rate
Preferred Forecast Historic
In selecting the preferred forecast of enplaned passengers for this master plan elements of each of the
forecasting methods were used, but judgement was applied to consider the factors that are known to
exist at present. These include the primary acknowledgement that for the next five years, BLI’s
passenger levels will be heavily influenced by regional growth and industry factors. The assumptions
used to make the short term forecast are as follows.
Due to labor contract issues, Allegiant Air has indicated that they will cut capacity at BLI by
approximately 9 percent in 2017. This is assumed to decrease passengers by 9 percent.
BLI bookings will decrease with the advent of commercial service at Paine Field in 2018. This will
be due to the fact that tickets are likely to be priced low to attract initial customers and “prove” the
service. However, the capacity at PAE has been established at 550,000 annual passengers over
the long term so the impact of new service will not be long-term. Although most of the passengers
attracted to PAE are expected to be drawn from SEA, a reduced demand on BLI can be expected.
This forecast assumes that the decrease will be about 10 percent.
By 2019 PAE will have established itself, the current terminal will be operating at or near capacity,
and its impact on the market will have peaked to the established capacity.
Increased service by low cost carriers Rogue and Westjet at YVR and Abbotsford will limit the
number of Canadian customers who cross over to BLI. A comparison completed in 2016 by
AECOM shows that, ticket prices are generally cheaper at YVR than they are at BLI but YXX tickets
are still priced higher.
The relative value of the Canadian Dollar to the US Dollar will not change substantially in the short-
term hovering around the 1.3 mark through the end of 2017. This will also discourage the cross
border customer base.
Bellingham International Airport | Master Plan DRAFT4 | 16 Forecast of Aviation Demand November 27, 2017
2020 - Growth at BLI will continue, but at a rate that is less than the FAA forecast rate for
commercial passengers due to the maturing regional marketplace
2022 – 2027
Gate and capacity expansion will be stalled at SEA and PAE leading to BLI regaining market share.
Growth during this period is projected at the FAA rate of 1.6% annually, which matches the growth rate
for Puget Sound passenger demand growth forecasted in the SEA SAMP.
Beyond 2027
SEA and PAE will add capacity causing a suppression of the growth rate at BLI where passenger levels
will continue to increase but at a rate lower than FAA projections (estimated to be approximately 1.3
percent annually).
The preferred forecast represents a vision for future passengers at BLI as discussed in the preceding.
However, because this forecast will be used as the basis for the master plan it is important to
remember the number of assumed circumstances that led to its development and identify the ways
that changes in these assumptions could result in markedly different activity levels. In this analysis the
following need to be considered.
New air-service to new locations could be offered from BLI at any time. This would impact the
forecast in two ways. First, an immediate growth in passenger levels would be experienced.
Second the successful introduction of such service would lead to the “reclaiming” of portions of
the potential market that currently goes elsewhere.
BLI could continue in its current state with airline service remaining static. Under this scenario
growth would likely decrease in the short term but return to growth mode as other airports reach
gate capacity. Growth in the intermediate and long terms would be steadily driven by growth in
regional population levels.
Due to a change in operating or service philosophy, Alaska Airlines or Allegiant Air could decide to
concentrate on expansion at PAE
and reduce at BLI. Decreasing Table 4-8: Enplaned Passenger Forecast: Range
service will result in a loss of
market share over the long run Low Range Preferred High Range
with minimal annual growth rates. Year Growth Forecast Growth
To account for these potential swings 2016 417,930 417,930 417,930
in the marketplace, three forecast 2022 372,599 392,209 512,424
scenarios will be carried forward. 2027 403,376 424,606 564,095
These are a low forecast, which 2032 436,695 459,679 619,125
calculates slower recovery from the 2037 472,767 497,649 678,290
market fluctuations (the low forecast
is 95% of the preferred). The high forecast shown is the market share analysis comparing BLI as a
portion of the overall NW Mountain Region. While this forecast does not recognize the specific market
factors impacting BLI at present, it does present an optimistic long-term view. The three forecast
scenario results are shown on the following table. These represent the range of possibilities for
passenger levels for future planning purposes.
DRAFT Bellingham International Airport | Master PlanNovember 27, 2017, 2017 Forecast of Aviation Demand 4 | 17
Figure 4–6: Range of Enplaned Passengers
800,000
Annual Enplaned Passengers
700,000
600,000
500,000
400,000
300,000
200,000
100,000
0
Years
Forecast High Low
Source: AECOM
4.7 Forecast of Air Carrier Operations
An aircraft operation is defined as a take-off or a landing, thus each flight consists of two operations.
Forecasting the number of commercial operations relies on a process that includes the historical
number of enplaned passengers per airline departure, projects changes in this ratio into the future, and
applies these changes to the preferred forecast of enplaned passengers. The forecast of air carrier
operations is based on the derived ratio of passenger enplanements per operation using the following
process:
Determine the historical number of enplaned passengers to airline departures,
Project changes in the enplaned passenger to departure ratio (Load Factor),
Apply the projected load factors to the enplaned passenger forecast to forecast the annual air
carrier departures,
Double the number of departures to account for total annual operations.
At BLI, a direct relationship has existed between the number of air carrier operations and the level of
passenger demand in terms of enplanements. The airlines have based the number of flights on
maintaining a high passenger load factor, which is expressed as a percentage of seats filled on each
departing aircraft. When the carrier has a high load factor it will choose to either increase the number
of flights or use an aircraft with greater seating capacity. The assumptions used in these projections
are as follows and as shown in Table 4-9.
Allegiant Airlines currently operates a fleet consisting of Boeing 757-200, MD-80 and 88 and Airbus
A319 at BLI. Over the next ten years Allegiant will phase the 757-200 and MD-80 aircraft from the fleet
replacing them with more fuel efficient aircraft like the A319.
Bellingham International Airport | Master Plan DRAFT4 | 18 Forecast of Aviation Demand November 27, 2017
Currently, Alaska Airlines has a fleet of Boeing 737 aircraft that includes the 737-700, -800, and -900
serving BLI. In the future Alaska is expected to continue to use an all-Boeing fleet with similar seating
capacities. Gradual evolution to a more modern, quieter, and fuel-efficient aircraft will occur over the
next 20 years.
Alaska/Horizon Airlines uses Bombardier Q400 on all routes throughout their system. There are no
known plans to change this fleet.
Table 4-9: Air Carrier Fleet Mix
Aircraft 2016 2022 2027 2032 2037
Seats
Type % Seats % Seats % Seats % Seats % Seats
MD-80 166 3% 4.8 1% 0.8 0% 0.0 0% 0.0 0% 0.0
A319 156 63% 98.6 60% 93.6 57% 88.9 54% 84.2 50% 78.0
B-737 800 163 0% 0.0 8% 13.0 8% 13.0 8% 13.0 8% 13.0
B-737 900 171 0% 0.0 4% 5.7 9% 14.7 11% 17.9 12% 19.6
B-737 900E 171 0% 0.0 1% 1.6 4% 6.5 5% 8.2 8% 13.0
B-737 700 124 7% 12.1 2% 3.3 2% 3.3 2% 3.3 2% 3.3
Q400 78 27% 43.2 25% 40.8 20% 32.6 20% 32.6 20% 32.6
100% 158.7 100% 158.8 100% 159.0 100% 159.2 100% 159.5
Source: Fleet mix derived from analysis of BLI gate schedules for four different time periods in 2016 and 2017
From the information in Table 4-9 the projected percentages for the daily fleet serving BLI and the
resultant number of seats per departure (calculated as a weighted average) expected throughout the
forecast period have been calculated. In forecasting air carrier operations, the following factors have
been considered.
Airlines will match seating capacity of departing aircraft with passenger levels to achieve better
yields.
Airline fleet composition and known changes were considered in calculating available
seats/departure
Aircraft load factors assumed to remain high over time
Using the average seats per departure calculated above, the historical passenger load factors and
assumptions regarding changes in the future, and the forecast of annual enplaned passengers, the
following forecast of annual air carrier operations has been developed, as shown in Table 4-9.
.
DRAFT Bellingham International Airport | Master PlanNovember 27, 2017, 2017 Forecast of Aviation Demand 4 | 19
Table 4-10: Forecast of Commercial Operations
Enplaned Avg. Load Annual Annual TAF
Year Passengers Seats/Dep Factor Departures Operations Forecast
2016 417,930 158.7 62% 4,241 8,476 8,476
2022 392,209 158.80 65% 3,800 7,599 7,856
2027 424,606 159.00 70% 3,815 7,630 8,361
2032 459,679 159.20 72% 4,010 8,021 9,282
2037 497,649 159.50 75% 4,160 8,320 9,961
1
The comparison with the TAF is not entirely accurate since we have included all commercial
passenger flights, including those on the Q400 which are considered to be commuter/air taxi in the TAF
Figure 4–7: Commercial Operations Forecast
9,000
Annual Commercial
8,500
Operations
8,000
7,500
7,000
6,500
6,000
Years
4.8 Air Taxi
The Air Taxi category traditionally includes all “for hire” services, whether scheduled or non-scheduled
that occur at an airport. This category generally includes operations by commuter airlines as well as
on-demand carriers, all-cargo activity, and other activity that is performed on a for hire basis. In the
case of BLI, the commuter operations have been forecast as part of the commercial service category
so the forecasts prepared for air taxi will be limited to the all-cargo carriers and on-demand (charter)
carriers.
4.9 Air Cargo
Air cargo at BLI is carried by either the scheduled airlines as belly cargo using the same aircraft used in
passenger service, or by all-cargo carriers. Examining airport management records reveals that the
majority of cargo at BLI is classified as domestic air freight and is handled by the carriers Ameriflight
and Empire Airlines who operate under contract with FedEx and UPS or by independent operators such
as Rite Brothers, San Juan, Harbor Air and West Isle Air.
1
Bellingham International Airport | Master Plan DRAFT4 | 20 Forecast of Aviation Demand November 27, 2017
This forecast will concentrate on
Table 4-11: Air Cargo Forecasts the all-cargo carriers. The cargo
business is typically driven by
2016 2022 2027 2032 2037 local economic factors,
particularly within the service
Enplaned 638 676 714 753 789 area (Whatcom and San Juan
Deplaned 812 860 909 957 1,004 Counties) and is growing at a rate
Total 1,450 1,535 1,623 1,710 1,792 of approximately 1 percent per
Operations 5,736 6,006 6,349 6,689 7,012 year.
At present all cargo is hauled on
Figure 4–8: Forecast of Annual Air Cargo Tonnage aircraft such as the Cessna
Caravan and the Beech 18 or
2015 2016 2022 2027 2032 2037 Swearingen Metroliner. In 2016
the all-cargo carriers carried
1,710 1,792
1,535 1,623 approximately 550 pounds per
1,450
operation. The types of aircraft
1,090 being used have the capacity for
1.6 to 2 tons per operation and it
is reasonable to assume that
over time the average loads will
increase. However, it is doubtful
Total Tons whether the increase will result
in aircraft operating at full
capacity.
Figure 4–9: Forecast of Annual Air Cargo Operations
Table 4-11 shows the forecast
for enplaned, deplaned and total
7,500
air cargo tonnage at BLI. Also
7,000 shown on the table is the number
6,500 of annual air cargo operations
6,000 forecast
5,500
5,000
Enplaned and Deplaned Total
DRAFT Bellingham International Airport | Master PlanNovember 27, 2017, 2017 Forecast of Aviation Demand 4 | 21
4.9.1 On-Demand Operations
The other air taxi operations at BLI are conducted by aircraft for hire. These include special deliveries,
cargo deliveries, personnel services, or
other. Table 4-11 shows the forecast Table 4-12: Forecast of Charter Operations
prepared for these. As shown, future
growth was projected using three FAA
different rates of growth. Aerospace
Year Rates Population Preferred
The first forecast showed a growth rate of
2016 9,379 9,379 9,379
1.06 percent as used in the FAA’s
2017 9,389 9,490 9,439
Aerospace Forecasts. This rate was
applied this rate to the historic base 2022 9,439 10,055 9,747
numbers to project the future. 2027 9,489 10,627 10,058
2032 9,539 11,183 10,361
The second assumed that these
2037 9,590 11,716 10,653
operations will increase at the same rate
Source: AECOM
as regional population (Whatcom and San
Juan Counties) approximately 1% per year.
The third forecast shown is the preferred forecast adopted for this report. This was developed to
reflect the full range of the future influences on activity by averaging the first two forecasts.
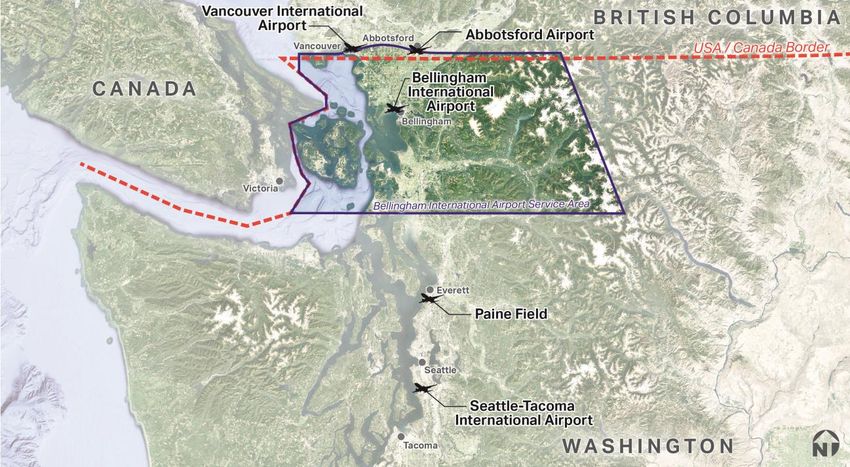
4.10 General Aviation
It is assumed that all airports within a 50-mile radius of BLI compete directly for general aviation
activity. Few of these, however, have the capability to compete for Corporate Aviation sector
customers. Table 4-13 summarizes the facilities that are available at each airport located within 50
miles of BLI. This list includes both those located in Canadian and the United States. The Canadian
airports are less likely to be a source of competition due to location and customs issues. Of the
remaining airports none but Arlington Municipal and Skagit Regional have the runway length and
navigational facilities required to accommodate business jets. Therefore, it is assumed that BLI will
continue to be one of the primary US airports in Northwest Washington for the corporate aviation
sector.
4.10.1 Forecasts of Based Aircraft
In preparing forecasts of general aviation based aircraft, the other regional airports and the
demographic factors within BLI’s service area are the primary considerations. At the present time
there are no vacant hangars or tiedown spaces available at BLI so based aircraft numbers have been
stable as demand continues to grow, as witnessed by the number of aircraft owners who have placed
their name on the Port’s hangar waiting list (19 individuals at present). These aircraft owners have been
willing to pay a fee to be placed on the waiting list and this is therefore seen as a legitimate demand
indicator. However, it is known that some of the individuals who are waiting for hangar space are
currently tied down on the apron, so the number of based aircraft will not necessarily increase when
hangar space becomes available. In forecasting the potential for growth in based aircraft at BLI the
following methodologies were used.
Bellingham International Airport | Master Plan DRAFT4 | 22 Forecast of Aviation Demand November 27, 2017
Table 4-13: Regional General Aviation Airports
Longest
Airport Country Service Level Runway
Abbotsford International Airport Canada PR 9,600
Anacortes Airport USA GA 3,015
Arlington Municipal Airport USA GA 5,333
Bellingham International Airport USA PR 6,701
Boundary Bay Airport Canada GA 3,750
Camano Island Airfield USA GA 1,750
Concrete Municipal Airport USA GA 2,609
Delta Heritage Air Pak Canada GA 2,600
Langley Municipal Airport Canada GA 2,100
Lynden Municipal Airport USA GA 2,425
Pitt Meadows Airport Canada GA 4,700
Point Roberts Airpark USA GA 2,400
Skagit Regional Airport USA GA 5,477
Vancouver International Airport Canada PR 11,000
PR = Commercial Service – Primary Airport
GA = General Aviation
DRAFT Bellingham International Airport | Master PlanNovember 27, 2017, 2017 Forecast of Aviation Demand 4 | 23
Regression analysis – This forecast technique ties aviation demand, in this case based aircraft (the
dependent variable), to economic measures (the independent variable). In this analysis, the population
forecasts prepared by the Washington State Office of Financial Management were used.
This technique allows for consideration of the local factors that contribute to the use of aircraft at an
airport. Increasing population in a community has been shown to lead to increasing numbers of aircraft
needing to base at the local airport. In this case, the number of based aircraft at BLI was compared with
the historic and projected population of Whatcom County, resulting in a forecast of 246 aircraft at BLI
by 2037.
Market share or ratio analysis – This technique assumes a top-down relationship between national,
regional, and local forecasts of based aircraft. In this analysis, the number of based general aviation
aircraft at BLI was compared with the overall number of general aviation aircraft in the State of
Washington, as forecast in the FAA Terminal Area Forecast. Historical market shares were calculated
based on FAAs forecast and used as the basis for projecting the number of aircraft at BLI. It is
assumed that an average of the market share for the past ten years was indicative of the future share.
The second market share method analyzed the historical share of the general aviation fleet that is
based at BLI against that forecast for the Northwest Mountain Region. In this technique, the total
number of general aviation aircraft registered in the Northwest Mountain Region was compared to the
historical number of aircraft based at BLI. As is seen, if the average ratio of BLI based aircraft to the
regions fleet holds steady, the number of aircraft based at BLI will increase to an estimated 230 aircraft
over the next twenty years.
A forecast produced by this method shows how national general aviation trends could affect the
number of based aircraft at BLI but does not account for changes in local conditions.
The methodologies used to make projections represent the broad range of possible futures for general
aviation growth at BLI. To identify the forecast to be used as the basis for planning several factors
were considered;
Neither the most optimistic (the FAA’s TAF for BLI) nor the least (BLI as a percentage of the
Northwest Mountain Region) should be used as the basis for long term planning.
Although the market share of the nation’s aircraft and the natural growth of based aircraft related to
population growth have been increasing in recent years, our forecast shows future growth
occurring as an average of the past rather than as a continual rising share of the marketplace.
Table 4-14 shows the range of projections as well as the preferred forecast for this master plan. The
preferred forecast was selected to represent a higher growth rate in the initial five year period. Given
the recent census data, it is anticipated that Whatcom County and the city of Bellingham will continue
to grow, in the short term at least, and this growth in economic vitality and population will drive the
demand for based aircraft. In addition, the following factors have been used to select the preferred
forecast.
BLI based aircraft have been relatively stable – limited by the storage capacity
BLI is a DHS designated International Port of Entry with Customs and Immigration clearance
capacity
BLI is home to an active and involved GA base
Bellingham International Airport | Master Plan DRAFT4 | 24 Forecast of Aviation Demand November 27, 2017
BLI’s runway length and precision approach give it competitive advantage over other regional
airports. The preferred forecast averages the 4 projections as none could be seen as superior to
the others and the, with the exception of the TAF the other scenarios resulted in similar forecast
numbers.
The population growth scenario assumed that the number of based aircraft at an airp0ort would be
directly related in the growth in the population of the service area, all other factors being equal.
However, because the lack of available hangars combined with the lack of land available for
development of new GA facilities the correlation between population and based aircraft did not
show a strong correlation. To counter this we used the projected annual growth in population,
applied to the current based aircraft numbers to generate a forecast.
Table 4-14: Forecast of Based Aircraft
Population Share of Share of Preferred
Year TAF Growth WA Market NWM Region Forecast
2016 189 189 189 189 189
2017 194 191 190 191 192
2022 219 205 201 201 207
2027 246 219 212 210 222
2032 275 232 224 220 238
2037 311 246 236 230 256
Figure 4–10: Based Aircraft Forecast
350
300
256
250
238
Base Aircraft
200
207 222
192
150
100
50
0
Years
TAF Forecast Population WA NWM Region Prefered Forecast
DRAFT Bellingham International Airport | Master PlanNovember 27, 2017, 2017 Forecast of Aviation Demand 4 | 25
The population growth scenario assumed that the number of based aircraft at the airport would be
directly related to the growth in the population of the service area, all other factors being
equal. However, because the lack of available hangars combined with the lack of land available for
development of new GA facilities the correlation between population and based aircraft did not show a
strong correlation. To counter this we used the projected annual growth in population, applied to the
current based aircraft numbers to generate a forecast that did not constrain potential growth in aircraft
based on historical shortages in available facilities. Also, both market growth scenarios were based on
an unconstrained forecast of based aircraft made by others. The preferred forecast averages the four
projections as none could be seen as superior to the others and, with the exception of the TAF the
other scenarios resulted in similar forecast numbers.
The preferred forecast will serve as the basis for projecting the based aircraft fleet mix at BLI. This
projection was made based on the current fleet mix and an analysis of the likely direction that growth
will take as detailed in the preceding. As shown in Table 4-15, the percentage of aircraft based at BLI
that are higher end turboprop or turbojet powered is expected to increase over the next 20 years.
While single and multi-engine piston aircraft will continue to dominate the total, most of the growth will
be in the higher end. This is in keeping with the national trends discussed earlier as well as with the
changes in local conditions. As the population grows and economic conditions improve, it is a natural
by-product that corporate aviation will become a growth sector.
Table 4-15: Based Aircraft Fleet Mix
Base – 2016 2022 2027 2032 2037
No % No % No % No % No %
Single-Engine Piston 166 89.3% 184 89% 193 87% 202 85% 212 83%
Multi Engine Piston 8 4.3% 8 4% 9 4% 12 5% 13 5%
Jet 5 2.7% 6 3% 9 4% 12 5% 15 6%
Helicopter 7 3.8% 8 4% 11 5% 12 5% 15 6%
Total 189 100.0% 207 100% 222 100% 238 100% 256 100%
Bellingham International Airport | Master Plan DRAFT4 | 26 Forecast of Aviation Demand November 27, 2017
2016 2037
2.7%
3.8% 6% 6%
4.3% 5%
89.3% 83%
Single-Engine Piston Multi Engine Piston Single-Engine Piston Multi Engine Piston
Jet Helicopter Jet Helicopter
4.10.2 General Aviation Operations
By definition, general aviation includes all operations by civil aviation aircraft not classified as
commercial or military. Three separate projections of operations were produced.
Operations per Based Aircraft (OPBA). In this methodology, the number of annual general aviation
operations in 2016 was compared with the number of based aircraft during that year to determine
how many operations each aircraft was responsible for. It is recognized that not all GA operations
at the airport were performed by airplanes that were based there, but this relationship serves as a
good indicator/predictor for future operations. At BLI, there were 289 operations per based
aircraft. This ratio was applied to the forecast of based aircraft to arrive at a forecast of operations.
Market Share Forecast. The forecasts of General Aviation activity that the FAA prepared for the
State of Washington and the Northwest Mountain region have been used to determine what
percent of these have occurred at BLI in the past. This relationship has been continued into the
future in the market share projections
The preferred forecast tempers the FAA’s projections from the TAF, which are based on a market share
of a larger area with the OPBA forecast which reflects the influence of local population and
demographic shifts. By averaging these, a forecast is developed that contains elements of each of the
projection methodologies. This is shown in Table 4-16.
Table 4-16: General Aviation Operations Forecast
Year (CY) TAF OPBA WA Share NWM Share Preferred
2016 56,701 56,701 56,701 56,701 56,701
2022 63,654 65,228 55,564 59,489 60,984
2027 64,157 70,019 58,259 62,110 63,636
2032 64,666 75,066 61,227 64,997 66,489
2037 65,180 80,564 64,508 68,188 69,610
DRAFT Bellingham International Airport | Master PlanYou can also read