A Benefits Analysis - AWS
←
→
Page content transcription
If your browser does not render page correctly, please read the page content below
Wake County Greenway System Plan - March 2016 Draft
A Benefits Analysis
“The Greenway is one aspect of living in Raleigh that has increased my
standard of living significantly. Please keep expanding, because I love to
bike, but not on the road!” - Public Comment
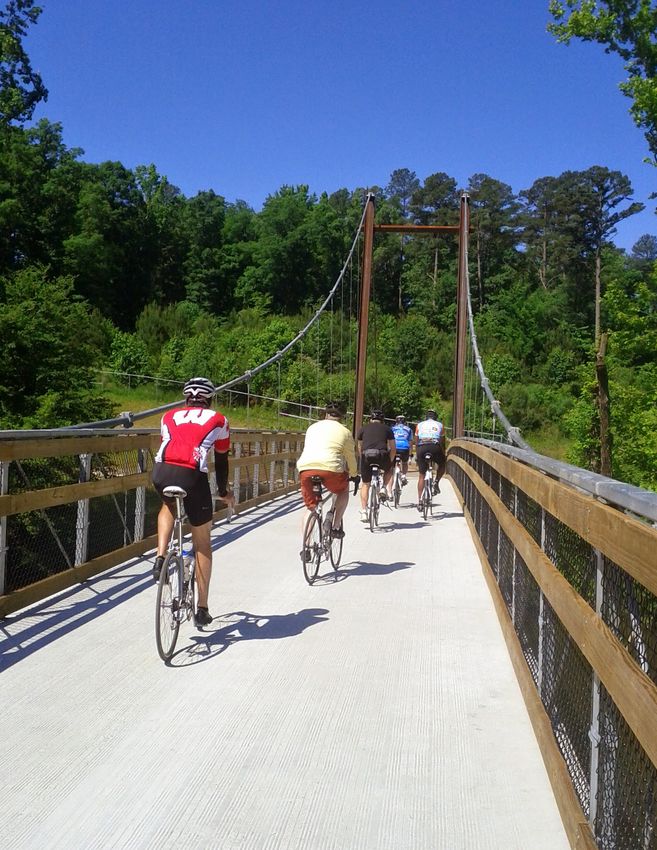
Shelly Lake in Raleigh, photo by ITRE
Bicycle and Pedestrian Program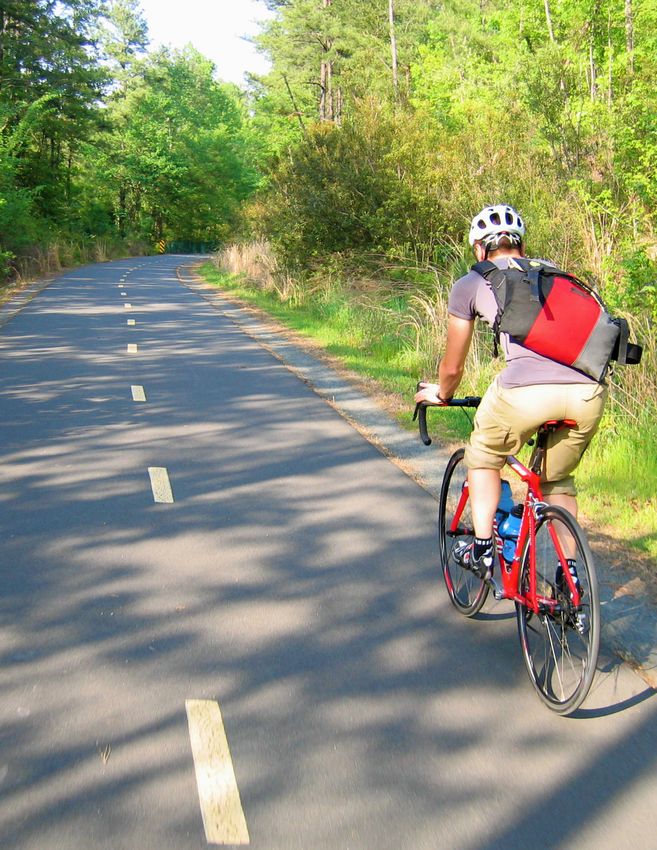
Wake County Greenway System Plan

          INTRODUCTION

          Constructing the Wake County Greenway
          System will connect communities within Wake
          County and provide residents and visitors a
          fun, healthy way to experience the culture and
          natural beauty of the region.

          Planned with the duel purposes of outdoor recre-          estimate of the average distance an able-bodied
          ation and transportation, the countywide greenway         person can travel by foot in 10 minutes)3 of the
          system consists of 145 miles of existing trails and       greenway will have the most convenient access and
          approximately 100 miles trails that are proposed in       will gain the most from the greenway system’s com-
          the first 10 years1. The full build-out of the greenway   pletion. To calculate these benefits, the study area
          system will impact a variety of health, environmen-       for the analysis was limited to residents living within
          tal, and transportation factors that directly affect      a 3-mile buffer for bicycling benefits and a 0.5-mile
          the quality of life of Wake County residents and          buffer for walking benefits.
          visitors. Quantifying these factors and understand-
                                                                    Figure 1 shows the total and employed population
          ing the magnitude of their impact on the county
                                                                    within the two buffer areas. The additional tables
          enables a more informed discussion on whether
                                                                    at the end of this appendix provide additional
          and how best to invest in the trail network.
                                                                    socio-demographic data of residents living within
          STUDY AREA                                                the two buffer areas.

          While the construction of the Wake County
          Greenway System will benefit all residents of and
          visitors to the region, those living within a 3-mile
          buffer (a conservative estimate of the average dis-
          tance an able-bodied person can travel by bicycle
          in 15 minutes)2 and a 0.5-mile buffer (a conservative

2 | Appendix A: Benefits Analysis
Wake County Greenway System Plan

                                    Figure 1: Total and Employed Population

METHODS                                                    Selecting Peer Counties

This health and economic impact analysis was               In order to estimate potential future increases
conducted by Alta Planning + Design, using a               in bicycling and walking that may result from the
standard methodology for calculating health,               implementation of the greenway system within
environmental, economic, and transportation-re-            Wake County (NC), travel patterns in seven peer
lated benefits. All projections are based on the           counties were examined: Sacramento (CA),
most recent five-year estimates from the                   Hennepin County (MN), St. Louis County (MO),
American Community Survey (ACS), which are                 Mecklenburg (NC), Travis County (TX), Fairfax
then extrapolated through the use of various               County (VA), and King County (WA). These seven
multipliers derived from national studies and              peer counties were selected based on similarities
quantified in terms of monetary value, where               in the design of their roadway networks, regional
appropriate. The estimated monetary values are             proximity, climates, terrain, population size and
then calibrated to baseline values and com-                demographics, and the presence of bicycle and
pared to bicycle and walk mode commute                     pedestrian infrastructure similar to the proposed
mode shares of peer counties.                              infrastructure in Wake County (See Figure 2 and
                                                           Table 1).

                                                                                          Appendix A: Benefits Analysis | 3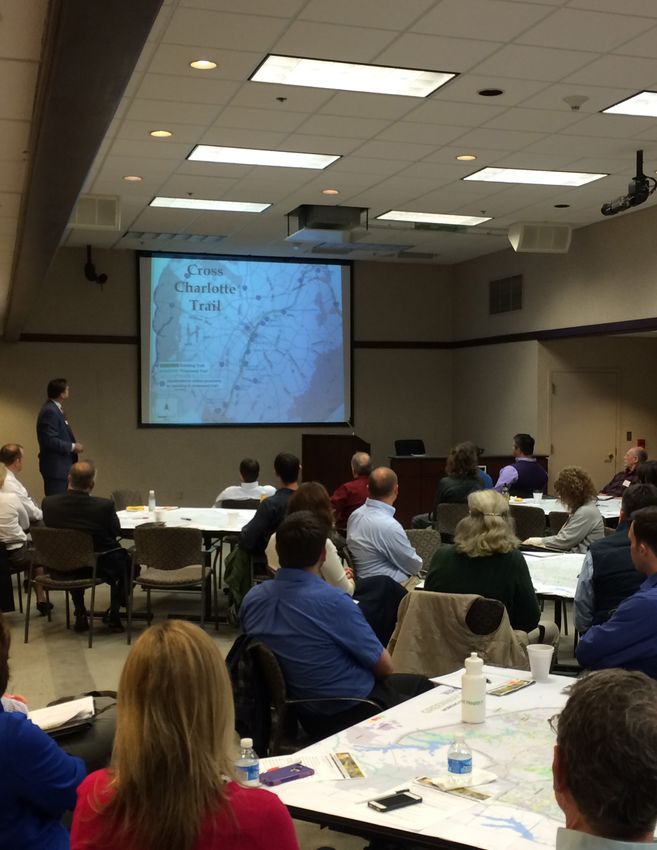
Wake County Greenway System Plan

                                        Figure 2: Peer Counties

                                    Table 1: Peer County Comparison

4 | Appendix A: Benefits Analysis
Wake County Greenway System Plan

After the identification of peer counties based on            Table 2 shows the existing bicycle commute mode
general characteristics, the existing bicycle and             shares for Wake County and its seven peer coun-
walk commute data from each county was exam-                  ties, as well as the mid-range of forecasted bicycle
ined. Compared to the selected peer counties,                 commute mode shares for the study area.
Wake County has the third lowest bicycle commute
mode share (0.3 percent), according to 2010-2014
ACS data.

                                Table 2: Existing and Forecasted Bicylce Commute Mode Share

                                                                                                    Appendix A: Benefits Analysis | 5
Wake County Greenway System Plan

          If the study area increased its bicycle commute               mode shares for the study area. Compared to its
          mode share to the 25th percentile of its seven                peer counties, Wake County has the lowest walk
          peer counties, it would see a 7 percent increase              commute mode share (1.4 percent), according to
          in the number of bicycle commuters (0.27 percent              2010-2014 ACS data. If the study area increased
          to 0.29 percent). If the study area increased its             its walk commute mode share to the 25th per-
          bicycle commute mode share to the 50th percen-                centile of its seven peer counties, it would see a
          tile of its seven peer counties, it would see a 300           36 percent increase in the number of walk com-
          percent increase in the number of bicycle com-                muters (1.4 percent to 1.9 percent). If study area
          muters (0.3 percent to 1.2 percent). If the study             increased its walk commute mode share to the
          area increased its bicycle commute mode share                 50th percentile of its seven peer counties, it would
          to the 75th percentile of its seven peer counties, it         see a 50 percent increase in the number of walking
          would see a 367 percent increase in the number of             commuters (1.4 percent to 2.1percent). If the study
          bicycle commuters (0.3 percent to 1.4 percent).               area increased its walk commute mode share to
                                                                        the 75th percentile of its seven peer counties, it
          Table 3 shows the existing walk commute mode
                                                                        would see a 100 percent increase in the number of
          share for Wake County and its seven peer counties,
                                                                        walking commuters (1.4 percent to 2.8 percent).
          as well as the range of forecasted walk commute

                                         Table 3: Existing and Forecasted Commute Walk Mode Share

6 | Appendix A: Benefits Analysis
Wake County Greenway System Plan

Multipliers                                              to increased physical activity, decreased health-
                                                         care costs, and improved air quality.36 In addition,
Multipliers were developed through an analysis
                                                         studies show that increased physical activity helps
of the relationship between two or more model
                                                         seniors stay mentally fit,37 reduces the risk of
inputs, such as the number of vehicle-miles trav-
                                                         coronary heart disease, and even decreases the
eled and the cost of road maintenance. The model
                                                         amount of insulin needed by people with Type I
used for this study includes more than 50 multi-
                                                         diabetes.38
pliers in order to extrapolate annual trip rates, trip
distance, vehicle trips replaced, emission rates,        Health Calculations
physical activity rates, and other externalities
                                                         Alta Planning + Deisgn’s Benefit Impact Model
linked to increases in bicycling and walking trips
                                                         was used to evaluate and quantify an estimated
and decreases in motor vehicle trips. The factors
                                                         increase in bicycling and walking trips, an esti-
are conservative and based on guidance from the
                                                         mated increase in hours of physical activity, and
FHWA, AAA, and the most up-to-date research on
                                                         annual savings resulting from reduced healthcare
healthcare cost savings resulting from increased
                                                         costs. The primary inputs into the health compo-
physical activity.
                                                         nent of the Benefit Impact Model are derived from
Limitations                                              ACS journey to work data (2010-2014),39 National
                                                         Household Travel Survey data (2009),40 and
The primary purpose of the analysis is to enable
                                                         historic Safe Routes to School data from schools
a more informed discussion on whether and
                                                         across the United States 41. Existing bicycle and
how best to invest in a greenway system in Wake
                                                         walk commute data was multiplied by national trip
County. Even with extensive primary and second-
                                                         purpose ratios to generate mode share data that
ary research incorporated into the impact analysis
                                                         includes all trip purposes. This balanced mode
model, it is impossible to accurately predict the
                                                         share data was indexed against the mode share
exact impacts of various factors. Accordingly, all
                                                         data of Wake County’s seven peer counties and
estimated benefit values are rounded and should
                                                         multiplied by various health factors.
be considered order of magnitude estimates,
rather than exact amounts.                               The completed Wake County Greenway System
                                                         will dramatically shape the ability of residents
HEALTH AND ENVIRONMENTAL
                                                         in Wake County to get out and live more active,
BENEFITS
                                                         healthier lifestyles. The proposed greenway align-
Constructing a well-designed, connected green-           ment will help to generate between 7,167,000 and
way system across Wake County will encourage             43,686,000 more bicycling and walking trips, spur
a shift from energy-intensive modes of transpor-         586,000 to 4,325,000 new hours of physical activ-
tation such as cars and trucks to active modes           ity, and encourage 4,500 to 33,100 more people
of transportation such as bicycling and walking.         to meet the Centers for Disease Control and
While many of the active living-related benefits         Prevention’s recommended hours of physical activ-
of a greenway system – such as improved mental           ity. This boost to wellness will help save between
health, educational growth, connection to nature,        $768,000 and $6,146,000 in regional healthcare
and sense of place – can be difficult to quantify,       expenses per year. Table 4 summarizes the annual
a growing body of literature links parks and trails      health benefits for the study area.

                                                                                          Appendix A: Benefits Analysis | 7
Wake County Greenway System Plan

                                                   Table 4: Annual Health Benefits

          Environmental Calculations                                 pounds of other vehicle emissions. These addi-
                                                                     tional environmental benefits will help Wake
          Using the estimate of vehicle miles traveled (VMT)
                                                                     County save between $79,000 and $911,000 per
          reductions calculated in the health benefits
                                                                     year (see Table 5). Other potential ecological
          component of the analysis, changes in hydrocar-
                                                                     services associated with the trail projects such as
          bon, particulate matter, nitrous oxides, carbon
                                                                     water regulation, carbon sequestration, carbon
          monoxide, and carbon dioxide were analyzed.
                                                                     storage, and waste treatment exist, but the quanti-
          The replacement of motor vehicle trips with active
                                                                     fiable value of these services are negligible on the
          transportation trips may result in 3,150,000 to
                                                                     overall impact of the recommended project list.
          73,173,000 fewer pounds of CO2 emissions per
          year and between 77,000 and 883,000 fewer

8 | Appendix A: Benefits Analysis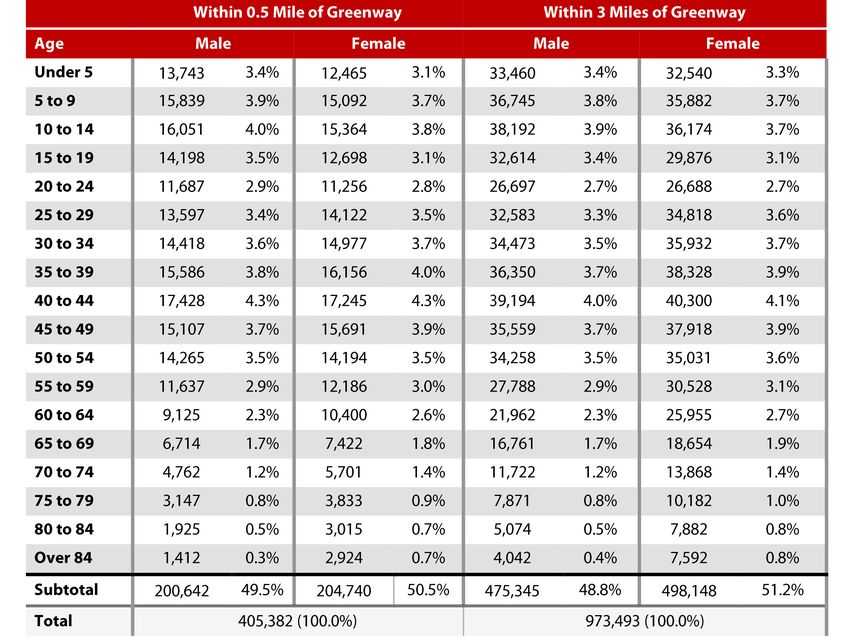
Wake County Greenway System Plan

                                               Table 5: Annual Environmental Benefits

         TRANSPORTATION BENEFITS                                     Transportation Calculations

         The most readily-identifiable benefits of the Wake          Using the same annual VMT reduction estimates
         County Greenway System or any large trail network           highlighted in the health and environmental
         derive from their use as a transportation corridor.         components of the analysis, transportation-re-
         While no money changes hands, real savings can              lated cost savings were calculated by multiplying
         be estimated from the reduced costs associated              VMT reduced by established multipliers for traffic
         with congestion, vehicle crashes, road mainte-              congestion, vehicle collisions, road maintenance,
         nance, and household vehicle operations.                    and vehicle operating costs. In total, an annual
                                                                     transportation cost savings between $2,741,000
                                                                     and $31,588,000 is estimated for the countywide
                                                                     greenway system (See Table 6).

                                               Table 6: Annual Transportation Benefits

9 | Chapter 2: Existing Conditions                                                                     Greenway
                                                                                                    Appendix    Plan Public
                                                                                                             A: Benefits    Workshop
                                                                                                                         Analysis | 9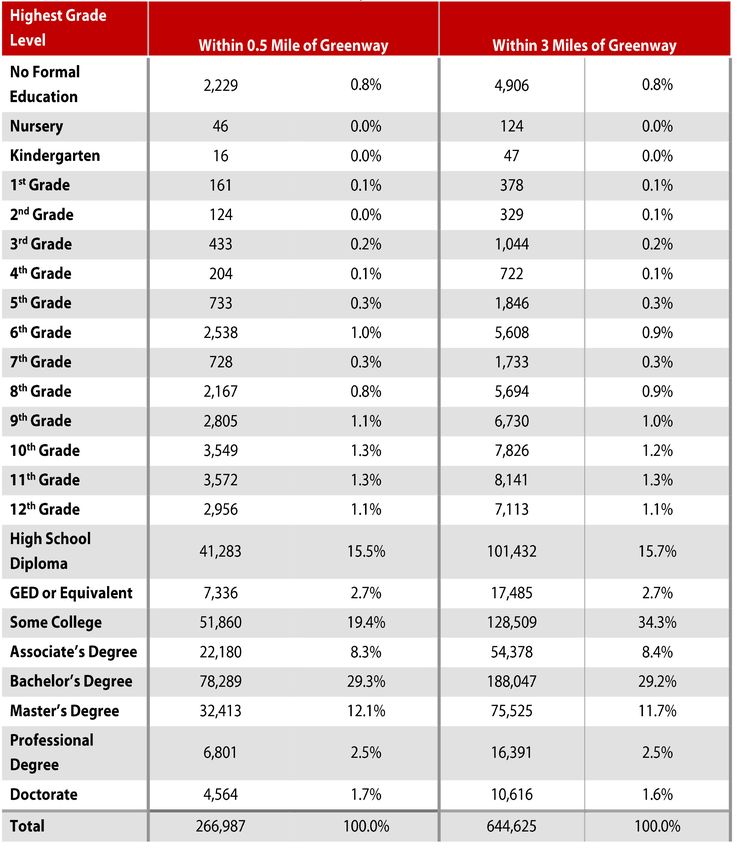
Wake County Greenway System Plan

          TOTAL BENEFITS                                                   to low, medium, and high projections that are
                                                                           based on the performance of Wake County’s peer
          Table 7 summarizes the total health, environ-
                                                                           communities.
          mental, and transportation benefits estimated
          to result from the full build-out of the Wake                    All estimated benefit values should be considered
          County Greenway System. In total, the greenway is                order of magnitude estimates, rather than exact
          expected to produce between $3,588,000 million                   amounts. The magnitude of difference in the low
          and $38,645,000 in additional benefits per year.                 to high ranges is rooted in the use of the 25th,
          Table 7 summarizes the indirect or non-reoccur-                  50th, and 75th percentile mode shares of the
          ring benefits associated with construction of the                peer communities as points of comparison. They
          trail network.                                                   vary substantially because the peer communities
                                                                           include two that are relatively high-performing in
          Summary/Conclusion
                                                                           terms of bicycle and pedestrian infrastructure:
          This analysis uses a standard methodology for                    Hennepin County and King County, which include
          calculating health, environmental, economic, and                 bicycle- and pedestrian-friendly Minneapolis and
          transportation-related benefits. All projections                 Seattle, respectively. However, Wake County
          are based on estimates of the number of people                   and its municipalities should (and could)
          who walk and bike to work in Wake County, as                     reach the goal of performing to at least
          compared to those who drive or take the bus,                     the 50th percentile of all seven of the peer
          for example. The different numbers of people                     communities examined, resulting in bene-
          that take different modes of travel to work is                   fits reflected in the mid-range of estimates.
          referred to as “mode share”, which is reported in                For example, Wake County and its municipalities
          the American Community Survey (ACS). These                       already have an extensive system of existing
          mode share figures are then used in a calcula-                   greenways on the ground, but there is much room
          tion of the number of total trips taken by walking               for improvement in terms of connectivity between
          and bicycling (for both work and non-work trips),                trails and between town centers and other des-
          through the use of various multipliers derived from              tinations. The Wake County Greenway System
          national studies. These estimates of total trips                 Plan is designed to address those issues, making
          taken by walking and bicycling are then quantified               walking and bicycling for both transportation and
          in terms of their monetary value, where appro-                   recreation more accessible, practical, and enjoy-
          priate. The estimated monetary values (benefits)                 able for more people.
          are then totaled for Wake County, and compared

                                                    Table 7: Total Annual Benefits

                                                          Wake County and its municipalities should (and could) reach the goal of performing to
                                                          at least the 50th percentile of all seven of the peer communities examined

10 | Appendix A: Benefits Analysis
Wake County Greenway System Plan
IIt also important to note that there are many
benefits of a connected and comprehensive
greenway system in addition to those calculated
in this analysis. These include protected wildlife
habitat, water quality protection from the preser-
vation of vegetated buffers along waterways, the
mental health benefits and reduced stress from
increased exercise and spending time in nature,
the positive impacts of access to parks and green-
ways on property values and quality of life, and the
potential for increases in tourism associated with a
world-class system of greenways.
ADDITIONAL TABLES
• Table 8: Age and Gender (ACS, 2010-2014)
• Table 9: Self-identified Race of Individuals (ACS,
2010-2014)
• Table 10: Commute Mode Share of Employed
Individuals, 16 years or older (ACS, 2010-2014)
• Table 11: Average Travel Time of Commute
Trips - All Modes (ACS, 2010-2014)
• Table 12: Time Leaving Home to go to Work
(ACS, 2010-2014)
• Table 13: Educational Attainment for the
Population 25 Years and Older (ACS,
2010-2014)
• Table 14: Income and Equity (ACS, 2010-2014)
Appendix A: Benefits Analysis | 11Wake County Greenway System Plan
Table 8: Age and Gender (ACS,2010-2014)
12 | Appendix A: Benefits AnalysisWake County Greenway System Plan
Table 9: Self-identified Race of Individuals (ACS,2010-2014)
Appendix A: Benefits Analysis | 13Wake County Greenway System Plan
Table 10: Commute Mode Share of Employed Individuals, 16 years or older (ACS,2010-2014)
Table 11: Average Travel Time of Commute Trips - All Modes (ACS,2010-2014)
14 | Appendix A: Benefits AnalysisWake County Greenway System Plan
Table 12: Time Leaving Home to go to Work (ACS,2010-2014)
Appendix A: Benefits Analysis | 15Wake County Greenway System Plan
Table 13: Educational Attainment for the Population 25 Years and Older (ACS,2010-2014)
16 | Appendix A: Benefits AnalysisWake County Greenway System Plan
Table 14: Income and Equity (ACS,2010-2014)
Appendix A: Benefits Analysis | 17Wake County Greenway System Plan
NOTES AND SOURCES bikeleague.org/sites/default/files/BFC_Master_
1. In addition to the approximately 145 miles of Spring_2015.pdf>
existing trail identified as part of the county- 10. The City of Raleigh (NC) and Cary (NC) receive
wide greenway system, there are approxi- a bronze-level Bicycle Friendly Community
mately 150 miles of additional existing trails Award for 2015
in outside of that system, mainly consisting
11. The City of Cary (NC) received a bronze-level
of smaller local trails, and smaller trails within
Walk Friendly Community Award for 2015
parks.
12. The City of Sacramento (CA) receive a sil-
2. Hunter, W. W., Srinivasan, R., and C. Martel
ver-level Bike Friendly Community Award for
(2009). “An Examination of Bicycle Counts and
2015
Speeds Associated with the Installation of Bike
Lanes in St. Petersburg, Florida.” http://www. 13. The City of Rancho Cordova (CA) received
stpete.org/transportation/citytrails/docs/ a bronze-level Bicycle Friendly Community
Examination_of_bicycle_counts_and_speeds_ Award for 2015
associated_with_bike_lanes.pdf
14. The City of Minneapolis (MN) received a gold-
3. Regional Plan Association (1997). “Building level Walk Friendly Community Award in 2015
Transit-Friendly Communities: A Design
15. The City of Minneapolis (MN) received a gold-
and Development Strategy for the Tri-State
level Bicycle Friendly Community Award for
Metropolitan Region.” http://www.rpa.org/pdf/
2015
tfc01.pdf
16. The City Edina (MN) received a bronze-level
4. Köppen Climate Classification System: Cfa
Bicycle Friendly Community Award for 2015
(humid subtropical), Csa /Csb (Mediterranean),
Dfa (Hot summer continental) 17. The City of Rancho Cordova (CA) received
an honorable mention as a Walk Friendly
5. US Census, American Community Survey, five-
Community in 2015
year estimates (2010-2014)
18. The City of St. Louis received a bronze-level
6. US Census, Quick Facts, Population (2010),
Bicycle Friendly Community Award for 2015
19. The City of Charlotte (NC) received a bronze-
7. US Census, Quick Facts, Population Density
level Bicycle Friendly Community Award for
(2010),
20. The City of Charlotte (NC) received a bronze-
8. “Current Bicycle Friendly Communities 2015.”
level Walk Friendly Community Award for 2015
The League of American Bicyclists. Bicycle Friendly Community Award for 2015
9. FHWA, UNC – Highway Safety Research 22. The City Austin (TX) received a bronze-level
Center, and FedEx (2015),Wake County Greenway System Plan
23. The City of Reston (VA) received a bronze-level and the 25th percentile walk mode share of
Bicycle Friendly Community Award for 2015 the seven selected peer counties
24. The City of Reston (VA) received an honorable 34. The mid estimate for future walk commute
mention as a Walk Friendly Community in 2015 mode share is the difference between Wake
County’s existing walk commute mode share
25. The City of Seattle (WA) received a gold-level
and the 50th percentile walk mode share of
Bicycle Friendly Community Award for 2015
the seven selected peer counties
26. The City of Redmond (WA) received a sil-
35. The high estimate for future walk commute
ver-level Bicycle Friendly Community Award for
mode share is the difference between Wake
2015
County’s existing walk commute mode share
27. The City of Bellevue (WA) received a bronze- and the 75th percentile walk mode share of
level Bicycle Friendly Community Award for the seven selected peer counties
2015
36.
2015
37.
Walk Friendly Community Award for 2015
38.
30. The low estimate for future bike commute
39. “When to use 1-year, 3-year, or 5-year
mode share is the difference between Wake
estimates.” US Census Bureau.
County’s existing bike commute mode share
seven selected peer counties
40.
31. The mid estimate for future bike commute
mode share is the difference between Wake 41.
seven selected peer counties
42. The Centers for Disease Control and
32. The high estimate for future bike commute Prevention recommend 150 minutes of moder-
mode share is the difference between Wake ate intensity aerobic activity (i.e., brisk walking)
County’s existing bike commute mode share for adults every week.
the seven selected peer counties
43. Other vehicle emissions include hydrocarbons,
33. The low estimate for future walk commute particulate matter, nitrous oxides, and carbon
mode share is the difference between Wake monoxide
County’s existing walk commute mode share
Appendix A: Benefits Analysis | 19Wake County Greenway System Plan B Funding Resources For more on funding strategies for this plan, refer to pages 128-132 of the main document. Stakeholders learning about trail system funding strategies from accross the U.S. 20 | Appendix B: Funding Resources
Wake County Greenway System Plan

OVERVIEW                                               nomic Recovery (TIGER), Surface Transportation
                                                       Program (STP), Congestion Mitigation and Air
When considering possible funding sources for
                                                       Quality (CMAQ), and Highway Safety Improve-
bicycle, pedestrian, and greenway trail projects, it
                                                       ment Program (HSIP) - and funding levels be-
is important to remember that not all construc-
                                                       tween highways and transit.
tion activities or programs can be accomplished
with a single funding source. It will be necessary
                                                       In North Carolina, federal monies are adminis-
to consider many sources of funding that togeth-
                                                       tered through the North Carolina Department
er will support full project completion. Funding
                                                       of Transportation (NCDOT) and Metropolitan
sources can be used for a variety of activities,
                                                       Planning Organizations (MPOs). Most, but not all,
including: programs, planning, design, imple-
                                                       of these programs are oriented toward trans-
mentation, and maintenance. This appendix
                                                       portation versus recreation, with an emphasis
outlines the most likely sources of funding from
                                                       on reducing auto trips and providing inter-modal
the federal, state, and local government levels as
                                                       connections. Federal funding is intended for cap-
well as from the private and non-profit sectors.
                                                       ital improvements and safety and education pro-
Note that this reflects the funding available at the
                                                       grams, and projects must relate to the surface
time of writing. Funding amounts, cycles, and the
                                                       transportation system. For more information,
programs themselves may change over time. For
                                                       visit: https://www.transportation.gov/fastact
more on funding strategies for this plan, refer to
pages 128-132 of the main document.
                                                       Transportation Alternatives

FEDERAL FUNDING SOURCES                                Transportation Alternatives (TA) is a funding
                                                       source under the FAST Act that consolidates
Federal funding is typically directed through
                                                       three formerly separate programs under SAFE-
state agencies to local governments either in the
                                                       TEA-LU: Transportation Enhancements (TE), Safe
form of grants or direct appropriations. Federal
                                                       Routes to School (SRTS), and the Recreational
funding typically requires a local match of five
                                                       Trails Program (RTP). These funds may be used
percent to 50 percent, but there are sometimes
                                                       for a variety of pedestrian, bicycle, and street-
exceptions. The following is a list of possible
                                                       scape projects including sidewalks, bikeways,
Federal funding sources that could be used to
                                                       multi-use paths, and rail-trails. TA funds may
support construction of pedestrian and bicycle
                                                       also be used for selected education and encour-
improvements.
                                                       agement programming such as Safe Routes to
                                                       School, despite the fact that TA does not provide
Fixing America’s Surface Transportation                a guaranteed set-aside for this activity as SAFE-
(FAST Act)                                             TEA-LU did.
In December 2015, President Obama signed the
FAST Act into law, which replaces the previous         Funding for the Surface Transportation Block
Moving Ahead for Progress in the Twenty-First          Grant Program (STPBG) will grow from the cur-
Century (MAP-21). The Act provides a long-term         rent level of $819 million per year to $835 million
funding source of $305 billion for surface trans-      in 2016 and 2017 and to $850 million in 2018
portation and planning for FY 2016-2020. Overall,      through 2020.
the FAST Act retains eligibility for big programs
- Transportation Investments Generating Eco-

                                                                                     Appendix B: Funding Resources | 21
Wake County Greenway System Plan
The FAST Act provides $84 million for the Recre- Highway Safety Improvement Program
ational Trails Program. Funding is prorated among
HSIP provides $2.4 billion for projects and pro-
the 50 states and Washington D.C. in proportion
grams that help communities achieve significant
to the relative amount of off-highway recreation-
reductions in traffic fatalities and serious inju-
al fuel tax that its residents paid. To administer
ries on all public roads, bikeways, and walkways.
the funding, states hold a statewide competitive
Bicycle and pedestrian safety improvements,
process. The legislation stipulates that funds must
enforcement activities, traffic calming projects,
conform to the distribution formula of 30% for
and crossing treatments for non-motorized users
motorized projects, 30% for non-motorized proj-
in school zones are eligible for these funds. For
ects, and 40% for mixed used projects. Each state
more information: http://www.fhwa.dot.gov/
governor is given the opportunity to “opt out” of
fastact/factsheets/hsipfs.cfm
the RTP. For the complete list of eligible activities,
visit: http://www.fhwa.dot.gov/fastact/factsheets/
Congestion Mitigation/Air Quality Program
stbgfs.cfm. For funding levels, visit: http://trade.
The Congestion Mitigation/Air Quality Improve-
railstotrails.org/index.
ment Program (CMAQ) provides funding for
projects and programs in air quality non-attain-
Surface Transportation Program
ment and maintenance areas for ozone, carbon
The Surface Transportation Program (STP) pro-
monoxide, and particulate matter which reduce
vides states with flexible funds which may be used
transportation related emissions. States with no
for a variety of highway, road, bridge, and transit
non-attainment areas may use their CMAQ funds
projects. A wide variety of pedestrian improve-
for any CMAQ or STP eligible project. These federal
ments are eligible, including trails, sidewalks,
dollars can be used to build bicycle and pedestrian
crosswalks, pedestrian signals, and other ancillary
facilities that reduce travel by automobile. Purely
facilities. Modification of sidewalks to comply with
recreational facilities generally are not eligible.
the requirements of the Americans with Disabil-
Communities located in attainment areas who do
ities Act (ADA) is also an eligible activity. Unlike
not receive CMAQ funding apportionments may
most highway projects, STP-funded pedestrian fa-
apply for CMAQ funding to implement projects
cilities may be located on local and collector roads
that will reduce travel by automobile. For more
which are not part of the Federal-aid Highway
information: hhttp://www.fhwa.dot.gov/fastact/
System. 50 percent of each state’s STP funds are
factsheets/cmaqfs.cfm
allocated by population to the MPOs; the remain-
ing 50 percent may be spent in any area of the
state. For more information, visit http://www.fhwa.
dot.gov/specialfunding/stp/
22 | Appendix B: Funding ResourcesWake County Greenway System Plan
Federal Transit Administration Enhanced OTHER FEDERAL FUNDING SOURCES
Mobility of Seniors and Individuals with
Disabilities Partnership for Sustainable Communities
This program can be used for capital expenses
Founded in 2009, the Partnership for Sustain-
that support transportation to meet the special
able Communities (PSC) is a joint project of the
needs of older adults and persons with disabili-
Environmental Protection Agency (EPA), the U.S.
ties, including providing access to an eligible pub-
Department of Housing and Urban Development
lic transportation facility when the transportation
(HUD), and the U.S. Department of Transporta-
service provided is unavailable, insufficient, or
tion (USDOT). The partnership aims to “improve
inappropriate to meeting these needs. For more
access to affordable housing, more transpor-
information: https://www.transit.dot.gov/funding/
tation options, and lower transportation costs
grants/enhanced-mobility-seniors-individuals-dis-
while protecting the environment in communities
abilities-section-5310
nationwide.”
Safe Routes to School (SRTS) Program The Partnership is based on five Livability Princi-
SRTS enables and encourages children to walk ples, one of which explicitly addresses the need
and bike to school. The program helps make for bicycle and pedestrian infrastructure (“Provide
walking and bicycling to school a safe and more more transportation choices: Develop safe, reli-
appealing method of transportation for children. able, and economical transportation choices to
SRTS facilitates the planning, development, and decrease household transportation costs, reduce
implementation of projects and activities that will our nation’s dependence on foreign oil, improve
improve safety and reduce traffic, fuel consump- air quality, reduce greenhouse gas emissions,
tion, and air pollution in the vicinity of schools. and promote public health”). The Partnership is
Most of the types of eligible SRTS projects include not a formal agency with a regular annual grant
sidewalks or a shared-use path. However, inter- program. Nevertheless, it is an important effort
section improvements (i.e. signalization, marking/ that has already led to some new grant oppor-
upgrading crosswalks, etc.), on street bicycle tunities (including both TIGER I and TIGER II
facilities (bike lanes, wide paved shoulders, etc.) grants). North Carolina jurisdictions should track
or off-street shared-use paths are also eligible for Partnership communications and be prepared to
SRTS funds. respond proactively to announcements of new
grant programs. Initiatives that speak to multi-
For more information: http://saferoutespartner- ple livability goals are more likely to score well
ship.org/healthy-communities/policy-change/ than initiatives that are narrowly limited in scope
federal/FAST-act-background-resources to pedestrian improvement efforts. PSC 2015
Priorities include: using PSC agency resources to
advance Ladders of Opportunity for every Amer-
ican and every community; helping communities
adapt to a changing climate, while mitigating fu-
ture disaster losses; and supporting implementa-
tion of community-based development priorities.
Appendix B: Funding Resources | 23Wake County Greenway System Plan
For more information: ation between agencies, serving a large number of
users, encouraging public involvement in plan-
http://www.sustainablecommunities.gov/ ning and implementation, and focusing on lasting
accomplishments. This program may benefit trail
http://www2.epa.gov/smart-growth/ development in North Carolina locales indirectly
hud-dot-epa-partnership-sustainable-communities through technical assistance, particularly for com-
munity organizations, but is not a capital funding
Resource for Rural Communities: http://www.sus- source. Annual application deadline is August 1st.
tainablecommunities.gov/sites/sustainablecommu- For more information: http://www.nps.gov/ncrc/
nities.gov/files/docs/federal_resources_rural.pdf programs/rtca/ or contact the Southeast Region
RTCA Program Manager Deirdre “Dee” Hewitt at
Federal Land and Water Conservation (404) 507- 5691
Fund
The Land and Water Conservation Fund (LWCF) National Scenic Byways Discretionary
provides grants for planning and acquiring out- Grant Program
door recreation areas and facilities, including trails. The National Scenic Byways Discretionary Grants
Funds can be used for right-of-way acquisition program provides merit-based funding for by-
and construction. The program is administered way-related projects each year, utilizing one or
by the Department of Environment and Natural more of eight specific activities for roads designat-
Resources as a grant program for states and local ed as National Scenic Byways, All-American Roads,
governments. Maximum annual grant awards for State scenic byways, or Indian tribe scenic byways.
county governments, incorporated municipali- The activities are described in 23 USC 162(c). This
ties, public authorities, and federally recognized is a discretionary program; all projects are select-
Indian tribes are $250,000. The local match may ed by the US Secretary of Transportation.
be provided with in-kind services or cash. For
more information: http://www.ncparks.gov/About/ Eligible projects include construction along a
grants/lwcf_main.php scenic byway of a facility for pedestrians and bi-
cyclists and improvements to a scenic byway that
Rivers, Trails, and Conservation Assistance will enhance access to an area for the purpose
Program of recreation. Construction includes the develop-
ment of the environmental documents, design,
The Rivers, Trails, and Conservation Assistance
engineering, purchase of right-of-way, land, or
Program (RTCA) is a National Parks Service (NPS)
property, as well as supervising, inspecting, and
program providing technical assistance via direct
actual construction. For more information: http://
NPS staff involvement to establish and restore
www.bywaysonline.org/grants/
greenways, rivers, trails, watersheds and open
space. The RTCA program provides only for
planning assistance—there are no implementa-
tion funds available. Projects are prioritized for
assistance based on criteria including conserving
significant community resources, fostering cooper-
24 | Appendix B: Funding ResourcesWake County Greenway System Plan
Energy Efficiency and Conservation Block Economic Development Administration
Grants Under Economic Development Administration’s
The Department of Energy’s Energy Efficiency and (EDA) Public Works and Economic Adjustment
Conservation Block Grants (EECBG) may be used Assistance programs, grant applications are
to reduce energy consumptions and fossil fuel accepted for construction, non-construction,
emissions and for improvements in energy effi- technical assistance, and revolving loan fund proj-
ciency. Section 7 of the funding announcement ects. “Grants and cooperative agreements made
states that these grants provide opportunities for under these programs are designed to leverage
the development and implementation of trans- existing regional assets and support the imple-
portation programs to conserve energy used in mentation of economic development strategies
transportation including development of infra- that advance new ideas and creative approaches
structure such as bike lanes and pathways and to advance economic prosperity in distressed
pedestrian walkways. Although the current grant communities.” Application deadlines are typically
period has passed, more opportunities may arise in March and June. For more information: http://
in the future. For more information: http://www1. www.eda.gov/funding-opportunities/files/2015-
eere.energy.gov/wip/eecbg.html EDAP-FFO-Fact-Sheet.pdf
TIGER Discretionary Grants Historic Preservation Fund Grants
The U.S. Department of Transportation’s (DOT) The State, Tribal, and Local Plans & Grants
Transportation Investment Generating Economic (STLPG) division manages several grant programs
Recovery (TIGER) discretionary grants are in- to assist with a variety of historic preservation
tended to fund capital investments in surface and community projects focused on heritage
transportation infrastructure. The grant pro- preservation. For more information on the dif-
gram focuses on “capital projects that generate ferent grant programs visit: http://www.nps.gov/
economic development and improve access to preservation-grants/
reliable, safe, and affordable transportation for
disconnected both urban and rural, while em- Environmental Contamination Cleanup
phasizing improved connection to employment, Funding Sources
education, services and other opportunities,
EPA’s Brownfields Program provides direct fund-
workforce development, or community revital-
ing for brownfields assessment, cleanup, revolv-
ization.” Infrastructure improvement projects
ing loans, and environmental job training. EPA’s
such as recreational trails and greenways with an
Brownfields Program collaborates with other
emphasis on multi-modal transit qualify for this
EPA programs, other federal partners, and state
grant. Pre-Application deadlines are typically in
agencies to identify and leverage more resources
May, with final application deadlines in June. For
for brownfields activities. Technical assistance
more information: http://www.dot.gov/tiger
relating to brownfields financing is an additional
service provided. For more information: http://
epa.gov/brownfields/grant_info/index.htm
Appendix B: Funding Resources | 25Wake County Greenway System Plan
National Fish and Wildlife Foundation: »» Support community-based conservation
Five Star & Urban Waters Restoration projects that protect and restore local habi-
Grant Program tats and natural areas, enhance water quality,
promote urban forestry, educate and train
The Five Star & Urban Waters Restoration Grant
community leaders on sustainable practices,
Program seeks to develop community capacity to
promote related job creation and training, and
sustain local natural resources for future genera-
engage diverse partners and volunteers.
tions by providing modest financial assistance to
diverse local partnerships for wetland, riparian,
»» Support visible and accessible demonstration
forest and coastal habitat restoration, urban wild-
projects that showcase innovative, cost-effec-
life conservation, stormwater management as well
tive and environmentally-friendly approaches
as outreach, education and stewardship. Projects
to improve environmental conditions within
should focus on water quality, watersheds and
urban communities by ‘greening’ traditional
the habitats they support. NFWF may use a mix
infrastructure and public projects such as
of public and private funding sources to support
storm water management and flood control,
any grant made through this program. Request
public park enhancements, and renovations
for proposals application are typically due in late
to public facilities.
January/early February. For more information:
http://www.nfwf.org/fivestar/Pages/home.aspx#.
»» Support projects that increase the resiliency
VS_eq_nF-Bw
of the Nation’s coastal communities and eco-
systems by restoring coastal habitats, living
Environmental Solutions for Communities
resources, and water quality to enhance liveli-
Grant Program
hoods and quality of life in these communities.
The National Fish and Wildlife Foundation (NFWF)
and Wells Fargo seek to promote sustainable
»» In North Carolina, strong preference will be
communities through Environmental Solutions for
given to projects located in the regions of
Communities by supporting highly-visible projects
Charlotte, Raleigh, or Winston Salem.
that link economic development and community
well-being to the stewardship and health of the For more information: http://www.nfwf.org/envi-
environment. Priority for grants to projects that ronmentalsolutions/Pages/2015rfp.aspx#.VS-
successfully address one or more of the following: 8SPnF-Bw
»» Support innovative, cost-effective programs
that enhance stewardship on private agri-
cultural lands to enhance water quality and
quantity and/or improve wildlife habitat for
species of concern, while maintaining or in-
creasing agricultural productivity.
26 | Appendix B: Funding ResourcesWake County Greenway System Plan
STATE FUNDING SOURCES before then will proceed as scheduled under
the current Equity Formula. Projects slated for
There are multiple sources for state funding of
bicycle and pedestrian transportation projects.
construction after that time will be ranked and
However, beginning July 1, 2015, state transpor- programed according to the new formula. The
tation funds cannot be used to match federal- new Strategic mobility formula assigns projects
ly-funded transportation projects, according to for all modes into one of three categories: 1)
a law passed by the North Carolina Legislature. Statewide Mobility, 2) Regional Impact, and 3)
Division Needs.
North Carolina Department of
Transportation (NCDOT) Strategic All independent bicycle and pedestrian projects
Transportation Investments (STI) are placed in the “Division Needs” category, and
The NCDOT’s State Transportation Improve- are currently ranked based on 50% data (safety,
ment Program is based on the Strategic Trans- access, demand, connectivity, and cost effective-
portation Investments Bill, signed into law in ness) and 50% local input, with a breakdown as
2013. The Strategic Transportation Investments
follows:
(STI) Initiative introduces the Strategic Mobil-
ity Formula, a new way to fund and prioritize
transportation projects. Safety 15%
»» Definition: Projects or improvements where
The new Strategic Transportation Investments bicycle or pedestrian accommodations are
Initiative is scheduled to be fully implemented by non-existent or inadequate for safety of
July 1, 2015. Projects scheduled for construction users
How the STI Works
(Source: NCDOT Bicycle and Pedestrian Prioritization, June 2015)
Appendix B: Funding Resources | 27Wake County Greenway System Plan
»» How it’s measured: Crash history, posted Local Input 50%
speed limits, and estimated safety benefit
»» Definition: Input from MPO/RPOs and NCDOT
»» Calculation:
Divisions, which comes in the form points
»» Bicycle/pedestrian crashes along the corridor
assigned to projects.
within last five years: 40% weight
»» How it is measured: Base points + points for
»» Posted speed limits, with higher points for
population size. A given project is more likely
higher limits: 40% weight
to get funded if it is assigned base points from
»» Project safety benefit, measured by each spe-
both the MPO/RPO and the Division, making
cific improvement: 20% weight
the need for communicating the importance
of projects to these groups critical. Further,
Access 10% projects that have a local match will score
»» Definition: Destinations that draw or generate higher.
high volumes of bikes/pedestrians
»» How it’s measured: Type of and distance to Additional bicycle and pedestrian project
destination requirements:
»» Federal funding typically requires a 20%
Demand 10% non-federal match
»» Definition: Projects serving large resident or »» State law prohibits state match for bicycle and
employee user groups pedestrian projects (except for Powell Bill)
»» How its measured: # of households and »» Limited number of project submittals per
employees per square mile within 1 ½ mile MPO/RPO/Division
bicycle or ½ mile pedestrian facility + factor for »» Minimum project cost requirement is
unoccupied housing units (second homes) $100,000
»» Bike/Ped projects typically include: bicy-
Connectivity 10% cle lanes, multi-use path/greenway, paved
shoulders, sidewalks, pedestrian signals, SRTS
»» Definition: Measure impact of project on reli-
infrastructure projects, and other streetscape/
ability and quality of network
multi-site improvements (such as median
»» How it’s measured: Creates score per each SIT
refuge, signage, etc.)
based on degree of bike/ped separation from
roadway and connectivity to similar or better
These rankings largely determine which projects
project type
will be included in NCDOT’s State Transportation
Improvement Program (STIP). The STIP is a feder-
Cost Effectiveness 5%
ally mandated transportation planning document
»» Definition: Ratio of calculated user benefit that details transportation planning improvements
divided by NCDOT project cost prioritized by the stakeholders for inclusion in
»» How it’s measured: Safety + Demand + Access NCDOT’s Work Program over the next 10 years.
+ Connectivity)/Estimated Project Cost to More than 900 non-highway construction projects
NCDOT were prioritized for years 2015-2020, totaling an
estimated $9 billion. NCDOT will only have an
estimated $1.5 billion to spend during this time
period.
28 | Appendix B: Funding ResourcesWake County Greenway System Plan
The STIP is updated every 2 years. The STIP con- NCDOT to identify where bike and pedestrian
tains funding information for various transporta- improvements are needed, and can be included
tion divisions of NCDOT, including, highways, rail, as part of highway or street improvement project.
bicycle and pedestrian, public transportation and It also helps local government identify what their
aviation. For more information on STIP: www. priorities are and how they might be able to pay
ncdot.gov/strategictransportationinvestments/ for these projects. Under “Complete Streets” local
governments may be responsible for a portion of
To access the STIP: https://connect.ncdot.gov/ the costs for bicycle and pedestrian projects. For
projects/planning/Pages/State-Transportation-Im- more information: http://www.ncdot.gov/bikeped/
provement-Program.aspx funding/process/
For more about the STI process: http://www. Duke Energy Water Resources Fund
ncdot.gov/download/performance/performance_
Duke Energy is investing $10 million in a fund for
TheProcess.pdf
projects that benefit waterways in the Carolinas.
The fund supports science-based, research-sup-
ported projects and programs that provide direct
Incidental Projects
benefit to at least one of the following focus
Bicycle and Pedestrian accommodations such as;
areas:
bike lanes, wide paved shoulders, sidewalks, in-
tersection improvements, bicycle and pedes trian »» Improve water quality, quantity and conser-
safe bridge design, etc. are frequently included as vation;
“incidental” features of larger highway/roadway »» Enhance fish and wildlife habitats;
projects. This is increasingly common with the »» Expand public use and access to waterways;
adoption of NCDOT’s “Complete Streets” Policy. and
»» Increase citizens’ awareness about their roles
In addition, bicycle safe drainage grates and in protecting these resources.
handicapped accessible sidewalk ramps are
now a standard feature of all NCDOT highway Newport could consider this resource for its pro-
construction. Most pedestrian safety accom- posed creekside greenways. For more informa-
modations built by NCDOT are included as part tion: http://www.duke-energy.com/community/
foundation/water-resources-fund.asp
of scheduled highway improvement projects
funded with a combination of federal and state
roadway construction funds, and usually with a Clean Water Management Trust Fund
local match. On-road bicycle accommodations, if The Clean Water Management Trust Fund is
warranted, typically do not require a local match. available to any state agency, local government,
or non-profit whose primary purpose is the con-
“Incidental Projects” are often constructed as servation, preservation, and restoration of North
part of a larger transportation project, when Carolina’s environmental and natural resources.
they are justified by local plans that show these Grant assistance is provided to conservation
improvements as part of a larger, multi-modal projects that:
transportation system. Having a local bicycle or
pedestrian plan is important, because it allows
Appendix B: Funding Resources | 29Wake County Greenway System Plan
»» enhance or restore degraded waters; visible pavement markings), improved warning and
»» protect unpolluted waters, and/or regulatory signing, roadside safety improvements,
»» contribute toward a network of riparian school safety improvements, and safety appurte-
buffers and greenways for environmental, nances (like guardrail and crash attenuators).
educational, and recreational benefits;
»» provide buffers around military bases to pro- A Safety Oversight Committee (SOC) reviews and
tect the military mission; recommends Spot Safety projects to the Board
»» acquire land that represents the ecological of Transportation (BOT) for approval and funding.
diversity of North Carolina; and Criteria used by the SOC to select projects for
»» acquire land that contributes to the develop- recommendation to the BOT include, but are not
ment of a balanced State program of historic limited to, the frequency of correctable crashes,
properties. severity of crashes, delay, congestion, number of
signal warrants met, effect on pedestrians and
The application deadline is typically in February. schools, division and region priorities, and public
For more information: http://www.cwmtf.net/#ap- interest. For more information: https://connect.
pmain.htm ncdot.gov/resources/safety/Pages/NC-Highway-
Safety-Program-and-Projects.aspx
SPOT Safety Program
The Spot Safety Program is a state funded public Powell Bill Funds
safety investment and improvement program that Annually, State street-aid (Powell Bill) allocations
provides highly effective low cost safety improve- are made to incorporated municipalities which
ments for intersections, and sections of North Car- establish their eligibility and qualify as provided by
olina’s 79,000 miles of state maintained roads in G.S. 136-41.1 through 136-41.4. Powell Bill funds
all 100 counties of North Carolina. The Spot Safety shall be expended only for the purposes of main-
Program is used to develop smaller improvement taining, repairing, constructing, reconstructing or
projects to address safety, potential safety, and widening of local streets that are the responsibility
operational issues. The program is funded with of the municipalities or for planning, construction,
state funds and currently receives approximately and maintenance of bikeways or sidewalks along
$9 million per state fiscal year. Other monetary public streets and highways. Beginning July 1, 2015
sources (such as Small Construction or Contingen- under the Strategic Transportation Investments
cy funds) can assist in funding Spot Safety projects, initiative, Powell Bill funds may no longer be used
however, the maximum allowable contribution of to provide a match for federal transportation
Spot Safety funds per project is $250,000. funds such as Transportation Alternatives. Cer-
tified Statement, street listing, add/delete sheet
The Spot Safety Program targets hazardous loca- and certified map from all municipalities are due
tions for expedited low cost safety improvements between July 1st and July 21st of each year. Ad-
such as traffic signals, turn lanes, improved shoul- ditional documentation is due shortly after. More
ders, intersection upgrades, positive guidance information: https://connect.ncdot.gov/municipali-
enhancements (rumble strips, improved channel- ties/State-Street-Aid/Pages/default.aspx
ization, raised pavement markers, long life highly
30 | Appendix B: Funding ResourcesWake County Greenway System Plan
Highway Hazard Elimination Program community-based interventions that encourage,
promote, and facilitate physical activity. The current
The Hazard Elimination Program is used to devel-
focus of the funds is for projects addressing youth
op larger improvement projects to address safety
physical activity. Funds have been used to con-
and potential safety issues. The program is fund-
struct trails and conduct educational programs.
ed with 90 percent federal funds and 10 percent
For more information: http://www.eatsmartmove-
state funds. The cost of Hazard Elimination Pro-
morenc.com/Funding/Funding.html
gram projects typically ranges between $400,000
and $1 million. A Safety Oversight Committee
(SOC) reviews and recommends Hazard Elimi- The North Carolina Division of Parks and
nation projects to the Board of Transportation Recreation – Recreational Trails and Adopt-
(BOT) for approval and funding. These projects a-Trail Grants
are prioritized for funding according to a safety The North Carolina Division of Parks and Recre-
benefit to cost (B/C) ratio, with the safety benefit ation and the State Trails Program offer funds to
being based on crash reduction. Once approved help citizens, organizations and agencies plan,
and funded by the BOT, these projects become develop and manage all types of trails ranging from
part of the department’s State Transportation greenways and trails for hiking, biking, and horse-
Improvement Program (STIP). For more informa- back riding to river trails and off-highway vehicle
tion: https://connect.ncdot.gov/resources/safety/ trails. “The Adopt-a-Trail Grant Program (AAT)
Pages/NC-Highway-Safety-Program-and-Projects. awards $108,000 annually to government agencies,
aspx nonprofit organizations and private trail groups
Governor’s Highway Safety Program for trail projects. The Recreational Trails Program
(RTP) is a $1.3 million grant program funded by
The Governor’s Highway Safety Program
Congress with money from the federal gas taxes
(GHSP) funds safety improvement projects on
paid on fuel used by off-highway vehicles. Grant
state highways throughout North Carolina. All
applicants must be able to contribute 20% of the
funding is performance-based. Substantial prog-
project cost or in-kind contributions. Both grant
ress in reducing crashes, injuries, and fatalities
applications are typically due in January or Febru-
is required as a condition of continued funding.
ary. For more information: http://www.ncparks.
This funding source is considered to be “seed
gov/About/trails_grants.php
money” to get programs started. The grantee is
expected to provide a portion of the project costs
NC Parks and Recreation Trust Fund
and is expected to continue the program after
(PARTF)
GHSP funding ends. State Highway Applicants
must use the web-based grant system to submit The Parks and Recreation Trust Fund (PARTF)
applications. For more information: http://www. provide dollar-for-dollar matching grants to local
ncdot.org/programs/ghsp/ governments for parks and recreational projects
to serve the general public. Counties, incorporated
Eat Smart, Move More North Carolina municipalities, and public authorities, as defined by
Community Grants G.S. 159-7, are eligible applicants. A local govern-
ment can request a maximum of $500,000 with
The Eat Smart, Move More (ESMM) NC Commu-
each application. An applicant must match the
nity Grants program provides funding to local
grant dollar-for-dollar, 50 percent of the total cost
communities to support their efforts to develop
Appendix B: Funding Resources | 31Wake County Greenway System Plan
of the project, and may contribute more than 50 non-profit. At the end of each year, a minimum of
percent. The appraised value of land to be donated $30 million is placed in the CWMTF. The revenue
to the applicant can be used as part of the match. of this fund is allocated as grants to local govern-
The value of in-kind services, such as volunteer ments, state agencies, and conservation non-profits
work, cannot be used as part of the match. Grant to help finance projects that specifically address
applications are typically due in February. For more water pollution problems. Funds may be used for
information: http://www.ncparks.gov/About/grants/ planning and land acquisition to establish a net-
partf_main.php work of riparian buffers and greenways for envi-
ronmental, educational, and recreational benefits.
Community Development Block Grant Funds Deadlines are typically in February. For more infor-
mation: http://www.cwmtf.net/#appmain.htm
Community Development Block Grant (CDBG) funds
are available to local municipal or county govern-
Safe Routes to School (SRTS)
ments that qualify for projects to enhance the via-
bility of communities by providing decent housing SRTS is managed by NCDOT, but is federally fund-
and suitable living environments and by expanding ed; See Federal Funding Sources above for more
economic opportunities, principally for persons of information.
low and moderate income. State CDBG funds are
provided by the U.S. Department of Housing and Urban and Community Forestry Grant
Urban Development (HUD) to the state of North The North Carolina Division of Forest Resources
Carolina. Some urban counties and cities in North Urban and Community Forestry grant can pro-
Carolina receive CDBG funding directly from HUD. vide funding for a variety of projects that will help
Each year, CDBG provides funding to local govern- toward planning and establishing street trees as
ments for hundreds of critically-needed community well as trees for urban open space. The goal is to
improvement projects throughout the state. These improve public understanding of the benefits of
community improvement projects are adminis- preserving existing tree cover in communities and
tered by the Division of Community Assistance and assist local governments with projects which will
the Commerce Finance Center under eight grant lead to a more effective and efficient management
categories. Two categories might be of support of urban and community forests. Grant requests
to pedestrian and bicycle projects in ‘entitlement should range between $1,000 and $15,000 and
communities’: Infrastructure and Community Revi- must be matched equally with non-federal funds.
talization. More information: http://portal.hud.gov/ Grant funds may be awarded to any unit of local or
hudportal/HUD?src=/program_offices/comm_plan- state government, public educational institutions,
ning/communitydevelopment/programs approved non-profit 501(c)(3) organizations, and
other tax-exempt organizations. First time munic-
Clean Water Management Trust Fund ipal applicant and municipalities seeking Tree City
(CWMTF) USA status are given priority for funding. Grant
This fund was established in 1996 and has be- applications are due by March 31 at 5:00 pm and
come one of the largest sources of money in North recipients are notified by mid-July each year. For
Carolina for land and water protection, eligible for more about Tree City USA status, including appli-
application by a state agency, local government, or cation instructions, visit: http://ncforestservice.gov/
Urban/urban_grant_overview.htm
32 | Appendix B: Funding ResourcesYou can also read