A BRIEF OVERVIEW OF SHARK AND RAY FISHERIES AND TRADE IN SRI LANKA - With input from: XXXX
←
→
Page content transcription
If your browser does not render page correctly, please read the page content below
A BRIEF OVERVIEW OF
   SHARK AND RAY
FISHERIES AND TRADE
    IN SRI LANKA

      With input from: XXXX
A Brief Overview of Shark and Ray Fisheries and Trade | Sri Lanka

This report was written with input from:
Blue Resources Trust – Daniel Fernando
CNS Global Consulting

Acknowledgements:
We thank the research team and data analysts at Blue Resources Trust for their work that
contributed to the case study that demonstrates the scale and associated challenges of
monitoring and managing Sri Lankan fisheries. We are also grateful to those that helped review
this document.

Date of publication:
10th November 2021

How to cite this report:
Fernando, D., 2021. A brief overview of the shark and ray fisheries and trade in Sri Lanka. A
report by Blue Resources Trust. Available online at: https://www.blueresources.org/s/Sri-
Lanka-Shark-Ray-Fisheries-Trade_Report2021.pdf

                                           Page 2 of 74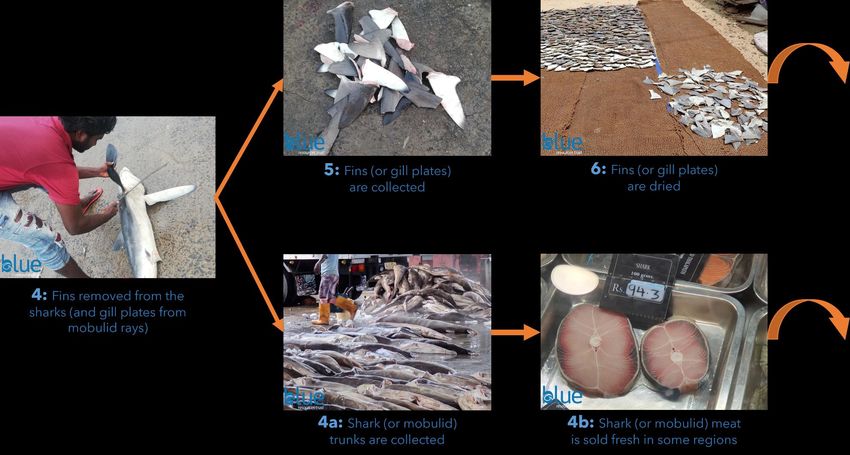
A Brief Overview of Shark and Ray Fisheries and Trade | Sri Lanka

Table of Contents

 List of Tables ..................................................................................................................................... 4
 List of Figures.................................................................................................................................... 6
 Executive Summary .......................................................................................................................... 7
 List of Abbreviations & Acronyms .................................................................................................. 9
 1.     General Overview of Sri Lankan Fisheries .......................................................................... 11
      1.1      A case study to highlight the scale of Sri Lankan fisheries ........................................ 14
 2.     Shark and Ray Fisheries in Sri Lanka ................................................................................... 17
      2.1      Overview ......................................................................................................................... 17
      2.2      Primary shark and ray species in Sri Lanka and their IUCN status............................ 22
      2.6      Brief overview of the economic benefits of shark fisheries for Sri Lanka ................ 28
      2.3      Shark and ray regulations in Sri Lanka (local and international)............................... 28
      2.5      Visual documentation of the shark fin process (from boat to exporter) .................. 38
 3.     Official Trade Data ................................................................................................................ 41
      3.1      Shark and ray exports and imports .............................................................................. 41
 4.     Potential Illegal Trade ........................................................................................................... 49
      4.1      Illegal cases linked to Sri Lanka .................................................................................... 49
      4.2      Cases under investigation by the Sri Lankan Government ....................................... 51
      4.3      Sri Lankan vessels or traders under investigation by other countries ..................... 54
      4.4      Other information and potential concerns ................................................................. 55
 5.     SWOT Analysis ....................................................................................................................... 60
 6.     Recommendations ................................................................................................................ 61
 7.     Appendix ................................................................................................................................ 65
      7.1      Vessel distribution in the 15 km survey (east coast of Sri Lanka). ............................ 65
      7.2      The Shark Fisheries Management Regulations 2015 ................................................ 69
      7.3      The Shark Fisheries Management (High seas) Regulations 2015 ............................ 71
      7.4      A list of companies that appear to export shark fins ................................................. 73

                                                                   Page 3 of 74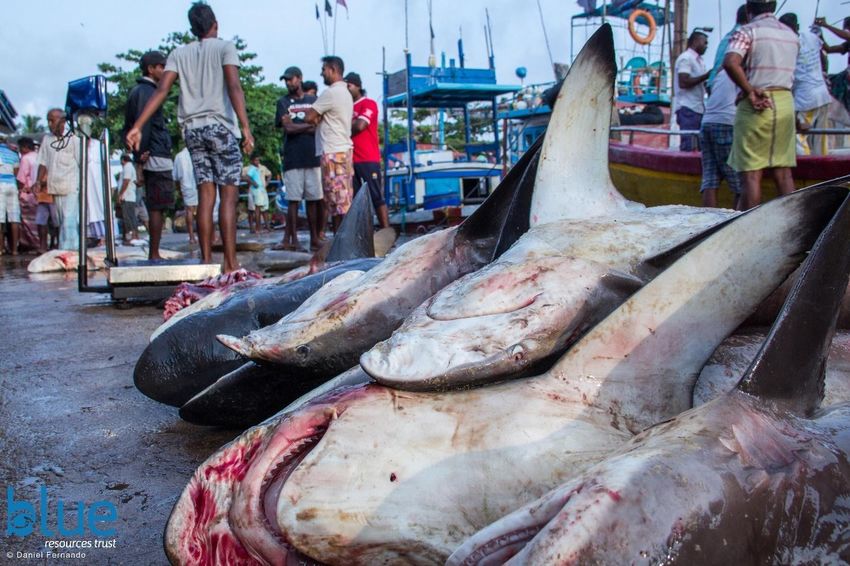
A Brief Overview of Shark and Ray Fisheries and Trade | Sri Lanka

List of Tables

Table 1: Fish production in Sri Lanka (2019) ................................................................................ 11

Table 2: Registered vessels and vessel type in Sri Lanka ............................................................ 12

Table 3: The number of Sri Lankan vessels operating in the high seas..................................... 12

Table 4: The vessel type, gear, target species, and other information available for
each sector of the 15 km survey. ..................................................................................................... 15

Table 5: Total catch, bycatch, of fish and sharks in Sri Lanka (2014 – 2016) ............................. 18

Table 6: The relative contribution of directed and non-directed shark catches in
Sri Lanka compared to entire Indian Ocean shark catch between 2014 and 2016 .................. 18

Table 7: The number of registered fishing vessels from 2010 to 2019 . IMUL operate within
and beyond the EEZ, while IDAY operate within the EEZ, and OFRP in coastal waters ........... 20

Table 8: Total non-directed shark catch by gear type, cumulative from 2014 – 2017 ............. 22

Table 9: Species counts for Sri Lanka, from a subset of checklists............................................. 23

Table 10: The IUCN Red List statuses of some of the more frequently encountered
shark and ray species in Sri Lanka................................................................................................... 24

Table 11: National landings of all recorded shark species in Sri Lanka (in tonnes):
2005 to 2015 ..................................................................................................................................... 25

Table 12: Total number and weight of sharks, by species, retained by the Sri Lankan
fleet in the IOTC area of competence from 2015 to 2019 ........................................................... 26

Table 13: The legal provisions and regulations for fisheries management in Sri Lanka
(that have a direct or indirect impact on shark and ray fisheries)................................................ 30

Table 14: CITES listed shark and ray species and presence in Sri Lanka .................................. 35

Table 15: CMS and the CMS Sharks MoU listed shark and ray species and presence
in Sri Lanka ......................................................................................................................................... 36

Table 16: Commodity codes in Sri Lanka ..................................................................................... 41

Table 17: Hong Kong shark fin imports from Sri Lanka 2017-2020........................................... 41

Table 18: Sri Lanka exports of dried shark fins (HS code 30571)............................................... 43

                                                                      Page 4 of 74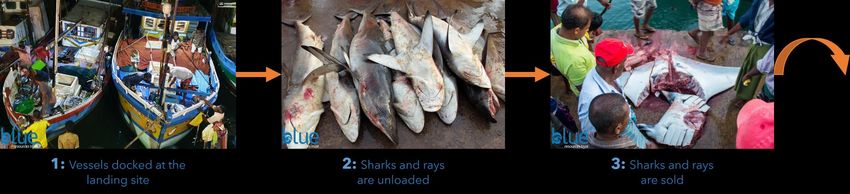
A Brief Overview of Shark and Ray Fisheries and Trade | Sri Lanka

Table 19: Imports and exports from Sri Lanka of shark products from 2015-2017, by type .. 43

Table 20: Sri Lanka CITES shark species exports 2014-2020 ..................................................... 44

Table 21: Discrepancies with other trade data sources .............................................................. 46

Table 22: Shark fins seizures in Hong Kong ................................................................................. 49

Table 23: TRAFFIC database seizures involving Sri Lanka.......................................................... 50

Table 24: Seizures related to sharks and rays conducted by Sri Lanka Coastguard ............... 51

Table 25: Some examples of reports highlighting IUU arrests and investigations
of Sri Lankan fishers. ......................................................................................................................... 54

Table 26: List of foreign vessels with regular visits in Dikkowita Fisheries Harbour
between March 2020 and March 2021 .......................................................................................... 57

Table 27: SWOT Analysis for Sri Lankan shark and ray fisheries................................................ 60

                                                                   Page 5 of 74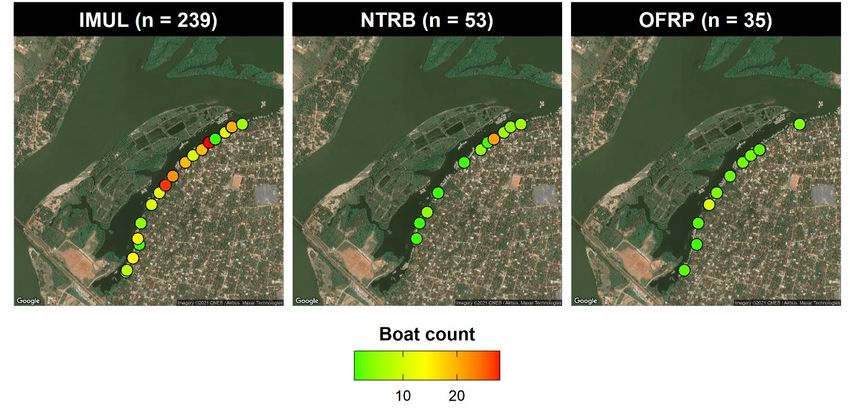
A Brief Overview of Shark and Ray Fisheries and Trade | Sri Lanka
List of Figures
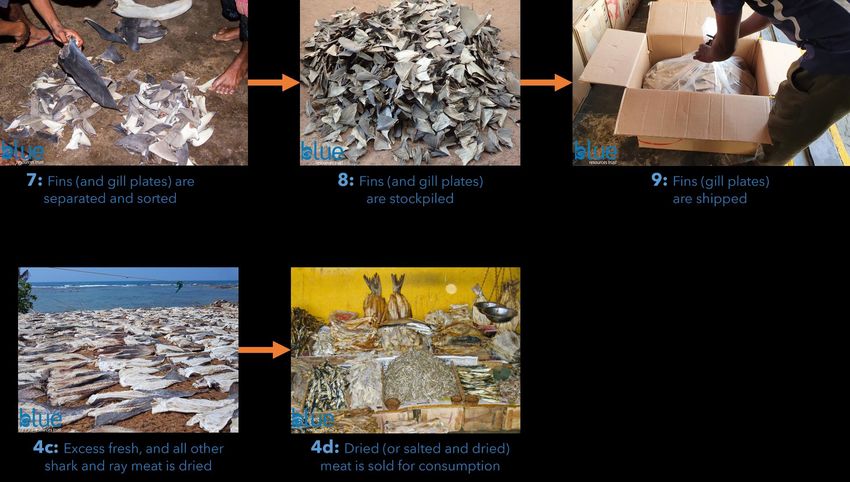
Figure 1 – The number of marine vessels documented in a 15 km stretch of coastline (and
estuary) on the east coast of Sri Lanka. Each black dot corresponds to a landing site. These
sites have been grouped as follows. VLS: Valaichchenai Landing Sites, VFH: Valaichchenai
Fisheries Harbour, PET: Pethalai Landing Sites, PAS: Passikudah Landing Sites, KAL: Kalkudah
Landing Sites. A more detailed breakdown by sector is available in Appendix 7.1. ................. 14
Figure 2 - Above, sharks as a proportion of all other marine catch, and below, sharks
as a proportion of the “tunas, bonitos, and billfishes”; both data from Sri Lanka and
reported to the FAO. ........................................................................................................................ 19
Figure 3 – A comparison of tuna, bonitos, and billfish (left-axis, in blue) and shark (right-axis,
in orange) catches between 1990 and 2018, as reported to the FAO. The tunas, bonitos and
billfish highlights increasing effort and catch, while shark catches decline despite increasing
effort. .................................................................................................................................................. 20
Figure 4 – The shark and ray capture across species in Sri Lanka between 1990 and 2018,
based on national data submitted to the FAO. ............................................................................. 23
Figure 5 - Blue shark and silky shark catch in Sri Lanka. Above: between 1990 and 2018 and
below: 2005 to 2018 (with catch numbers in mt). In 2017 and 2018, the proportion of blue
sharks increased, becoming the dominant species in Sri Lankan shark catches. ..................... 27
Figure 6 – Sri Lanka’s dried shark fin exports by value from 2012 to 2017 ............................... 41
Figure 7 - Screenshots of a Sri Lankan based company website advertising shark fins of CITES
species to potential international customers and showing their operations. Of course, if the
relevant CITES permits are obtained for the export of such fins and no nationally protected
species are offered for sale, it is not illegal. ................................................................................... 48
Figure 8 - The number of marine vessels documented at VLS: Valaichchenai Landing Sites 65
Figure 9 – The number of marine vessels documented at VFH: Valaichchenai Fisheries
Harbour. ............................................................................................................................................. 66
Figure 10 – The number of marine vessels documented at VFH: Valaichchenai
Fisheries Harbour.............................................................................................................................. 67
Figure 11 – The number of marine vessels documented at PAS: Passikudah Landing Sites.. 68
Figure 12 – The number of marine vessels documented at KAL: Kalkudah Landing Sites. .... 68
Page 6 of 74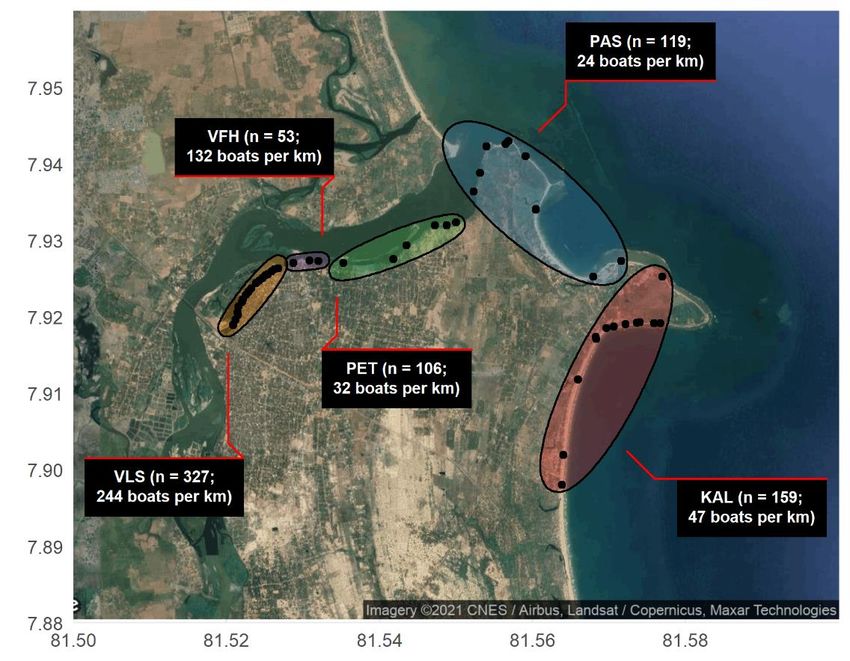
A Brief Overview of Shark and Ray Fisheries and Trade | Sri Lanka

Executive Summary
Sri Lankan waters are home to over 100 species of sharks and rays and at least 64% of them
are considered threatened by the IUCN Red List. Of these, 20 are listed on the CITES
Convention (2 on Appendix I and 18 on Appendix II), 20 on the CMS Convention (10 on
Appendix I and 19 on Appendix II), and 20 on the CMS Sharks MoU. Studies show that Sri
Lankan fisheries capture the most silky sharks in the Indian Ocean and the highest number of
mobulid rays in the world, exceeding even that of global tuna purse seine fisheries combined.
Species like Mobula mobular are being fished at rates exceeding their intrinsic population
growth rate while other scientific information from the wider region indicates that declines in
shark landings are far likely due to declining populations rather than a reduction in effort or
from transitions out of shark fisheries.
With 22 major fishing harbours (21 currently operational) and an additional 883 minor fish
landing centres along the entire 1,340 km coastline, monitoring is extremely challenging. This
was demonstrated by a case study focusing on a 15 km stretch of coastline on the east coast of
Sri Lanka, which revealed an extremely high number of vessels and landing sites within
proximity to each other. When extrapolated, these figures are relatable to national statistics of
registered vessels and total number of landing sites but at the same time highlights the scale
and likely impact of such fisheries. It becomes apparent that conducting frequent and regular
species-specific surveys across all landing sites in the country is not feasible for sharks and rays,
let alone most other marine species.
The value and demand for sharks and rays and their derivatives, for national consumption and
international trade, drive these fisheries. While target fisheries for deep-sea sharks or coastal
sharks and rays exist at small scales in Sri Lanka, most landings are in the form of bycatch in
tuna and billfish fisheries that are operating single- and multi-day vessels in both coastal and
offshore waters. However, there are some reports of Sri Lankan fishers leaving national waters
to target sharks in the high seas, and occasionally even illegally in foreign waters.
While Sri Lanka is publicly supportive of global shark and ray conservation efforts, such as at
the CITES and CMS Conventions, there is limited national management in place. At present,
aside from requiring all sharks to be landed with fins attached to the body, only five species
enjoy legal protection: the pelagic thresher sharks (Alopias pelagicus), bigeye thresher sharks
(A. superciliosus), common thresher sharks (A. vulpinus), oceanic whitetip sharks (Carcharhinus
longimanus), and whale sharks (Rhincodon typus). Fishing regulations, such as the prohibition
on bottom trawling or dynamite fishing are poorly enforced. Other IUU fishing practices
continue, such as Sri Lankan vessels illegally encroaching into other Indian Ocean countries,
and traders or companies (intentionally or otherwise) illegally exporting shark and ray products
without permits or by mislabelling them. Many MPAs remain as paper parks with limited
enforcement. Some legal gaps remain for CITES and to date, there is no regulation to
implement CMS.

                                              Page 7 of 74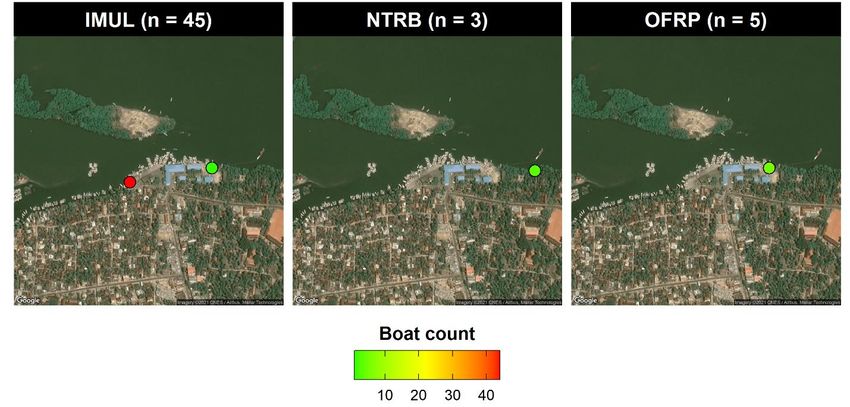
A Brief Overview of Shark and Ray Fisheries and Trade | Sri Lanka

Efforts to strengthen enforcement of high seas fishing regulations, improve licensing of multi-
day vessels operating outside the EEZ, and introduce and expand VMS, are promising.
However, as the high seas vessels only comprise an extremely small proportion of national
fishing effort, there is still much to be done. National policies to increase fish landings,
consumption, and export revenue come in conflict with the need to regulate fisheries through
controls on fishing effort and increasing management of multispecies fisheries with high levels
of bycatch.
High trade of shark and ray products (export and import), along with discrepancies and gaps
in data across national and international databases makes it challenging to obtain a clear image
of the extent of trade, trends, and any potentially illegal activities. Some understanding of
illegal trade is available through seizures undertaken by Sri Lankan enforcement agencies (Sri
Lanka Customs, Sri Lanka Coastguard etc.), in addition to seizures by other countries involved
in the IUU fishing or trade. Certain unusual records, for instance in the CITES trade database,
are also cause for concern (e.g., the export of Carcharhinus longimanus fins in 2020 despite
these species being fully protected in Sri Lanka since 2015, or records where the volume stated
on the export permit did not match with the volume recorded in the importing country, or the
exportation of several CMS Appendix I listed species in contravention of obligations to the
CMS Convention).
Sri Lanka, as a founding member of the Indian Ocean Tuna Commission (IOTC), is well placed
to take a leadership role in improving shark and ray conservation across the region. This would
not just benefit the species but also safeguard national fisheries resources that are at times
being encroached or exploited by other countries. Recommendations to improve the
protection and management of these conservative and slow-growing species are outlined in
this document under the following topics:
    1. strengthening legislation to improve implementation of national policies and
       international biodiversity conventions,
    2. improving research, data collection, and data sharing, and
    3. implementing a recovery plan for species, including interim measures.

                                           Page 8 of 74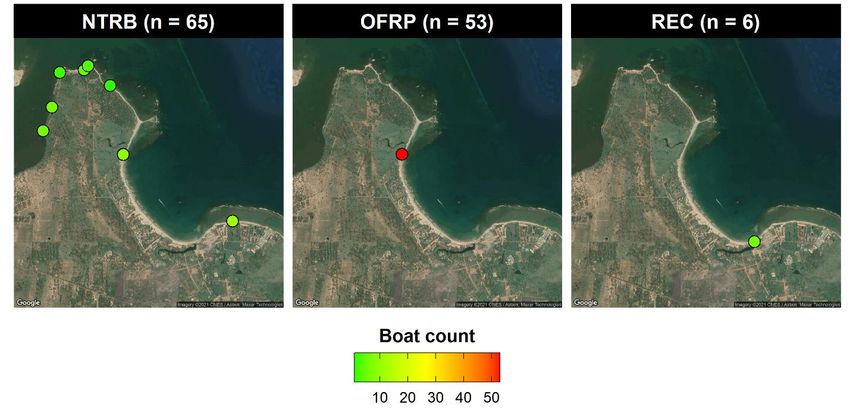
A Brief Overview of Shark and Ray Fisheries and Trade | Sri Lanka

List of Abbreviations & Acronyms
                  Artisanal fishing vessels are those under 24 meters in length. In 2019,
Artisanal fleet   only 23 out of the >50,000 vessels registered in Sri Lanka were over 24
                  meters in length (industrial/commercial vessels)

BEEZ              Beyond the EEZ

                  The incidental capture of a species that is often landed for its value
Bycatch
                  (also referred to as “secondary catch” or “non-directed catch”)

                  Convention on International Trade in Endangered Species of Wild
CITES
                  Fauna and Flora

CMS               Convention on the Conservation of Migratory Species of Wild Animals

CPUE              Catch Per Unit Effort

DFAR              The Department of Fisheries and Aquatic Resources

DG                Director General

DWC               The Department of Wildlife Conservation

EEZ               Exclusive Economic Zone

Elasmobranchs     All sharks and rays

FARA              The Fisheries and Aquatic Resources Act

FFBA              The Fisheries Regulation of Foreign Fishing Boats Act

FFPO              The Fauna and Flora Protection Ordinance

Finning           The act of removing the fins and disposing of the carcass at sea

FMA               Fishery Management Area

HS                High Seas

HS Codes          Harmonized System Codes

IDAY              Inboard single-day boats

                                          Page 9 of 74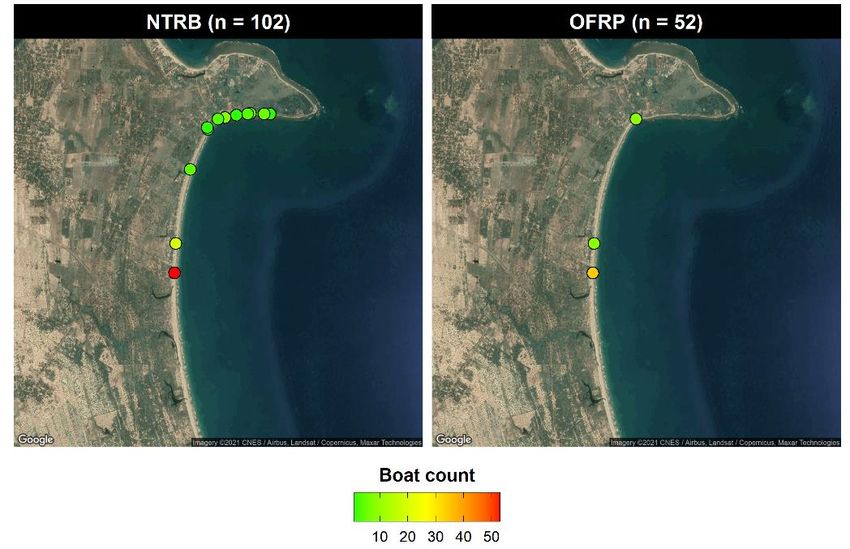
A Brief Overview of Shark and Ray Fisheries and Trade | Sri Lanka

IFS     Introduction From the Sea (for CITES)

IMUL    Inboard multi-day boats

IOTC    Indian Ocean Tuna Commission

IUU     Illegal, unreported, and unregulated fishing

MPA     Marine Protected Area

MTRB    Motorized traditional boats

NARA    National Aquatic Resources Research and Development Agency

NDF     Non-detriment finding (for CITES)

NTRB    Non-motorized traditional boats

OFRP    Out-board engine fiberglass reinforced plastic boats

REC     Recreational boats

Shark   FAO definition: all sharks, rays, and chimaeras

TAC     Total allowable catch

VMS     Vessel monitoring system

                                Page 10 of 74
A Brief Overview of Shark and Ray Fisheries and Trade | Sri Lanka
1. General Overview of Sri Lankan Fisheries
Sri Lanka is an island country situated within the Bay of Bengal. It has a coastline of over 1,340
km and an Exclusive Economic Zone (EEZ) of 532,619 km2 within FAO areas 51 and 57. Around
32% of the estimated population of over 21 million live in coastal areas, and fisheries are
extremely important for food security, livelihoods, and export earnings (Table 1). The high
population density (338/km2) has resulted in significant pressures on national fishery resources.
Most coastal and offshore marine resources are over-harvested and declines in catch per unit
effort and fish size have been noted for some commercially valuable species1,2.
Sri Lanka depends on marine fisheries as an essential source of protein, with over half of
national animal protein consumed originating from seafood. High-value species include
Spanish mackerel, horse mackerel, trevally, tunas, and tuna-like species. There is also
significant consumption of sharks and rays, and small pelagics such as sardines, herrings,
anchovies, and Indian mackerel. Since the 1950s, Sri Lanka has supplemented local fish
production with cheap imports to meet domestic demand. Currently Sri Lanka imports over
70,000 tonnes of dried and canned fish annually (Table 1).
Table 1: Fish production in Sri Lanka (2019) 3
Marine Fish Production: 415,490 Mt Seer 7,740 (2%)
Inland/Aquaculture Fish Production: 90,340 Mt Trevally 21,070 (5%)
Total Fish Production: 505,830 Mt Skipjack tuna 47,230 (11%)
Yellowfin Tuna 44,760 (11%)
Total Import Volume: 95,637 Mt Other tuna-like 44,710 (11%)
Total Export Volume: 28,771 Mt Billfish 32,200 (8%)
Nationally Consumed/Used: 572,696 Mt Sharks/rays 14,240 (3%)
Rock fish 27,950 (7%)
Volume of Tuna Export: 14,252 Mt (49.5%) Small fishes 119,500 (29%)
Tuna Export to the EU: 5,200 Mt (36.5%) Shrimps 16,930 (4%)
Lobsters 470 (0%)
Dry Fish Imports: 34,969 Mt (36.6%) Crabs 13,600 (3%)
Canned Fish Imports: 36,806 Mt (38.5%) Others 25,090 (6%)
415,490
TOTAL:
(100%)
Population: 21,803,000
Per capita fish consumption: 16.6 kg/year
(of which, 7.5% is likely shark)
1
Gunasekara et al., 2019. Online at:
https://www.researchgate.net/publication/336034463_Historical_changes_in_demersal_fish_stocks_abundance_a
nd_distribution_of_Sri_Lanka
2
Athukoorala et al., 2021. Online at: https://www.sciencedirect.com/science/article/abs/pii/S0165783621001454
3
Ministry of Fisheries & Aquatic Resources, 2020. Online at:
https://www.fisheriesdept.gov.lk/web/images/Statistics/FISHERIES-STATISTICS--2020-.pdf
Page 11 of 74A Brief Overview of Shark and Ray Fisheries and Trade | Sri Lanka
Coastal, offshore, and inland fisheries together employ around 224,610 active fishers and land
approximately 505,830 tonnes of fish annually. Data does however suggest that fish catches
are significantly higher than reported, largely due to poor information on artisanal fisheries,
discarded bycatch, ghost nets, and IUU fisheries. A historical fisheries reconstruction for the
period from 1950 to 2008 estimated the total catch to be 18 million tonnes, in contrast to
official landings of 8.4 million tonnes. There has been a push to expand offshore fisheries to
increase total catch and in recognition of the fact that coastal resources are overexploited.
Offshore fisheries have also been identified as a more viable source of high value export-
oriented species, including tuna. However, despite the increase in multi-day fishing vessels and
other offshore industrial craft, the largest component of the marine fishing fleet continues to
consist of small OFRP (out-board engine fiberglass reinforced plastic boats) boats with
outboard motors, as well as non-motorized traditional craft.
Table 2: Registered vessels and vessel types in Sri Lanka4
Length Overall Registered Vessels
Type of Vessel (m) No. %
Beach Seine Craft 4–9m 1,287 3
Non-Motorised Traditional Boats 4–9m 16,312 33
Motorised Traditional Boats 4 – 11 m 2,140 4
OFRP Boats 5.5 – 5.7 m 23,404 48
Single-Day Boats 8.5 – 9.8 m 948 2
Multi-Day Boats 10.5 – 28.5 m 4,885 10
Total Number of Vessels: 48,976
Table 3: The number of Sri Lankan vessels operating in the high seas 5
Year Total Authorised Active
(EEZ+HS) (HS)
2014 4294 2241
2015 4294 2470 1615
2016 4485 1603 1577
2017 4572 1536 1461
2018 4601 1337 1164
2019 4878 1449 1182
The total fishing fleet of Sri Lanka comprises just under 49 thousand vessels (Table 2 and 3), of
which 23 vessels are >24 meters in length and only 1,449 were authorised to fish in the high
seas (beyond the national EEZ) in 20196. All high seas operating vessels must have operational
VMS onboard, however some records of VMS being turned off has been documented7 in
4
Ministry of Fisheries & Aquatic Resources, 2020. Online at:
https://www.fisheriesdept.gov.lk/web/images/Statistics/FISHERIES-STATISTICS--2020-.pdf
5
IOTC-2020-SC23-NR21. Available at: https://www.iotc.org/documents/SC/23/NR21
6
IOTC-2020-SC23-NR21. Available at: https://www.iotc.org/documents/SC/23/NR21
7
Collins et al., 2021. Online at: https://www.frontiersin.org/articles/10.3389/fmars.2021.650276/full
Page 12 of 74A Brief Overview of Shark and Ray Fisheries and Trade | Sri Lanka
addition to many VMS being inactive, likely due to malfunctioning equipment because of age8.
A new project funded by Australia is expected to provide new VMS units to existing and other
vessels. Vessels operating within the EEZ are not required to have VMS and could in theory
stray into international waters with low chances of being detected.
8
President’s Media Division. Online at: https://www.pmdnews.lk/ඕස්ට්%E2%80%8Dරේලියාරෙන්-රෙරටට-බ/
Page 13 of 74A Brief Overview of Shark and Ray Fisheries and Trade | Sri Lanka
1.1 A case study to highlight the scale of Sri Lankan fisheries
While there are 22 major fishery harbours, of which 21 are currently in operation, it is estimated
there are at least another 883 minor fish landing centres9. These landing centres (or sites) are
found along the entire coastline of Sri Lanka, making fisheries monitoring extremely
challenging. To demonstrate the scale of this issue, a 15 km stretch of coastline was selected
on the east coast of Sri Lanka for an intensive survey (Figure 1 and Table 4). Of course, as
vessels keep moving about or heading out to sea or returning, these figures are not absolute
counts but rather a snapshot in time collected across 1 week in May 2021. The results
demonstrate both the number of vessels and the number of landing sites within proximity to
each other and highlight the challenges of surveying a 15 km stretch of coastline to document
fishery landings, let alone the problem when this is scaled to a national level (1,340 km of
coastline). It quickly becomes evident that daily, detailed surveys at all landing sites in Sri Lanka
is not possible with the current national fisheries structure in place.
Figure 1 – The number of marine vessels documented in a 15 km stretch of coastline (and estuary) on
the east coast of Sri Lanka. Each black dot corresponds to a landing site. These sites have been grouped
as follows. VLS: Valaichchenai Landing Sites, VFH: Valaichchenai Fisheries Harbour, PET: Pethalai
Landing Sites, PAS: Passikudah Landing Sites, KAL: Kalkudah Landing Sites. A more detailed breakdown
by sector is available in Appendix 7.1.
9
Ministry of Fisheries & Aquatic Resources, 2020. Online at:
https://www.fisheriesdept.gov.lk/web/images/Statistics/FISHERIES-STATISTICS--2020-.pdf
Page 14 of 74A Brief Overview of Shark and Ray Fisheries and Trade | Sri Lanka
Table 4: The vessel type, gear, target species, and other information available for each sector of the 15 km survey.
Boat type
Cluster Count Gear * Target species † Additional info
(%)
Trip duration: about 10 days
Yellowfin Tuna, Swordfish, Shark,
n = 239 Gillnets Frequency: variable as it depends on income
VLS Marlin, Black Marlin, Skipjack Tuna,
(83%) Longlines earned on the previous trip, weather
Sailfish
conditions, local religious events etc.
IMUL ‡ n = 45 Gillnets
VFH
n = 289 (16%) Longlines
(37.83%) Active: Only 4
n=5
PET Gillnets Indo-Pacific King Mackerel, Marlin All the boats (5) were recorded from one site
(2%)
Trips: 3 days (mostly), 10 days (occasionally)
PAS 0
KAL 0
n = 35 Stingray, Trevally, Barracuda, Spanish
VLS Hook and line
(17%) Mackerel, Queenfish
Sardinella, Small Barracuda,
n=5 Stingrays, Trevally, Barracuda,
VFH All the boats (5) were recorded from one site
(2%) Goldbanded Jobfish, Red Snapper,
Spanish Mackerel, Queenfish, Emperor
Bluespotted Maskray, Lobster, Ponyfish,
OFRP Flyingfish, Anchovy, Sardines, Flounder
n = 65 Gillnets
n = 210 PET Groupers, Tuna (Skipjack Tuna) Seasonal shifts in target fishery
(31%) Longlines
(33.77%) Trevally, Indo-Pacific King Mackerel,
Spanish Mackerel
All the boats (53) were recorded from one
n = 53 site
PAS Gillnets Sardine, Indian Mackerel, Barracuda
(25%) They do not fish on full moon days (usually),
Fridays (sometimes)
n = 52
KAL
(25%)
n = 53
VLS
(21%)
NTRB
n=3
n = 258 VFH All boats (3) were recorded from one site
(1%)
(27.49%)
n = 35 Hook and line Most of the boats collect clams from Jan to
PET Bluespotted Maskray, Whipray
(14%) Gillnets Oct/Sep
Page 15 of 74A Brief Overview of Shark and Ray Fisheries and Trade | Sri Lanka
Boat type
Cluster Count Gear * Target species † Additional info
(%)
Rockfish (Red Snapper), Crab
n = 65 Hook and line
PAS (occasionally), Trevally, Queenfish,
(25%) Gillnets
Ribbonfish
n = 102 20% (53) of this cluster's boats were recorded
KAL Beach seine
(40%) from one site
VLS 0
VFH 0
REC n=1 1 boat was near a restaurant, probably used
n=6 PET
(14%) for water safaris
(0.92%) n=6 These are vessels for (local and international)
PAS
(86%) tourists to show coral reefs
KAL 0
* There are additional variations within the gear types as well, such as different mesh sizes for gillnets, surface gillnets, mid-water
gillnets, grouper longlines, yellowfin longlines etc.
†
The bycatch from all vessels (apart from the recreational vessels) includes sharks.
‡
This may contain IDAY (Inboard Single-day Boats) vessels as it was not possible to distinguish between the two from the shore.
‡
Recreational vessels. While in other parts of the country there are recreational sport fishing vessels that (rarely) incidentally
capture sharks, these vessels are purely for water/coral safaris and do not conduct any form of fishing.
Page 16 of 74A Brief Overview of Shark and Ray Fisheries and Trade | Sri Lanka
2. Shark and Ray Fisheries in Sri Lanka
2.1 Overview
Sharks and rays (elasmobranchs) are a group of cartilaginous fishes that inhabit marine and
coastal habitats in both tropical and temperate waters. Many sharks are higher level predators,
playing vital ecological roles in the marine environment, including removing weaker
individuals and controlling prey numbers. Most elasmobranchs have several conservative
biological traits such as slow growth, late maturity, and low fecundity, making them extremely
vulnerable to overfishing, with depleted stocks taking an extremely long time to recover. While
elasmobranchs have historically been targeted for meat by local fisheries, growing
international demand for products such as shark and ray fins, shark liver oil, cartilage, skin, jaws,
teeth, and mobulid gill plates have resulted in the rapid expansion of shark and ray fisheries
around the world. This increased exploitation has raised global concerns over the sustainability
of many elasmobranch fisheries.
The elasmobranch fisheries in Sri Lanka were historically confined to coastal waters with meat
being locally consumed. However, with growing domestic markets alongside international
demand for products such as fins, the fishing fleet expanded to target offshore pelagic fish
stocks; both within and beyond the EEZ. Commercial exploitation by offshore vessels began in
the 1950s using large, meshed drift gillnets and longlines, and were rapidly expanded in the
mid-1980s, resulting in a peak in the late 1990s. Since the late 1990s/early 2000s, the shark
fishery transitioned into a primarily bycatch fishery in the offshore target tuna longline and
gillnet fishery. Greater profitability in tuna and billfish fisheries (particularly for export),
declining shark and ray catches, and changes to fisheries regulations (i.e., the shark finning ban
in 2000) have been attributed to this change. A recent report by the FAO provides some
additional insights into shark and ray food security, incomes, and livelihoods for some landing
sites on the west coast of Sri Lanka10.
Shark Catches and Trends:
Despite extensive declines in elasmobranch stocks across the Indian Ocean, there are still
considerable fisheries for these species in both coastal and offshore waters. Catch data
provided to the FAO between 2000 and 2009 listed Sri Lanka as the 14th largest elasmobranch
fishing country, contributing 2.4% (19,988 mt) of global elasmobranch catch11. While data
reported to the FAO in 2018 was 2,745 mt, down from 7,501 mt in 2017 (Figure 3)12, a report
from 201913 suggests that in the Indian Ocean, Sri Lanka is presently the largest silky shark
catcher and the second largest mobulid ray catcher. A more recent study on the mobulid rays
highlights that these species are incidentally caught in nets deployed for tuna and skipjack,
and that the numbers landed as bycatch by Sri Lankan vessels are estimated to even exceed
10
Herath et al., 2019. Online at: https://www.fao.org/3/ca5641en/CA5641EN.pdf
11
Lack & Sant 2011. Online at: https://www.bmis-bycatch.org/references/enum2vx2
12
FAO FishstatJ, 2020
13
Okes & Sant 2019. Online at: https://www.traffic.org/publications/reports/an-overview-of-major-shark-and-ray-
catchers-traders-and-species/
Page 17 of 74A Brief Overview of Shark and Ray Fisheries and Trade | Sri Lanka
the numbers captured by the total global tuna purse seine fisheries, likely making this the
largest mobulid fishery in the world14.
Table 5: Total catch, bycatch, of fish and sharks in Sri Lanka (2014 – 2016)15
Total Catch Total Bycatch Fish Species Sharks
2014 124,804.5 24,389.5 19.5% 21,628.5 17.3% 2,761.0 2.2%
2015 122,090.3 34,651.6 28.4% 32,520.7 26.6% 2,130.9 1.7%
2016 126,791.2 43,873.0 34.7% 41,101.6 32.5% 2,771.4 2.2%
Total 373,656.0 102,884.1 27.6% 95,250.8 25.5% 7,633.3 2.0%
Av. 124,393.1 34,135.8 27.4% 31,750.3 25.5% 2,385.5 1.9%
The Sri Lankan national report to the IOTC in 2019 details that elasmobranchs accounted for
1.9% (1,508 mt) of the total fish catch from Sri Lankan fisheries within and beyond the EEZ
(Table 5 for proportions between 2014 and 2016). In contrast, 37% of the total catch was
yellowfin tuna, 34% skipjack tuna, 4% bigeye tuna, and 16% billfish (dominated by swordfish)16.
Additionally, the total shark capture from the Indian Ocean (between 2014 and 2016) was
318,079 mt, while Sri Lanka accounted for 7,663.3 mt, or 2.4% of total Indian Ocean shark
capture (Table 6). More than 84% of Sri Lanka’s total shark catch between 2014 and 2016
originated from vessels operating within the EEZ, however it should also be noted that at times,
some EEZ vessels have been suspected to be fishing illegally in the high seas17.
Table 6: The relative contribution of directed and non-directed shark catches in Sri Lanka compared to
entire Indian Ocean shark catch between 2014 and 2016 18
Indian Ocean
Sri Lanka Shark Catch
Shark Catch
Total Total EEZ BEEZ
Years mt mt % mt % mt %
2014 94,932.0 2,761.0 2.9% 1,984.9 71.9% 776.1 28.1%
2015 111,094.0 2,130.9 1.9% 1,740.9 81.7% 390.0 18.3%
2016 112,053.0 2,771.4 2.5% 2,496.1 90.1% 275.3 9.9%
Totals 318,079.0 7,663.3 2.4% 6,221.9 81.2% 1,441.4 18.8%
14
Fernando & Stewart 2021. Online at: https://doi.org/10.7717/peerj.11994
15
Sri Lanka National Plan of Action (NPOA) for Sharks, 2018. Online at: http://www.fao.org/3/bg315e/bg315e.pdf
16
IOTC-2020-SC23-NR21. Available at: https://www.iotc.org/documents/SC/23/NR21
17
Collins et al., 2021. Online at: https://www.frontiersin.org/articles/10.3389/fmars.2021.650276/full
18
Sri Lanka National Plan of Action (NPOA) for Sharks, 2018. Online at: http://www.fao.org/3/bg315e/bg315e.pdf
Page 18 of 74A Brief Overview of Shark and Ray Fisheries and Trade | Sri Lanka
16%
14%
14%
13% 13%
12%
12% 11%
11% 11%
11%
10%
10%
10%
8%
8%
8% 7% 7%
6%
6%
4%
4% 3%
2%
2% 2% 2% 1%
2% 1% 1% 1% 1% 1% 1%
1%
0%
40% 37%
36%
35% 32%
31%
29% 29%
30% 28% 28% 28%
26%
24%
25% 22%
23%
20%
15%
15% 13%
10% 8%
7%
7% 6%
5% 5% 5% 6%
5% 5%
5% 3% 3% 4%
2%
0%
Figure 2 - Above, sharks as a proportion of all other marine catch, and below, sharks as a proportion of
the “tunas, bonitos, and billfishes”; both data from Sri Lanka and reported to the FAO.
Page 19 of 74A Brief Overview of Shark and Ray Fisheries and Trade | Sri Lanka
160,000 40,000
140,000 35,000
120,000 30,000
100,000 25,000
80,000 20,000
60,000 15,000
40,000 10,000
20,000 5,000
0 0
Tunas, bonitos, and billfish Sharks
Figure 3 – A comparison of tuna, bonitos, and billfish (left-axis, in blue) and shark (right-axis, in orange)
catches between 1990 and 2018, as reported to the FAO 19. The tunas, bonitos and billfish highlights
increasing effort and catch, while shark catches decline despite increasing effort.
Declared shark catches in Sri Lanka have steadily been decreasing since its peak in the late
1990s, despite increasing effort (Figures 2-3 and Table 7). De Silva20 notes that some species
of reef sharks such as the Zebra Shark (Stegostoma fasciatum), Tawny Nurse Shark (Nebrius
ferrugineus), and Whitetip Reef Shark (Triaenodon obesus) have practically disappeared from
Sri Lankan waters. Studies on mobulid rays suggest declines over a 9-year period (2011 to
2020) with some species, like M. mobular, being fished at rates above their intrinsic population
growth rate21. Additionally, scientific information from the wider region22 suggests that declines
in shark landings are likely a result of declining populations rather than simply a transition away
from a shark fishery and to a target tuna fishery.
Table 7: The number of registered fishing vessels from 2010 to 2019 23. IMUL operate within and beyond
the EEZ, while IDAY operate within the EEZ, and OFRP in coastal waters
2010 2011 2012 2013 2014 2015 2016 2017 2018 2019
IMUL: 3,346 3,872 4,080 4,111 4,447 4,218 3,996 4,196 4,581 4,885
IDAY: 1,177 1,120 890 802 876 719 786 868 918 948
SUB-TOTAL: 4,523 4,992 4,970 4,913 5,323 4,937 4,782 5,064 5,299 5,833
OFRP: 18,770 22,890 23,160 23,134 23,982 24,028 24,282 22,394 24,132 23,404
TOTAL: 23,293 27,882 28,130 28,047 29,305 28,965 29,064 27,458 29,631 29,237
19
FAO FishstatJ, 2020
20
De Silva, R., 2006. Online at: https://portals.iucn.org/library/sites/library/files/documents/2006-030.pdf
21
Fernando & Stewart 2021. Online at: https://doi.org/10.7717/peerj.11994
22
Pacoureau et al., 2021. Online at: https://www.nature.com/articles/s41586-020-03173-9
23
Ministry of Fisheries & Aquatic Resources, 2020. Online at:
https://www.fisheriesdept.gov.lk/web/images/Statistics/FISHERIES-STATISTICS--2020-.pdf
Page 20 of 74A Brief Overview of Shark and Ray Fisheries and Trade | Sri Lanka Target Shark and Ray Fisheries: Directed or target fishing for shark and rays is largely restricted to a small number of motorised vessels (
A Brief Overview of Shark and Ray Fisheries and Trade | Sri Lanka

generated from such fisheries27, again highlighting the importance of shark and ray fisheries
for local fisher communities.
Fishing Gear:
The primary gear associated with shark and ray landings from Sri Lanka’s EEZ, and high seas
fishery, are gillnets (Table 8). Between 2014 and 2017, they accounted for 51.6% of total shark
and ray catch. Of this, 36.7% were sharks, while the rays accounted for almost two thirds of the
capture at 63.3% during this 4-year period. This is followed by longlines accounting for 36.5%
of capture (79.9% sharks and 20.1% rays).
The combination of these two gear types (gillnet and longline) are responsible for 88% of shark
and ray capture in Sri Lanka. The gillnets can be broken down further into various mesh sizes
and the depth at which they are set (surface, midwater, or bottom-set), however catch
breakdowns are not available at such higher resolutions of gear type. A smaller number of
sharks and rays are also captured by trolling (2.8%), handlines (1.8%), ringnets (4.5%), and
beach seines (2.9%). A unique factor about Sri Lankan fisheries is that many vessels (36%) utilise
more than one gear type depending on season or target species.
Table 8: Total non-directed shark catch (tonnes) by gear type, cumulative from 2014 – 201728
     Gear Type                All                         Sharks                      Rays
           Gillnet      5,642.2     51.6%            2,071.4         36.7%      3,570.8       63.3%
         Longline       3,989.4     36.5%            3,187.4         79.9%         802.0      20.1%
          Trolling        304.8      2.8%              228.0         74.8%          76.8      25.2%
        Handline          192.4      1.8%                78.6        40.9%         113.8      59.1%
         Ring Net         492.1      4.5%              430.2         87.4%          61.9      12.6%
     Beach Seine          321.6      2.9%                44.9        14.0%         276.7      86.0%
        All Gears      10,942.5                     6,040.5          55.2%     4,902.0        44.8%

2.2 Primary shark and ray species in Sri Lanka and their IUCN status
While the precise number of elasmobranchs in Sri Lankan fisheries is largely unknown due to
the lack of sufficient species-specific data in official reports, there are estimated to be around
60 sharks and around 50 rays, and at least 1 chimaera species (sharks, rays, and chimaeras
together form the Class Chondrichthyes). Much of the data reported by the DFAR are grouped:
e.g., Figure 4, where data reported to the FAO includes a large proportion categorised under
“Sharks, rays, skates, etc. nei”. Similarly, data reported to the IOTC includes categories such as
“Sharks various nei” and “Requiem sharks nei”. This is due to the challenges in identifying shark
and ray species that are either taxonomically ambiguous or easy to misidentify (e.g., many
requiem sharks). The lack of capacity (training in visual identification and the availability of
rapid, genetic tools), the number of landing sites to be surveyed (and the number of trained
personnel required), along with higher priorities (i.e., target species), has resulted in limited

27
     Collins et al., 2021. Online at: https://www.frontiersin.org/articles/10.3389/fmars.2021.650276/full
28
     Sri Lanka National Plan of Action (NPOA) for Sharks, 2018. Online at: http://www.fao.org/3/bg315e/bg315e.pdf

                                                     Page 22 of 74
A Brief Overview of Shark and Ray Fisheries and Trade | Sri Lanka
species-specific data being collected in Sri Lanka. As a result of this, species counts are only
available through published checklists by independent or other research bodies (Table 9).
Table 9: Species counts for Sri Lanka, from a subset of checklists
Checklist Sharks Rays Chimaeras TOTAL
Sri Lanka NPOA, 2018 60 27 0 87
Rex de Silva, 2020 68 30 2 100
Blue Resources Trust, 2021 (unpublished) * 53 49 1 103
Moron, 1998 34 22 0 56
De Bruin, 1994 44 30 0 74
* This data originates from the Sri Lanka Elasmobranch Project (Blue Resources Trust), which is
conducting a systemic, long-term survey on chondrichthyans in Sri Lanka. Over 64% of the species on
the checklist are considered threatened by the IUCN Red List.
The most prominent shark species include the blue sharks (~12.7% of total shark and ray catch)
and silky sharks (~32.9% of total shark and ray catch), while mako sharks, hammerhead sharks,
oceanic whitetip sharks, along with several other species make up the remainder (Figures 4-5
and Tables 10-12). Among the rays, the most prominent are the devil rays (mobula rays; ~25%
of total shark and ray catch), followed by other ray species; species breakdowns for rays are
extremely limited, in comparison to the sharks. Overall, rays account for 44.8% of all
elasmobranch landings and 63.3% of elasmobranch landings from gillnet fisheries, while the
sharks account for 55.2% of all elasmobranch landings and 79.9% of elasmobranch landings
from longline fisheries. A large proportion of the frequently encountered species are
considered threatened by the IUCN Red List (Table 10).
35000
30000
25000
20000
15000
10000
5000
0
Blue shark Hammerhead sharks, etc. nei Mantas, devil rays nei
Oceanic whitetip shark Sharks, rays, skates, etc. nei Shortfin mako
Silky shark Spottail shark Thresher sharks nei
Figure 4 – The shark and ray capture across species in Sri Lanka between 1990 and 2018, based on
national data submitted to the FAO 29.
29
FAO FishstatJ, 2020
Page 23 of 74A Brief Overview of Shark and Ray Fisheries and Trade | Sri Lanka
Table 10: The IUCN Red List statuses of some of the more frequently encountered shark and ray
species in Sri Lanka30
Year
Species Common name IUCN Red List *
Assessed
Aetobatus ocellatus Spotted Eagle Ray Vulnerable 2015
Alopias pelagicus Pelagic Thresher Endangered 2018
Alopias superciliosus Bigeye Thresher Vulnerable 2018
Carcharhinus falciformis Silky Shark Vulnerable 2017
Carcharhinus longimanus Oceanic Whitetip Shark Critically Endangered 2018
Carcharhinus sorrah Spottail Shark Near Threatened 2007
Isurus oxyrinchus Shortfin Mako Endangered 2018
Isurus paucus Longfin Mako Endangered 2018
Mobula birostris Oceanic Manta Ray Endangered 2019
Mobula mobular Spinetail Devil Ray Endangered 2018
Mobula tarapacana Sicklefin Devil Ray Endangered 2018
Prionace glauca Blue Shark Near Threatened 2018
Rhincodon typus Whale Shark Endangered 2016
Rhinoptera javanica Javanese Cownose Ray Vulnerable 2006
Sphyrna lewini Scalloped Hammerhead Critically Endangered 2018
Sphyrna mokarran Great Hammerhead Critically Endangered 2018
Sphyrna zygaena Smooth Hammerhead Vulnerable 2018
* In bold are the IUCN Red List threatened categories
30
The IUCN Red List. Online at: https://www.iucnredlist.org
Page 24 of 74A Brief Overview of Shark and Ray Fisheries and Trade | Sri Lanka
Table 11: National landings of all recorded shark species in Sri Lanka (in tonnes): 2005 to 2015 31
Common Name 2005 2006 2007 2008 2009 2010 2011 2012 2013 2014 2015 TOTALS:
Blue Shark (BSH) 118.00 78.69 83.20 64.22 99.13 323.85 831.01 284.00 183.00 203.00 207.00 2,475.10
Bigeye thresher shark
813.00 426.95 602.92 505.91 327.84 514.09 495.12 465.00 0.00 0.00 0.00 4,150.83
(BTH)
Silky shark (FAL) 1,060.00 978.60 837.87 910.60 898.57 1,623.83 1,940.67 1,136.00 1,247.00 1,122.00 750.00 12,505.13
Great hammerhead
25.00 15.01 3.71 19.93 6.83 51.07 2.34 8.10 8.00 4.00 4.70 148.69
shark (GRH)
Longfin mako shark
19.00 12.14 20.08 17.82 17.54 30.36 69.45 52.00 70.00 14.00 9.60 331.99
(LFM)
Oceanic whitetip shark
101.00 61.40 153.05 84.75 67.38 277.35 452.99 149.00 41.00 78.00 87.00 1,552.92
(OWT)
Pelagic thresher shark
59.00 72.95 122.51 74.23 19.65 137.57 192.09 329.00 0.00 0.00 0.00 1,006.99
(PTH)
Scalloped
hammerhead shark 127.00 77.32 132.82 11.65 76.36 199.24 167.13 71.00 119.00 33.00 42.00 1,056.53
(SCH)
Shortfin mako shark
10.00 14.81 9.77 23.94 15.92 19.07 49.03 63.00 56.00 41.00 49.00 351.54
(SFM)
Unidentified sharks
15.00 324.58 403.75 126.01 408.16 929.29 144.88 560.47 0.00 88.00 19.00 3,019.14
(SKH)
Smooth hammerhead
34.00 8.56 16.23 29.45 43.94 22.71 45.66 50.56 61.00 18.00 44.00 374.12
shark (SMH)
Spottail shark (SPT) 11.00 1.72 3.04 1.20 77.68 8.57 1.64 8.66 19.00 10.00 0.00 142.51
Thresher shark (THR) 0.00 28.26 0.05 1.28 0.00 0.00 0.00 0.00 0.00 0.00 0.00 29.59
TOTAL (tonnes): 2,392.00 2,101.00 2,389.00 1,871.00 2,059.00 4,137.00 4,392.00 3,176.79 1,804.00 1,611.00 1,212.30 27,145.09
31
Source: Non-Detriment Finding (NDF) of Sri Lanka for Silky sharks; Carcharhinus falciformis. Available at:
https://cites.org/sites/default/files/eng/prog/shark/docs/Sri%20Lanka%20Silky%20Shark%20NDF%20-%202017%20to%202019.pdf
Page 25 of 74A Brief Overview of Shark and Ray Fisheries and Trade | Sri Lanka
Table 12: Total number and weight of sharks, by species, retained by the Sri Lankan fleet in the IOTC
area of competence from 2015 to 2019 32
FAO Total weight (t) *
Species Common name
codes 2015 2016 2017 2018 2019
Carcharhinus falciformis Silky shark FAL 750 647 622.6 704.4 732
Prionace glauca Blue shark BSH 207 568 740 1028 711.8
Carcharhinus longimanus Oceanic whitetip shark OCS 87 0 0 5.2 0
Isurus paucus Longfin mako LMA 6.5
58.6 69 83.7 14.1
Isurus oxyrinchus Shortfin mako SMA 6.6
Alopias superciliosus Bigeye thresher BTH 0 0 0 0 0
Alopias pelagicus Pelagic thresher PTH 0 0 0 0 0
Sphyrna lewini Scalloped hammerhead SPL 42 75 117.6 16 24.6
Carcharhinus sorrah Spottail shark CCQ 0 0 2 -
Sphyrna zygaena Smooth hammerhead SPZ 44 22 11.4 1.4 7.3
Sphyrna mokarran Great hammerhead GRH 4 0 0 1 0
Rhincodon typus Whale Shark RHN 2 0 0 0 0
- Other sharks (rays) SKA 19 126 187 32.1 19.9
Total shark 1,214 1,507 1,764.3 1,802.2 1,508.6
* These figures are lower than national shark catches as they relate to tuna target fisheries
only (as required by the data reporting to the IOTC)
32
IOTC-2020-SC23-NR21. Available at: https://www.iotc.org/documents/SC/23/NR21
Page 26 of 74A Brief Overview of Shark and Ray Fisheries and Trade | Sri Lanka
30,000
25,000
20,000
15,000 24,605
20,651
19,030
10,000 16,528
13,224
12,566
11,928 12,041 12,068
5,000 7,809 7,719
6,397
5,206
4,446 4,025
3,569
2,761 2,873 2,661
2,222 2,411 2,111 704
1,930 1,538 1,425 1,603 1,138 1,247 647 623
1,467 1,544 1,393 1,406 1,409 1,122 753 1,028
911 902
0 322 417 608 747 311 246 180 167 187 519 470 284 183 199 190 568 740
6,000
5,000
4,000
3,000
4,446
4,025
2,000
2,661
2,111 704
1,000 1,538 1,603 623
1,425 1,138 1,247 647
1,122
753 1,028
568 740
311 519 470
246 180 167 187 284 183 199 190
0
Blue shark Silky shark
Figure 5 - Blue shark and silky shark catch in Sri Lanka. Above: between 1990 and 2018 and below:
2005 to 2018 (with catch numbers in mt) 33. In 2017 and 2018, the proportion of blue sharks increased,
becoming the dominant species in Sri Lankan shark catches.
33
FAO FishstatJ, 2020
Page 27 of 74A Brief Overview of Shark and Ray Fisheries and Trade | Sri Lanka
2.6 Brief overview of the economic benefits of shark fisheries for
Sri Lanka
Elasmobranch meat is consumed domestically, predominantly by low- and middle-income
families. It is available both fresh and dried (salted and then dried). Some species, such as milk
sharks, are extremely highly valued in certain communities due to beliefs that it benefits
lactating mothers. Silky sharks, mako sharks, blacktip sharks are quite highly valued in fresh
form, while thresher sharks, blue sharks, tiger sharks are generally dried before consumption34.
However, preferences appear to vary across regions. Other derivatives, including shark and
ray fins, shark liver oil (extracted from deep water sharks as they have much larger livers), skin,
jaws, teeth, and mobulid gill plates are predominantly exported. Destination countries include
Hong Kong, Singapore, Japan, and Taiwan. At present, no further value addition is being
conducted within Sri Lanka itself.
Although some instances of finning have been reported35, it is not considered to be a common
practice in Sri Lanka. Fishers tend to retain the entire shark given the national value for their
meat and the general practices of complete utilisation.
2.3 Shark and ray regulations in Sri Lanka (local and international)
National: The Department of Fisheries and Aquatic Resources
The Department of Fisheries and Aquatic Resources (DFAR) is legally mandated to manage all
fisheries in Sri Lanka. It is done through two Acts:
1. The Fisheries and Aquatic Resources Act, No. 2 of 1996 (FARA): provides for the
management, regulation, conservation and development of fisheries and aquatic
resources harvested by fishing vessels registered and operated in Sri Lanka. The FARA
also gives effect to Sri Lanka’s obligations under international and regional fisheries
agreements within Sri Lanka’s EEZ and on the high seas.
2. The Fisheries (Regulation of Foreign Fishing Boats) Act, No. 59 of 1979 (FFBA): allows
the regulation, control, and management of fishing activities by foreign vessels in Sri
Lanka’s EEZ. The Act was amended in 2018, as the Fisheries (Regulation of Foreign
Fishing Boats) Act, No. 1 of 2018 (FFBA). The FARA and FFBA are administered by the
DFAR, which has the overall mandate for the implementation of the provisions
incorporated in them.
History of shark measures: Management of shark fisheries has been undertaken with two
different objectives, i.e., optimum utilization of the carcasses of harvested sharks, and the
protection of threatened or vulnerable species. In 2001, legislation was gazetted to prohibit
shark finning and the discarding and required that all sharks are landed whole with fins intact
34
Blue Resources Trust, unpublished.
35
Several posts by the Sri Lanka Coastguard. Online at: https://www.facebook.com/srilanka.coastguard.79
Page 28 of 74A Brief Overview of Shark and Ray Fisheries and Trade | Sri Lanka
(Gazette 1206/20 of 17 October 2001). Following IOTC conservation measures, Sri Lanka also
prohibited the catching of all species of thresher sharks (Alopias vulpinus, A. superciliosus and
A. pelagicus) in both commercial and recreational fisheries in 2012 and requires that any
thresher sharks caught incidentally be released alive and recorded in logbooks (Gazette
1768/36 of 27 July 2012).
Consolidation: To consolidate all shark measures, the previous gazette notices were
rescinded and brought together under one single management measure entitled: the Shark
Fisheries Management Regulations, 2015 (Gazette No. 1938/2 of 26 October 2015) and the
Shark Fisheries Management (High Seas) Regulations, 2015 (Appendix 7.2 and Appendix 7.3).
These prohibit the removal of fins of any shark onboard a vessel, the discarding of a carcass
from which the fins have been removed, the retention onboard, transhipment, or landing of
fins unless naturally attached to the body of the shark. It requires the owner or skipper of the
vessel to release live sharks, especially juveniles or pregnant sharks. It protects the three
thresher shark species (see above) and includes prohibitions on the fishing and landing of
oceanic white-tip sharks (Carcharhinus longimanus) and whale sharks (Rhincodon typus). In
total, five species of shark belonging to three families are now protected in Sri Lanka.
Others: In 2013, Sri Lanka initiated its first national plan of action (NPOA) for sharks in
consultation with all stakeholders, for the period of 2013 to 2017 (published and available
online36). In 2018 this was revised for the period of 2018-2022 (unpublished). Other fisheries
management regulations directly or indirectly support shark management (Table 13). While
some fishery managed areas (FMAs) exist, they do not explicitly encompass sharks.
Challenges: Some fishing regulations (such as the prohibition on bottom trawling or dynamite
fishing) are not actively enforced37,38,39, especially in the coastal fishery. However, there has
been renewed effort in strengthening enforcement of offshore fishing regulations and
licensing of multi-day fishing vessels operating outside the EEZ (including the introduction of
VMS). As a result, there has been a significant increase in compliance and improvement in
monitoring and surveillance of the offshore fishing fleet. The focus on species specific
management measures rather than regulation of overall fishing effort has been a major
drawback of fisheries management. This is especially so in multispecies fisheries with high
levels of bycatch. National policy objectives to increase fish landings, consumption and export
revenue are often in direct conflict with required management measures to ensure
sustainability of fish stocks including sharks and rays, especially since export demand has been
a major driver in expanding unsustainable fisheries in Sri Lanka. There is also low compliance
by fishers and low capacity to enforce regulations.
36
Sri Lanka National Plan of Action (NPOA) for Sharks, 2018. Online at: http://www.fao.org/3/bg315e/bg315e.pdf
37
Rodrigo, 2019. Online at: https://news.mongabay.com/2019/06/crackdown-after-sri-lanka-bombings-may-help-
in-fight-against-blast-fishing/
38
Rodrigo, 2018. Online at: https://www.sundaytimes.lk/180128/news/get-on-with-total-bottom-trawling-ban-say-
conservationists-278835.html
39
Rubatheesan, 2020. Online at: https://www.sundaytimes.lk/201011/news/vallam-fishermen-distraught-as-govt-
bends-to-trawler-demands-419591.html
Page 29 of 74A Brief Overview of Shark and Ray Fisheries and Trade | Sri Lanka
Table 13: The legal provisions and regulations for fisheries management in Sri Lanka (that have a direct or indirect impact on shark and ray fisheries).
Provision in the Act: Regulations Management Measure
Section 6,7,8,9, 29,61 of FARA; Engaging in any of the prescribed fishing activities in Sri Lanka waters without a license
Fishing Operations Regulations of obtained from Director General (DG)
1996 (Gazette, No. 948/25 of 07-11-
1996) Penalty for Non-Compliance: Fine not exceeding LKR 25,000
Use of a fishing boat that has not been registered as a fishing boat by DG for fishing in Sri
Section 15 of FARA; Registration of
Lanka waters
Fishing Boats Regulations, 1980
(Gazette, No. 109 of 10 March 1980)
Penalty for Non-Compliance: Fine not exceeding LKR 25,000
Use of poisonous, explosive, or stupefying substances (including dynamite) or other
noxious or harmful material for fishing or dumping of poisonous, explosive, stupefying or
other obnoxious or harmful material in Sri Lanka waters
Section 27 of FARA as amended by
Act, No. 4 of 2004
Penalty for Non-Compliance: Imprisonment (>3 years and LKR
100,000, or on a second or subsequent conviction imprisonment (>5 years and LKR 500,000
Sections 28, and 61 of FARA;
Using monofilament nets for fishing
Monofilament Nets Prohibition
Regulations, 2006 (Gazette No.
Penalty for Non-Compliance: Fine not exceeding LKR 25,000
1454/33 of 21 July 2006)
Using a foreign boat for fishing or related activities in Sri Lanka waters except under the
authority of a permit issued by DG with approval of the Minister
Sections 4 and 15 (a) of FFBA
Penalty for Non-Compliance: Fine not exceeding LKR 1.5 million and repatriation costs of
the crew, forfeiture of the boat and fishing equipment
Not maintaining a logbook issued by DFAR by a mechanized fishing boat fishing in Sri
Sections 61 of FARA; Fish Catch
Lanka waters; not maintaining a record of the catch of each fishing trip, or not furnishing a
Data Collection Regulations, 2012
certificate of the catch to the CA in the prescribed form or importing fish for re-export
(Gazette 1755/32 of 25 April 2012)
without a catch certificate & health certificate issued by the CA of the importing country.
Page 30 of 74You can also read