Spatio-Temporal Distribution of Juvenile Oceanic Whitetip Shark Incidental Catch in the Western Indian Ocean
←
→
Page content transcription
If your browser does not render page correctly, please read the page content below
ORIGINAL RESEARCH
                                                                                                                                             published: 01 June 2022
                                                                                                                                    doi: 10.3389/fmars.2022.863602

                                           Spatio-Temporal Distribution
                                           of Juvenile Oceanic Whitetip
                                           Shark Incidental Catch in
                                           the Western Indian Ocean
                                           Leire Lopetegui-Eguren 1,2*, Jan Jaap Poos 2,3, Haritz Arrizabalaga 1, Gency L. Guirhem 1,4,
                                           Hilario Murua 5, Nerea Lezama-Ochoa 6,7, Shane P. Griffiths 8, Jon Ruiz Gondra 1,
                                           Philippe S. Sabarros 9,10, José Carlos Báez 11,12 and Maria José Juan-Jordá 1
                                           1 AZTI, Marine Research, Basque Research and Technology Alliance (BRTA), Pasaia, Spain, 2 Aquaculture and

                                           Fisheries Group, Wageningen University and Research, Wageningen, Netherlands, 3 Wageningen Marine Research,
                                           Wageningen University and Research, IJmuiden, Netherlands, 4 Institute of Marine Fisheries and Oceanology, College
                                           of Fisheries and Ocean Sciences, University of the Philippines Visayas, Iloilo, Philippines, 5 International Sustainable
                                           Seafood Foundation, Washington, DC, United States, 6 Institute of Marine Sciences, University of California, Santa
                                           Cruz, Santa Cruz, CA, United States, 7 Mobula Conservation, La Paz, Mexico, 8 Ecosystem and Bycatch Program,
                                           Inter-American Tropical Tuna Commission, La Jolla, CA, United States, 9 MARBEC, Univ Montpellier, CNRS, Ifremer,
                                           IRD, Sète, France, 10 Institut de Recherche pour le Développement, Ob7, Sète, France, 11 Instituto Español de
                                           Oceanografı´a, Centro Oceanográfico de Málaga, Fuengirola, Spain, 12 Instituto Iberoamericano de Desarrollo
                            Edited by:     Sostenible (IIDS), Universidad Autónoma de Chile, Temuco, Chile
                 David M. P. Jacoby,
               University of Lancaster,
                      United Kingdom
                                           Oceanic whitetip shark (Carcharhinus longimanus) is an important top predator in pelagic
                         Reviewed by:
                                           ecosystems currently classified as globally Critically Endangered by the International Union
         Gonzalo Mucientes Sandoval,       for the Conservation of Nature. This species is incidentally caught by fisheries targeting
  Institute of Marine Research (CSIC),
                                           highly migratory tunas and billfishes throughout the Indian Ocean. Understanding the
                                 Spain
                   Neil Hammerschlag,      temporal, spatial and environmental factors influencing the capture of this species is
    University of Miami, United States     essential to reduce incidental catches. In this study, we used generalized additive models
                   *Correspondence:        to analyze the spatio-temporal distributions of the juvenile oceanic whitetip shark catches
               Leire Lopetegui-Eguren
                     llopetegui@azti.es
                                           and the environmental conditions in the western Indian Ocean using observer data from
                                           2010 to 2020 of the European Union and associated flags purse seine fishery. We found
                   Specialty section:      sea surface temperature and nitrate concentration to be the most important
         This article was submitted to
                    Marine Megafauna,
                                           environmental variables predicting the probability of catching an oceanic whitetip shark.
               a section of the journal    A higher probability of capture was predicted in areas where sea surface temperature was
          Frontiers in Marine Science      below 24°C and with low nitrate concentrations close to zero and intermediate values
         Received: 27 January 2022         (1.5-2.5 mmol.m-3). We also found a higher probability of capture in sets on fish
          Accepted: 28 March 2022
           Published: 01 June 2022         aggregating devices than in sets on free schools of tuna. The Kenya and Somalia basin
                              Citation:    was identified to have higher probabilities of capture during the summer monsoon (June to
         Lopetegui-Eguren L, Poos JJ,      September) when upwelling of deep cold waters occurs. We provide the first prediction
          Arrizabalaga H, Guirhem GL,
          Murua H, Lezama-Ochoa N,
                                           maps of capture probabilities and insights into the environmental preferences of oceanic
Griffiths SP, Gondra JR, Sabarros PS,       whitetip shark in the western Indian Ocean. However, the causal mechanisms behind
 Báez JC and Juan-Jordá MJ (2022)        these insights should be explored in future studies before they can be used to design
        Spatio-Temporal Distribution of
       Juvenile Oceanic Whitetip Shark     spatial management and conservation strategies, such as time-area closures, for
                 Incidental Catch in the   bycatch avoidance.
                Western Indian Ocean.
            Front. Mar. Sci. 9:863602.     Keywords: oceanic whitetip shark, species distribution model, bycatch species, tropical tuna purse-seine fishery,
     doi: 10.3389/fmars.2022.863602        Western Indian Ocean

Frontiers in Marine Science | www.frontiersin.org                                1                                           June 2022 | Volume 9 | Article 863602
Lopetegui-Eguren et al.                                                                                Spatio-Temporal Distribution of Oceanic Whitetip Shark

INTRODUCTION                                                                    difficulties of accessing data from national observer datasets (Ewell
                                                                                et al., 2020). To date, SDM studies of vulnerable bycatch species
The incidental catch continues to be a key management problem                   have been mostly conducted in the Eastern Pacific Ocean using
globally for sustainable fisheries. Fisheries targeting large predatory          Inter-American Tropical Tuna Commission (IATTC) observer
tuna, billfish and some shark species can have particularly large                data from the purse seine fishery—where there is 100% observer
impacts on a wide variety of non-target species including sharks,               coverage. These studies include dolphinfish (Coryphaena spp.)
rays, sea turtles, seabirds, and marine mammals. In this study, we              (Marı́n-Enrı́quez et al., 2018), sailfish (Istiophorus platypterus)
define bycatch as all non-targeted species plus the small or damaged             (Martinez-Rincon et al., 2015), wahoo (Acanthocybium solandri)
target tuna species that are not marketed through canneries                     (Martı́nez-Rincó n et al., 2012), olive ridley sea turtle (Lepidochelys
(Amandè et al., 2010). Bycatch species often have biological traits             olivacea) (Montero et al., 2016), and spinetail devil ray (Mobula
that make them more vulnerable to overfishing than most teleosts                 mobular) (Lezama-Ochoa et al., 2019). Since 2012, the European
(Hall and Roman, 2013; Clarke et al., 2014). Tuna Regional Fisheries            Union (EU) and associated flags tropical tuna purse seine fishery
Management Organizations (tRFMOs)—responsible for conserving                    have been voluntarily increasing its observer coverage over time,
and managing highly migratory species of tunas and billfishes—                   which is currently 100% in the Atlantic and Indian Oceans (Escalle
have adopted various management measures to mitigate or reduce                  et al., 2016; Ruiz et al., 2018). These fishery observer datasets were
impacts on vulnerable bycatch taxa. However, most tRFMOs have                   recently used to develop SDMs for vulnerable bycatch species, such
made only modest progress in managing bycatch (Gilman et al.,                   as whale shark (Rhincodon typus) (Bá ez et al., 2020), spinetail devil
2014; Juan-Jordá et al., 2018). The lack or insufficient data collection        ray (Lezama-Ochoa et al., 2020), and silky shark (Carcharhinus
and the low level of observer coverage in some fishery programs,                 falciformis) (Lopez et al., 2020) in the Atlantic Ocean.
together with the frequent lack of compliance with conservation and                 The EU and associated flags tropical tuna purse seine fishery
management measures have all contributed to insufficient bycatch                 targets skipjack (Katsuwonus pelamis), yellowfin (Thunnus
governance and management in tRFMOs (Maury et al., 2013;                        albacares), and bigeye tunas (Thunnus obesus), but also incidentally
Clarke et al., 2014; Gilman et al., 2014). Furthermore, existing                catches non-target species (Amandè et al., 2012; Ruiz et al., 2018).
management measures have mostly focused on modifying fishing                     This fishery operates using two types of fishing operations (or set
gear design and practices to reduce bycatch of vulnerable taxa,                 types): sets associated with drifting floating objects such as Fish
retention bans for some species, and adopting best-practices for                Aggregating Devices (FAD) designed to attract and aggregate tunas,
handling and releasing-at-sea to increase their probability of post-            and sets associated with free-swimming tuna schools (FSC) (Marsac,
release survival (Poisson et al., 2014; Goñi et al., 2015; Grande et al.,       2017). Currently, around 90% of the tuna catches by the purse seine
2020). Other measures such as bycatch limits or time-area closures              fishery in the Indian Ocean are derived from FAD sets, while the
to reduce interactions of fisheries with vulnerable species in tRFMOs            remaining 10% comes from FSC sets (IOTC, 2021). While FSC sets
have been limited to dolphins in the eastern Pacific Ocean (IATTC,               are generally made on monospecific schools of tuna, FAD sets attract
1999) and closures to reduce the catch of juvenile tunas (e.g. bigeye           tuna species and other pelagic fish and non-fish species, and have
tuna in the Atlantic) and swordfish (IATTC, 2009; Hall et al., 2017;             2.8–6.7 times higher catches of non-target species compared to FSC
Boerder et al., 2019). The efficacy of spatial management strategies             sets (Murua et al., 2021a). Incidentally captured species in both FAD
including static and dynamic time-area closures to reduce                       and FSC sets primarily include sharks, rays, and a range of bony
interactions with vulnerable bycatch species while keeping similar              fishes, while the interaction with sea turtles and marine mammals is
yields for target species remains a priority research area in tRFMOs            less frequent (Gray and Kennelly, 2018). Due to their specific life-
(Kaplan et al., 2014; Tolotti et al., 2015b; Hilborn et al., 2022).             history traits (generally slow growth and low reproductive potential),
    Understanding the temporal, spatial, and environmental factors              many shark and ray species are inherently susceptible to overfishing
influencing species distributions is essential to minimize the                   (Dulvy et al., 2021).
interactions of fisheries with bycatch species and identify areas of                 The oceanic whitetip shark (Carcharhinus longimanus) is a
high bycatch rates (Deakos et al., 2011). Species distribution models           highly migratory top predator in pelagic ecosystems, and is the
(SDMs), also known as ecological niche models, are widely used to               second most caught shark bycatch species in the tropical tuna
predict species distributions and environmental niche using species             purse seine fishery in the western Indian Ocean (Clavareau et al.,
occurrence or abundance and environmental information (Elith                    2020). This species was once described as one of the most
and Leathwick, 2009). These models are increasingly being used to               abundant shark species in tropical waters worldwide
support the development of conservation planning and spatial                    (Compagno, 1984). However, in recent decades, the species has
management tools such as static and dynamic time-area closures                  experienced marked population declines throughout the
(Hazen et al., 2018; Passadore et al., 2018; Welch et al., 2020).               majority of its global range due to overfishing (Tremblay-
SDMs have been developed for highly migratory pelagic fish                       Boyer et al., 2019; Pacoureau et al., 2021). In 2019, oceanic
species of commercial importance such as tunas (Setiawati et al.,               whitetip shark was classified as globally Critically Endangered by
2015; Erauskin-Extramiana et al., 2019), and billfishes (Su et al.,              the International Union for the Conservation of Nature (IUCN)
2011; Rooker et al., 2012; Brodie et al., 2018). However, applying              (Rigby et al., 2019), and was included in Appendix II of the
SDMs to bycatch species caught in tuna and billfish fisheries is                  Convention on International Trade in Endangered Species
challenging due to the difficulty of collecting quality bycatch data             (CITES; www.cites.org), which imposes strict regulation of its
across vast oceanic environments (McKinney et al., 2012),                       international trade. It is also listed in Annex I, Highly Migratory
including the low observer coverage in some fisheries, and the                   Species, of the United Nations Convention on the Law of the Sea

Frontiers in Marine Science | www.frontiersin.org                           2                                        June 2022 | Volume 9 | Article 863602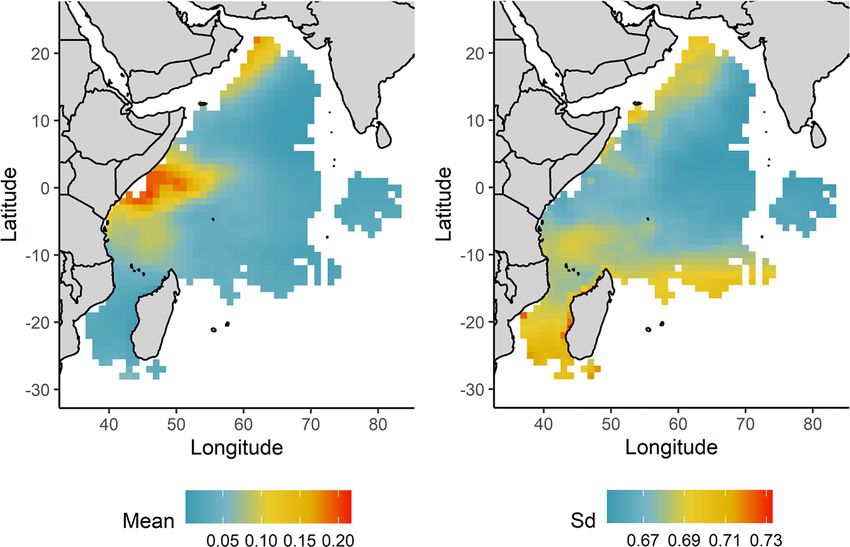
Lopetegui-Eguren et al.                                                                             Spatio-Temporal Distribution of Oceanic Whitetip Shark

(UNCLOS; www.un.org). All tRFMOs have adopted                                 mesoscale processes such as eddies, filaments, fronts, and whirls
conservation and management measures to prohibit the                          also affect biological productivity, affecting the distribution of
retention on board and trade of oceanic whitetip sharks caught                oceanodromous species such as tunas (Orue et al., 2019). For
in tuna and billfish fisheries (ICCAT, 2010; IATTC, 2011; IOTC,                 example, the Seychelles-Chagos thermocline ridge (55°E-65°E;
2013; WCPFC, 2019). Despite these measures there is no                        5°S-12°S) features a productive open-ocean upwelling area during
evidence that the oceanic whitetip shark decline has stopped                  the winter monsoon (Hermes and Reason, 2008), while the
(Pacoureau et al., 2021).                                                     Mozambique Channel has a complex circulation influenced by
     Oceanic whitetip shark is epipelagic and spends most of its time         mesoscale eddies (Schott et al., 2009). Such oceanic features affect
within the upper 200 m of the water column, in oceanic waters                 the biophysical characteristic of the water column (i.e., chlorophyll-
between 20-28°C (Tolotti et al., 2017; Andrzejaczek et al., 2018).            a, temperature, salinity, dissolved oxygen), which in turn affect the
However, the species has been recorded diving to > 200 m and                  abundance of pelagic species in the area (Kai et al., 2009; Escalle
temperatures down to 7.8°C for short periods (Howey et al., 2016;             et al., 2015; Orue et al., 2019) and the spatial dynamics of the
Tolotti et al., 2017). These dives may be linked to foraging or               fisheries targeting them (Marsac, 2017).
navigation behavior (Howey et al., 2016). Long distance migrations
have been recorded for this species as well as presumed philopatry            Data Collection
(i.e., site fidelity) (Musyl et al., 2011; Howey-Jordan et al., 2013;          Fisheries Observer Data
Tolotti et al., 2015a). For example, in the Indian Ocean, the species         We used observer data collected by human observers and Electronic
has exhibited trans-equatorial movements of up to 6,500 km                    Monitoring System (EMS) on board the EU and associated flags
(Filmalter et al., 2012). Despite relevant ecological research on this        (Seychelles) tropical tuna purse seine fishery between 2010 and 2020
species there is little understanding of the relationship between their       (Supplementary Figure 2A). We analyzed a total of 26,523 observed
spatial distribution and prevailing environmental conditions across           sets, covering around 27% of all sets within this fishery between
large spatial oceanic scales, such as the western Indian Ocean.               2010-2020. About 87.4% and 12.6% of the observed sets analyzed
     The main objective of this study was to investigate the spatio-          were FADs and FSC sets, respectively (Supplementary Figure 2B).
temporal distribution of the oceanic whitetip shark incidental catch          We considered all drifting floating objects as FADs irrespective
related to environmental conditions in the western Indian Ocean.              whether they were artificial or natural. While the observer program
We used the EU and associated flags tropical tuna purse seine fishery           started in 2003 under the EU Data Collection Framework
observer data between 2010 and 2020 to develop yearly and seasonal            (Regulation (EU) 2017/1004) with a 10% observer coverage,
SDMs using generalized additive models to identify areas with high            sampling effort dramatically decreased during 2009-2011 owing to
incidental bycatch probability. We provide the first prediction maps           the high incidences of piracy in the area. Sampling resumed in 2012
of capture probabilities and insights into the environmental                  and the fleet voluntarily agreed to monitor 100% of sets. Since 2014,
preferences of oceanic whitetip shark in the western Indian Ocean.            the observed spatial coverage has progressively increased through
Yet our model results should be further tested and validated with             private contracts, presently reaching almost 100% coverage of the
additional sampling and modeling approaches, before it can be used            fleet (Goujon et al., 2017; Ruiz et al., 2018) (Supplementary
to inform spatial management and conservation strategies, such as             Figure 2C). In 2017 EMS started to complement human observers
time-area closures, to reduce the bycatch of this shark species while         in the task of collecting fishery data (Supplementary Figure 2A).
maintaining the yield of target species.                                          The observer dataset contained operational set data including
                                                                              set positions (longitude, latitude), dates, GMT hours, fishing set
                                                                              type (FAD or FSC), and vessel and observer identifiers. For each
MATERIAL AND METHODS                                                          set, the total catch (in tons) and target tuna composition of the
                                                                              catch (skipjack, yellowfin, and bigeye tunas) and non-target
Study Area                                                                    species catch was recorded. The non-target catch (here referred
The EU and associated flags purse seine fishery targeting tropical              as bycatch) was either retained for its commercial value (e.g.,
tuna species in the Indian Ocean is primarily concentrated in the             small tunas Auxis sp.) or discarded at sea (dead or alive) because
western Indian Ocean (Figure 1 and Supplementary Figure 1). In                of its low commercial value or prohibition of retention as is the
the western Indian Ocean, the ocean surface circulation is                    case with the oceanic whitetip shark (Amandè et al., 2012; Ruiz
influenced by seasonal monsoon winds that affect biological                    et al., 2018).
productivity (Schott and McCreary, 2001). Two major monsoon                       For bycatch shark species, the number and mean size of
regimes occur in the region: the winter monsoon from December to              individuals by set were recorded. The mean length of oceanic
March (Northeast monsoon), and the summer monsoon from June                   whitetip sharks caught in each set ranged from 48 to 350 cm of
to September (Southwest monsoon). These are separated by the                  total length (TL), while 90.2% of the sets had average lengths <
spring intermonsoon (April and May) and autumn intermonsoon                   186 cm. Given this species reach sexual maturity at 186 cm
(October and November). During the summer monsoon, a strong                   (Young and Carlson, 2020), the vast majority of individuals
upwelling occurs in the western Indian Ocean where cold and                   caught were juveniles, with individuals caught in FAD sets being
highly saline waters come to the surface, increasing primary                  slightly smaller than in FSC sets (Supplementary Figure 3).
production, particularly along the coast of Somalia to 500 km                 Therefore, our habitat modeling is reflective of the spatio-
offshore (Hitchcock et al., 2000; Wiggert et al., 2006). Other                temporal distribution of juvenile oceanic whitetip sharks across

Frontiers in Marine Science | www.frontiersin.org                         3                                       June 2022 | Volume 9 | Article 863602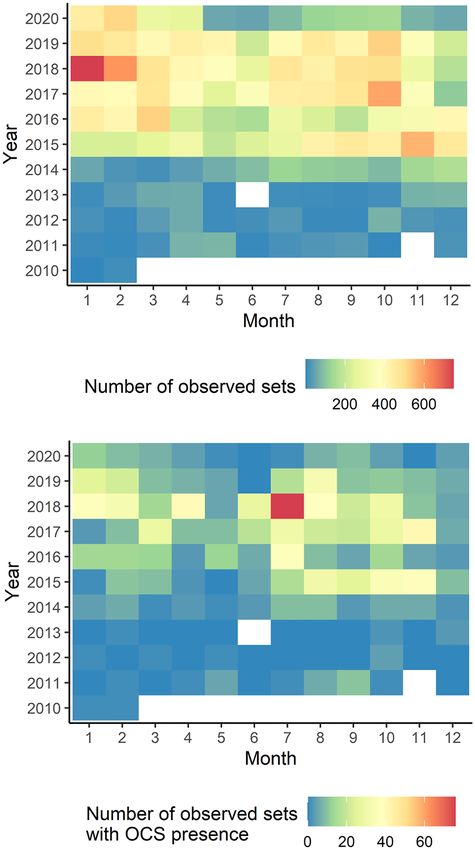
Lopetegui-Eguren et al.                                                                                            Spatio-Temporal Distribution of Oceanic Whitetip Shark

 FIGURE 1 | Spatial distribution of cumulative effort (observed sets) in the EU and associated flags purse seine fishery from 2010-2020 and observed presences of oceanic
 whitetip shark catch by set type (FAD in green dots and FSC in blue dots) by monsoon regimes: winter monsoon (December-March), spring intermonsoon (April and May),
 summer monsoon (June-September) and autumn intermonsoon (October and November). Check Supplementary Figure 1 for a better appreciation of the cumulative
 number of observed sets and oceanic whitetip shark catches by set type.

the fishing grounds of the EU and associated flags purse seine                            copernicus.eu/). We selected biological and physical variables
tropical tuna fishery in the western Indian Ocean.                                       based on previous research, for the position and date of each
                                                                                        fishing set: chlorophyll-a (Chl), primary production of
Environmental Data                                                                      phytoplankton (NPPV), oxygen (O2), nitrate (NO3), phosphate
Environmental data were obtained at 0.25° spatial and daily                             (PO4) and silicate (Si) concentrations, sea surface temperature
temporal resolution from the EU Copernicus Marine                                       (SST), sea surface height (SSH), mixed layer depth (MLD) and
Environment Monitoring Service (CMEMS) (https://marine.                                 salinity (Sal) (Table 1). We also extracted the eastward (Uo) and

Frontiers in Marine Science | www.frontiersin.org                                   4                                             June 2022 | Volume 9 | Article 863602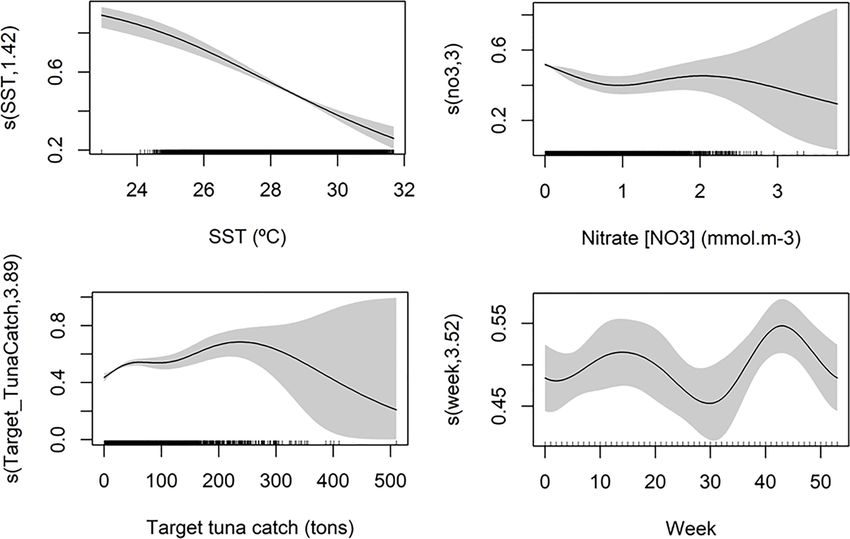
Lopetegui-Eguren et al.                                                                                                  Spatio-Temporal Distribution of Oceanic Whitetip Shark

TABLE 1 | Summary of the predictor environmental variables used in the analysis.

Variable abbreviation                          Variable name                              Units                Average                Min                Max               Source

                                                                                             -3
Chl                                Chlorophyll                                        mg.m                      0.197                0.057              1.590            001_029
NPPV                               Primary Production of Phytoplankton                mg.m-3.day-1              10.74                0.595              79.59            001_029
O2                                 Oxygen                                             mmol.m-3                  203.1                191.4              221.8            001_029
NO3                                Nitrate                                            mmol.m-3                  0.158               0.0004              3.768            001_029
PO4                                Phosphate                                          mmol.m-3                  0.102              0.00004              0.569            001_029
Si                                 Silicate                                           mmol.m-3                  1.809                0.408              12.72            001_029
Chl fronts                         Chlorophyll fronts                                 ratio                     0.016              0.00001              1.329            Calculated
SST                                Sea Surface Temperature                            °C                        28.57                22.94              31.68             001_30
SST fronts                         Sea Surface Temperature fronts                     °C.km-1                   0.022               0.0003              0.096            Calculated
SSH                                Sea Surface Height                                 m                         0.372               0.0564              0.909             001_30
MLD                                Mixed Layer Depth                                  m                         18.47                9.783              104.5             001_30
Sal                                Salinity                                           psu                       35.31                32.36              37.05             001_30
Ke                                 Eddy kinetic energy                                m/s                       0.093              0.000001             1.974            Calculated
Vel                                Velocity of the current                            m/s                       0.362              0.00106              1.987            Calculated
Heading                            Heading of the current                             degrees                   178.5                 0.00              360.0            Calculated

All variables were extracted with a 0.25° spatial and daily temporal resolutions, from Reanalysis (RAN) and Near Real Time (NRT) models. Variable acronym and name, units, and source
(Copernicus product reference).

northward (Vo) velocity vectors from CMEMS and used them to                                       The predictor variables considered in the modeling were
calculate the eddy kinetic energy (Ke), velocity (Vel), and                                   environmental (Table 1), spatial (latitude and longitude),
heading of the current (Heading). Last, we calculated                                         temporal (year, week, hours from sunrise) and operational
chlorophyll-a and sea surface temperature fronts based on                                     information including set type (FSC or FAD) and the total
previously extracted sea surface temperature and chlorophyll-a                                catch of target and non-target species in each set. The target
data using a front detection algorithm (Belkin and                                            tuna catch (TargetTunaC, in tons) and total fish bycatch
O'Reilly, 2009).                                                                              (TotalBC, in tons) of each fishing set, excluding oceanic
                                                                                              whitetip sharks, accounted for the potential effect of the fish
Statistical Analysis                                                                          community size, as sharks may be found in association with
Modeling Approach                                                                             other species when they are juveniles (Jacoby et al., 2012).
We analyzed the relationships between oceanic whitetip shark                                      The degrees of freedom of the smooth functions for each
capture (presence/absence in the set) and environmental, fishery                               predictor variable in the models were restricted to avoid over-
and spatio-temporal variables using Generalized Additive                                      fitting and to simplify interpretation of the results (Wood, 2006).
Models (GAMs). GAMs are a widely used statistical modeling                                    We limited the maximum degrees of freedom (measured as
tool to analyze relationships between the distribution of marine                              number of knots, k) in the smoothing functions to k = 6 for
species and their environment, as they are capable of capturing                               main effects and, k = 20 for interaction effects (Lezama-Ochoa
non-linear relationships by fitting smoothing functions to                                     et al., 2019; Lopez et al., 2020). Each GAM was fitted using thin
predictor variables (Guisan et al., 2002). This method is based                               plate regression splines for non-linear covariates, except for week
on the use of non-parametric smoothing functions that allows a                                and heading variation, where a cyclic cubic regression spline was
flexible description of complex species relationships with                                     used to account for a cyclical effect, and a two-dimensional thin
different predictor variables (Zuur et al., 2007). The general                                plate regression spline surface to account for spatial effects
structure of the GAM used was:                                                                (latitude, longitude) of each fishing set (Wood, 2006). The gam
                                                                                              function of the mgcv package was used to fit the model
        g(mi ) = a + f1 (X1i ) + f2 (X2i ) + f3 (X3i ) … : + fn (Xni )                        (Wood, 2014).
where g is the link function (logit for binomial family), mi is the
expected response variable (presence/absence in our case), a is                               Correlation and Multicollinearity of
the intercept, f1 to fn are smooth functions (thin plate or cyclic                            Predictor Variables
cubic regression splines), and X1i to Xni are the covariates                                  We used two measures to determine the correlation and
(Guisan et al., 2002).                                                                        multicollinearity between predictor variables before fitting the
   We modelled the probability of catching an oceanic whitetip                                GAMs. First, all predictor variables were explored using
shark in an individual set as a function of the predictor variables.                          Pearson’s rank correlation (Wood, 2006). Pairs of variables
We modelled the catch data as present-absent and not the total                                with high correlation values (|r| > 0.6) were detected
catch of sharks as numbers of fish in each specific set because one                             (Supplementary Figure 5). The pairs of (1) sea surface
single oceanic whitetip shark was caught in most of the sets                                  temperature - oxygen, (2) sea surface temperature - primary
(Supplementary Figure 4). Therefore, the catch of oceanic                                     production of phytoplankton, (3) primary production of
whitetip sharks was transformed to the unit of presence/                                      phytoplankton - nitrate, (4) primary production of
absence (1/0) and considered as the dependent variable in                                     phytoplankton - oxygen and (5) salinity - latitude were highly
the model.                                                                                    correlated and thus we did not include them in the model at the

Frontiers in Marine Science | www.frontiersin.org                                        5                                               June 2022 | Volume 9 | Article 863602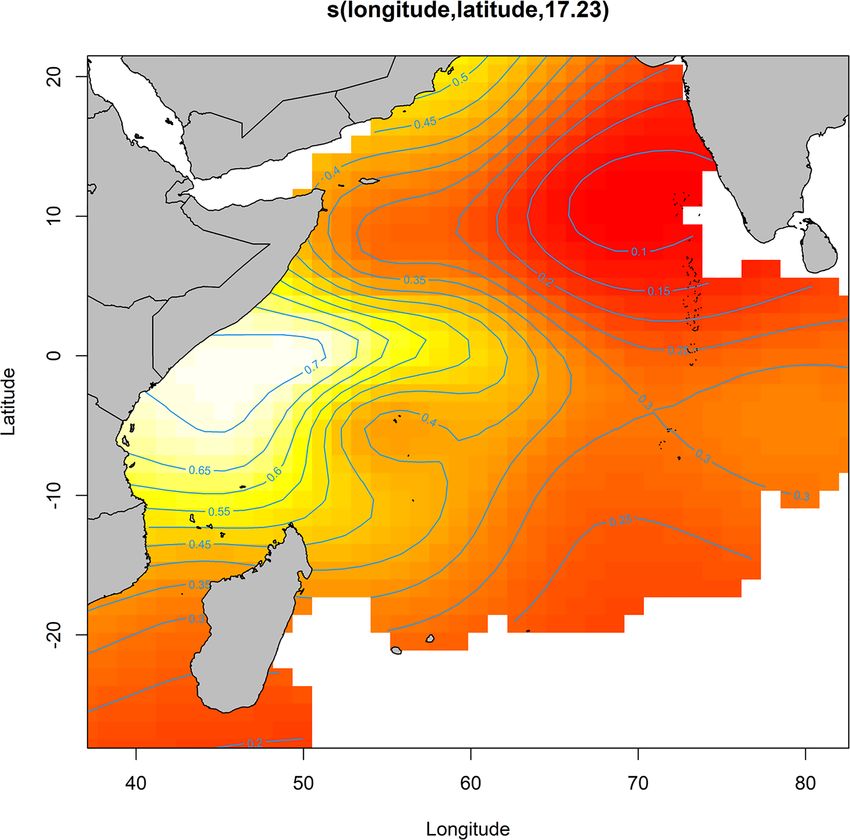
Lopetegui-Eguren et al.                                                                           Spatio-Temporal Distribution of Oceanic Whitetip Shark

same time (Supplementary Figure 5). Furthermore,                             2010). The AUC is a threshold independent index that ranges
multicollinearity between variables was examined conducting a                from 0 to 1, and measures the ability of the model to correctly
Variance Factor Analysis (VIF) with a cut-off value of 5 (Zuur               predict species presence or absence (Elith et al., 2006). An AUC
et al., 2009) using the vifstep function of the usdm package in R            value of 0.5 indicates that the prediction is as good as random,
(Naimi et al., 2014). This function deals with multicollinearity             whereas 1 indicates perfect prediction (Fielding and Bell, 1997).
problems by excluding highly collinear variables from a set                  The TSS index, which is calculated as sensitivity plus specificity
through a stepwise procedure. Based on the VIF test, the                     minus 1, ranges from -1 to +1, where 0 indicates no predictive
variables total catch, chlorophyll-a and velocity of the current             skill, +1 indicates perfect agreement, and values of zero or less
were excluded due to high collinearity with target tuna catch,               indicate a performance no better than random (Brodie et al.,
primary production of phytoplankton and kinetic energy                       2015). The sensitivity, specificity and TSS indices are threshold
(Supplementary Table 1).                                                     dependent and thus, for these indices a selection of a threshold is
                                                                             necessary to transform the probabilities into binary predictions
Model Selection                                                              (presence or absence) (Jimé nez-Valverde and Lobo, 2007).
We applied a forward stepwise variable selection procedure to build          Different methods can be used in order to select this threshold
models using the full dataset. This consisted of building the null           probability value (Pearson, 2010). Based on the low prevalence
model (intercept only model) and then adding one new covariate at            (number of presences) in our dataset, we used the Maximized
a time to check its contribution to the model (Venables and                  Sum Threshold (MST) method to establish the threshold for the
Dichmont, 2004). Covariate contributions were evaluated using                accuracy indices (Liu et al., 2005; Jimé nez-Valverde and Lobo,
model Akaike Information Criterion (AIC) and studying their                  2007). The MST method gives the most accurate predictions
significance (based on p-value). We only included significant                  with low prevalence data while avoiding omission (false
covariates (p < 0.05) and those with large relative contributions to         negative) errors.
AIC (DAIC > 2) in each step of the selection procedure. At the end,
the final model was selected based on the lowest AIC value and the            Model Predictions
highest explained deviance (Akaike, 1974). We assessed the relative          We used the final model to predict the probability of catching an
contribution of each predictor variable on the oceanic whitetip              oceanic whitetip shark weekly between 2010-2020 and with a
shark catch using partial effect plots. These plots show the effect of       spatial resolution of 1° latitude x 1° longitude, using the
each predictor variable on the dependent variable (presence/absence          predict.gam function of the mgcv package (Wood, 2014). For
of oceanic whitetip shark catch) after accounting for the average            the model predictions, we used the environmental conditions of
effect of all other variables in the model. Therefore, they provide an       sea surface temperature and nitrate (the selected variables in the
indication of how the oceanic whitetip shark catch depends on each           final model) present in each time period (each week for 11 years
predictor variable (Wood, 2006). We also run univariate binomial             [2010-2020]) with the spatial resolution of 1° latitude x 1°
GAMs for each predictor variable, which provided information both            longitude grid cell. We also used the variable FAD set type as
on their raw likely contribution to the deviance explained and the           the baseline for the predictions and set the variable of target tuna
potential functional shape of each predictor variable on the                 catch to mean levels. Then, we averaged the predicted weekly
response variable.                                                           probabilities (and calculated the standard deviation) to obtain an
                                                                             overall mean prediction map (considering 11 years of weekly
Model Validation                                                             predictions). We also calculated seasonal prediction maps by
We validated the final model using a cross-validation procedure               averaging weekly probabilities for each monsoon regime: winter
(Elith and Leathwick, 2009). The dataset was randomly split                  monsoon, spring intermonsoon, summer monsoon, and
into two sets: a training dataset to calibrate the model, and a              autumn intermonsoon.
testing dataset to evaluate the predictions. A k-fold cross-                     In addition, we also produced yearly predictions of oceanic
validation (k = 5) method was applied to split the training                  whitetip shark catch probabilities to assess interannual patterns
(80%) and testing (20%) data (Elith and Leathwick, 2009)                     using two approaches. First, we allowed the year effect (selected
using the kfold function from the dismo package (Freeman and                 as significant in the final model) to vary in the predictions to
Moisen, 2008) in R software (Hijmans et al., 2020). We repeated              explore potential interannual changes. Thus, by considering the
this procedure 5 times following the 5-fold cross-validation, and            estimated year specific coefficients, we predicted the yearly
the performance scores’ obtained were averaged over the                      probability of oceanic whitetip capture, reflecting changes due
different random sets to evaluate the predictive performance of              to the environment as well as overall resource abundance and
the distribution model (Pearson et al., 2006). Model performance             catchability. Second, we fixed the year effect (using the year 2010
was evaluated by computing a confusion matrix of the predicted               as the baseline for the predictions) to examine interannual
and observed values using the PresenceAbsence R package                      changes in the probability of oceanic whitetip shark capture
(Freeman and Moisen, 2008). From the confusion matrix, we                    solely due to the environment (Arrizabalaga et al., 2015). The
calculated the Area Under the receiver operating Curve (AUC),                ranges for the environmental variables in the environmental
sensitivity (proportion of presences correctly predicted),                   prediction dataset extended only 0.7% beyond the ranges
specificity (proportion of absences correctly predicted), and the             observed in the environmental variables recorded in the
mean True Skill Statistic (TSS) validation indices (Pearson,                 observed sets.

Frontiers in Marine Science | www.frontiersin.org                        6                                      June 2022 | Volume 9 | Article 863602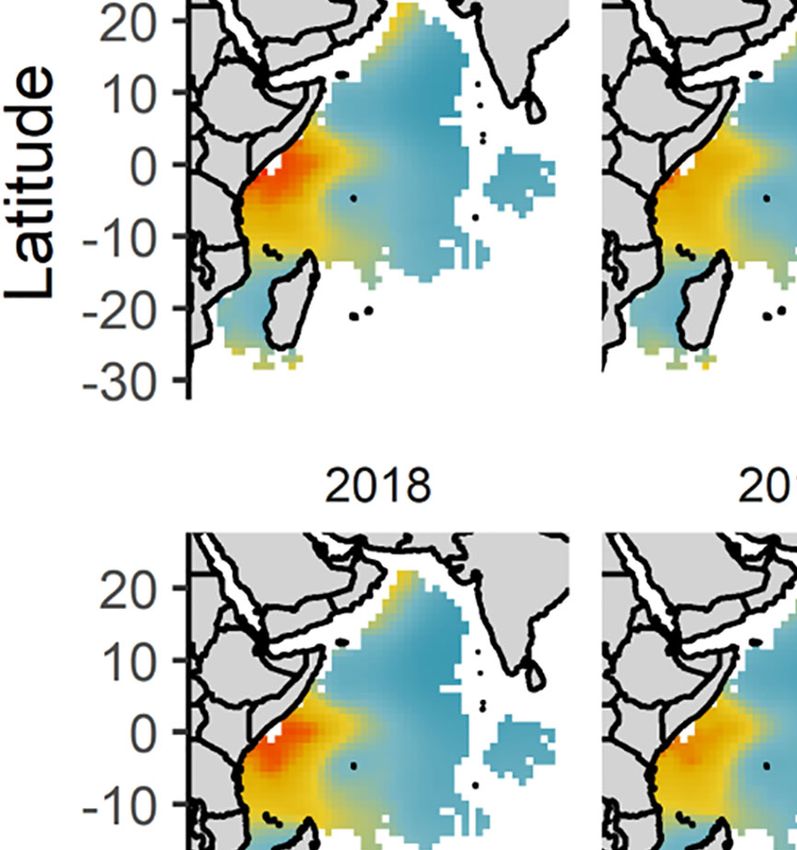
Lopetegui-Eguren et al.                                                                             Spatio-Temporal Distribution of Oceanic Whitetip Shark

RESULTS
                                                                               A
Spatio-Temporal Patterns of Observed
Sets and Presence of Oceanic Whitetip
Shark Catch
The fishing grounds of this fishery varied by season (Figure 1
and Supplementary Figure 1). During the winter monsoon, the
observed fishing effort spread across the equatorial region
(southeast Seychelles and Chagos region) (Supplementary
Figure 1). In the spring intermonsoon the fleet operated
mainly in the Mozambique Channel and northwest Seychelles
region using both fishing techniques (Supplementary
Figures 1A, B). During the summer monsoon the fleet
operated predominantly using FADs in the northwest Indian
Ocean where the coastal upwelling takes place (Supplementary
Figure 1A). In the autumn intermonsoon, as primary
productivity levels fall and the catch rate on FADs decreases,
the fleet moved into the equatorial Indian Ocean to set on free-                B
swimming schools of tunas, which are aggregated for spawning
(Supplementary Figure 1B).
   The number of observed sets was lower between 2010 and
2014, compared to the later years. After 2015, the number of
observed sets progressively increased (Figure 2A). Over the
whole period (2010-2020), observed fishing sets were
distributed across all months of the year, with slightly larger
numbers during the winter monsoon (Figure 2A). Oceanic
whitetip sharks were present in 4.5% of observed sets. The
catch of this shark was recorded throughout the year with
some apparent differences between monsoon regimes
(Figures 1, 2B). The largest number of presences of oceanic
whitetip sharks were recorded during summer monsoon months
(Figure 2B). Moreover, of the total number of sets where oceanic
whitetip sharks were present, 93.7% were FAD sets (presence in
FAD sets by regime: 84% winter, 82.3% spring, 88.7% summer
and 95% autumn, Supplementary Figures 1C, D).

Model Building and the Effect of                                            FIGURE 2 | Temporal patterns of the EU and associated flags purse seine
Predictor Variables on Oceanic Whitetip                                     fishing activity (observed sets) and observed presences of oceanic whitetip
Shark Bycatch                                                               shark catch. (A) Total number of observed sets in the fishery represented per
                                                                            month between 2010-2020. (B) Total number of sets with presence of
Considering the correlation and multicollinearity of covariates,            oceanic whitetip shark catch per month between 2010-2020.
we considered ten possible combinations as candidate models in
the variable selection procedure (Table 2). The final model
(GAM 1, Table 2) explained 8.96% of the total deviance (the                Somalia coast as an area with a higher probability of catching an
most parsimonious model based on the lowest AIC value) with                oceanic whitetip shark (Figure 3). The model also indicated a
an adjusted r2 of 0.043 (Table 3).                                         linear increase in the catch probability with decreasing
    The final model included (1) as predictors environmental                temperatures, with higher probabilities in areas with lower
variables sea surface temperature and nitrate, (2) as spatial and          sea surface temperature (< 24°C) relative to the range
temporal variables the latitude and longitude interaction, year,           encountered by the fishery (23-32°C, Figure 4A). Higher catch
week, and (3) as fishery related variables the set type and the total       probabilities were also predicted in areas with low values of nitrate
amount of target tuna caught per set (Supplementary Table 2).              (NO3) close to zero and intermediate values of nitrate (1.5-2.5
The individual contribution of each variable to the model                  mmol.m-3), relative to the range encountered by the fishery (0-3.77
revealed the interaction between latitude and longitude                    mmol.m-3, Figure 4B). There was also a relationship between the
(5.30%), sea surface temperature (3.55%) and nitrate (1.39%)               probability of catching an oceanic whitetip shark and the total
were the most significant variables (Supplementary Table 3).                target tuna catch in the set, with higher catch probabilities
    The final model indicated a significant interaction between              observed in sets with relatively large target tuna catch (between
latitude and longitude and highlighted the area off the Kenya-             200 and 300 tons, Figure 4C). The time of the year also affected

Frontiers in Marine Science | www.frontiersin.org                      7                                          June 2022 | Volume 9 | Article 863602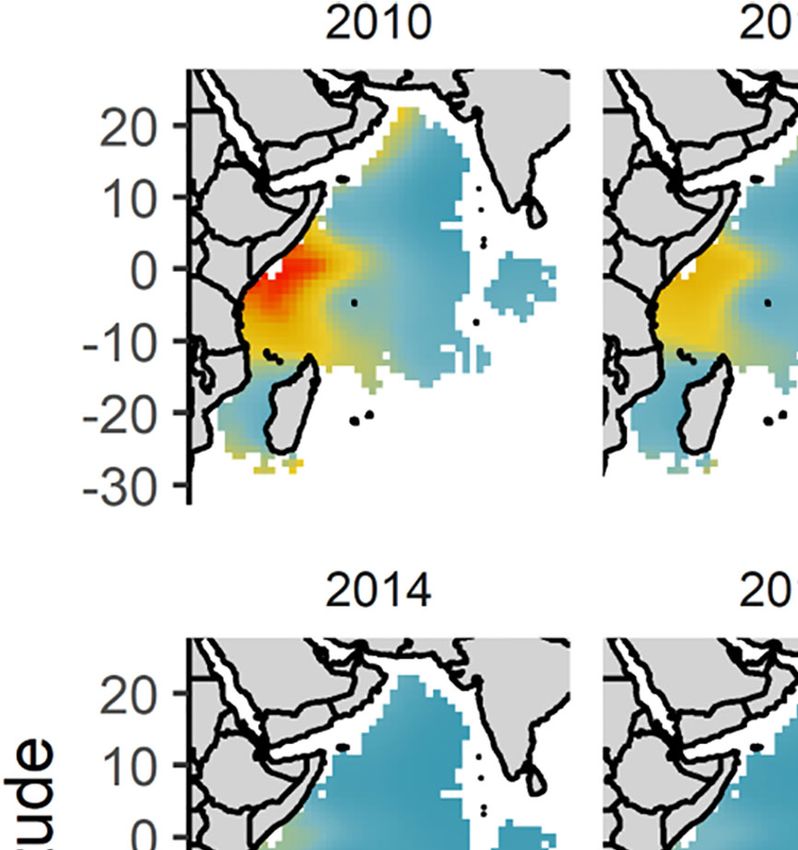
Lopetegui-Eguren et al.                                                                                          Spatio-Temporal Distribution of Oceanic Whitetip Shark

TABLE 2 | Explored GAMs candidates with corresponding Akaike Information Criteria (AIC), explained deviance (Dev. %) values and the variables selected for each model.

GAM                          AIC                     Dev. %                                                           Variables

1                         8891.513                   8.96%                     Latitude * Longitude + SST + Year + Set type + Target catch + Week + NO3
2                         8920.073                   8.55%                     Latitude * Longitude + Year + O2 + Set type + Target catch
3                         8912.928                   8.67%                     Latitude * Longitude + Year + NPPV + Set type + Target catch
4                         8911.527                   8.59%                     Latitude * Longitude + SST + s(Year) + Set type + Target catch + NO3
5                         8947.003                   8.26%                     Latitude * Longitude + O2 + s(Year) + Set type + Target catch + NO3 + MLD
6                         8941.414                   8.26%                     Latitude * Longitude + NPPV + s(Year) + Set type + Target catch
7                         8928.135                   8.39%                     Latitude * Longitude + SST + Set type + NO3 + Target catch + Salinity
8                         8911.527                   8.59%                     Latitude * Longitude + SST + s(Year) + Set type + Target catch + Week + NO3
9                         8895.318                   8.86%                     Latitude * Longitude + SST + Year + Set type + Target catch + Week
10                        8986.188                   8.14%                     SST * Latitude + Week + Set type + Year + Target catch + Salinity + SSH + MLD + NO3

"*" means interaction between variables.

the catch probability, with higher probabilities peaking around                        catching an oceanic whitetip shark and identify areas with higher
week 15 (April, spring intermonsoon) and week 43 (October),                            catch probabilities for this species. Yet the moderate values of the
right after summer monsoon (Figure 4D).                                                accuracy indices imply that the model may have over or under
   The year and set type modelled as categorical variables also                        predicted catch probabilities.
contributed to explain the catch of an oceanic whitetip shark
(Figure 5). Higher probabilities of capture were predicted at the                      Spatial Predictions
beginning of the study period (year 2010 and 2011), followed by                        The overall mean predictions of the probability of catching an
a decrease in 2012 and stabilization for the rest of the study                         oceanic whitetip shark over 2010-2020 suggest higher catch
period (Figure 5A). Finally, higher probabilities of oceanic                           probabilities in the area offshore of Kenya-Somalia coast
whitetip shark capture were observed in FAD sets compared to                           (Figure 6). The seasonal mean predictions for each monsoon
FSC sets (Figure 5B).                                                                  period indicated that the high probability of capturing an oceanic
                                                                                       whitetip shark in the Kenya-Somali basin remained throughout
Model Performance                                                                      all the seasons but its extent varied seasonally (Figure 7). The
The accuracy indices used to evaluate the model performance                            probability of capture was higher and extended to a larger area
showed moderate values (AUC: 0.72, Sensitivity: 0.68, Specificity:                      during the summer monsoon (June-September), reaching down
0.68, TSS: 0.36, Table 4) suggesting a fair model accuracy.                            to the southern Mozambique Channel. During the winter
Despite the low prevalence of the species (4.5%) in the total                          monsoon (December-March) the capture of this species was
observed sets, the model was able to predict the probability of                        also predicted off the coast of Oman (Figure 7).

TABLE 3 | Summary results for the parametric coefficients and smooth terms of the final GAM selected to model the probability of catching an oceanic whitetip shark in
the western Indian Ocean over 2010-2020. Estimated degrees of freedom (e.d.f.).

Family                                              Binomial
Link function                                       Logit
Adjusted r2                                         0.043
Deviance explained                                  8.96 %

Parametric coefficients                              Estimate                            Std. Error                           z value                           Pr (>|z|)
Intercept - 2010                                     -1.9166                             0.7892                              -2.429                            0.0152
2011                                                 -0.4160                             0.8237                              -0.505                            0.6135
2012                                                 -1.9810                             0.8811                              -2.248                            0.0246
2013                                                 -1.8013                             0.8923                              -2.019                            0.0435
2014                                                 -1.4173                             0.8038                              -1.763                            0.0779
2015                                                 -1.4060                             0.7933                              -1.772                            0.0764
2016                                                 -1.6072                             0.7948                              -2.022                            0.0432
2017                                                 -1.3541                             0.7927                              -1.708                            0.0876
2018                                                 -1.0794                             0.7910                              -1.365                            0.1724
2019                                                 -1.6888                             0.7936                              -2.128                            0.0333
2020                                                 -1.6345                             0.7985                              -2.047                            0.0407
Set type (FSC)                                       -0.6727                             0.1296                              -5.189                            < 0.001

Smooth terms                                          e.d.f                              Ref. df                              Chi.sq                           p-value
Latitude * Longitude                                 17.232                              18.665                              304.748                           < 0.001
Sea surface temperature                              1.419                               1.738                               91.880                            < 0.001
Target tuna catch                                    3.893                               4.415                               29.532                            < 0.001
Week                                                 3.516                               4.000                                9.345                            0.02970
Nitrate                                              2.997                               3.646                               15.331                            0.00371

Frontiers in Marine Science | www.frontiersin.org                                  8                                           June 2022 | Volume 9 | Article 863602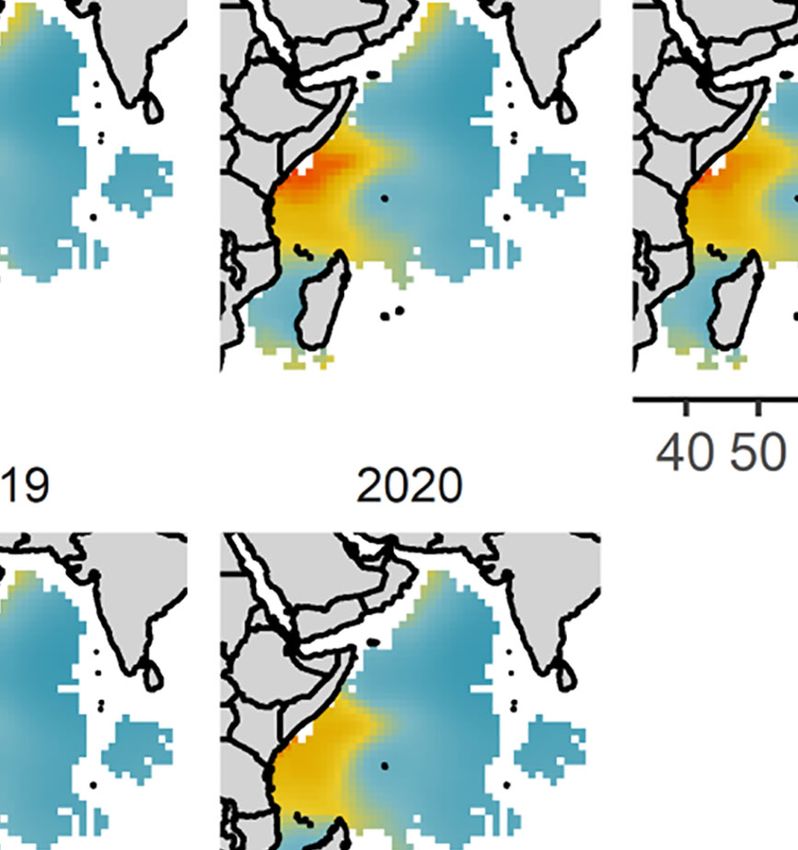
Lopetegui-Eguren et al.                                                                                     Spatio-Temporal Distribution of Oceanic Whitetip Shark

                                                                                      such low explained deviance is common in studies modeling the
                                                                                      spatio-temporal distributions of data poor bycatch species (10.2-
                                                                                      19%) (Lopez et al., 2017; Lezama-Ochoa et al., 2020). Studies
                                                                                      modeling the spatial distributions of commercially important
                                                                                      target species of tunas usually explain a higher percentage of total
                                                                                      deviance in the models (33.7-62.4%) (Su et al., 2011; Erauskin-
                                                                                      Extramiana et al., 2019), in part because these studies include
                                                                                      data from fisheries that cover a large (or even whole) area of the
                                                                                      species distribution.
                                                                                          Sea surface temperature was the most important environmental
                                                                                      predictor explaining the catch of a juvenile oceanic whitetip shark in
                                                                                      the purse seine fishery, suggesting higher catch probabilities
                                                                                      decreasing linearly with increasing temperature. Due to the
                                                                                      small thermal range encountered by the fishery in the study area
                                                                                      (23-32°C), the model was not able to find a unimodal distribution
                                                                                      of preferred temperatures as expected based on the ecological niche
                                                                                      theory (Hutchinson, 1957). However, our results are consistent with
                                                                                      existing tagging studies that found out that the thermal range of
                                                                                      preference of this shark is between 20-28°C (Musyl et al., 2011;
                                                                                      Tolotti et al., 2017; Andrzejaczek et al., 2018). Sea surface
                                                                                      temperature of 28°C marked a distinct change in vertical
                                                                                      movements of tagged oceanic whitetip sharks affected by
 FIGURE 3 | Partial effect of the interaction between latitude and longitude in       thermocline depth (Tolotti et al., 2017; Andrzejaczek et al., 2018)
 the final model for predicting the catch probability of an oceanic whitetip           and thus, we expected this variable to influence the spatial
 shark. Isoclines indicate the catch probability.                                     distribution of this species. Studies on distribution of pelagic
                                                                                      shark species, such as blue shark (Prionace glauca), whale shark
    Yearly predictions of the probability of catching an oceanic                      and silky shark, also suggest that sea surface temperature strongly
whitetip shark showed the highest catch probability in the                            influences the distribution of these species (Carvalho et al., 2011;
Kenya-Somali basin at the beginning of the study period (year                         Afonso et al., 2014; Hacohen-Domené et al., 2015; Lezama-Ochoa
2010 and 2011) and intermediate catch probability in the year                         et al., 2016; Lopez et al., 2020). Other studies in the Indian Ocean
2018 relative to the rest of the period (Figure 8A).                                  have also found out that sea surface temperature to be the main
    When only the environmental predictor variables were                              environmental predictor explaining the distribution of pelagic fish
allowed to vary and the year 2010 was used as baseline, the                           species such as albacore (Thunnus alalunga) (Chen et al., 2005),
interannual variation in the catch probability was substantially                      bigeye (Lee et al., 2005), yellowfin and skipjack tunas (Arrizabalaga
reduced. However, some interannual variability was also                               et al., 2015).
observed (Figure 8B). Predictions were consistent over time,                              The other environmental variable selected in the final model
showing a higher probability of catching an oceanic whitetip                          was nitrate concentration, yet its contribution to the model was
shark in the Kenya-Somali basin, though this probability was                          small. We expected to find increasing probabilities of capturing
lower in the years 2015, 2019 and 2020 relative to the other                          oceanic whitetip shark with increasing concentrations of nitrate,
years (Figure 8B).                                                                    as nitrate increases phytoplankton growth (Dugdale, 1967),
                                                                                      which is indicative of high primary production, and therefore,
                                                                                      it may be associated with areas known to attract pelagic species
DISCUSSION                                                                            for feeding (Young et al., 2015; Williamson et al., 2019). Instead,
                                                                                      we found higher probabilities of catching oceanic whitetip shark
Modeling and predicting the distribution of oceanic species is                        in areas with low values of nitrate (close to zero) and
challenging due to the difficulties in obtaining extensive spatial                     intermediate values of nitrate. It may be that there is a spatial
and temporal sampling coverage of oceanic environments. The                           and temporal lag between the coastal upwelling of colder and
approach taken in the current study is a practical and cost-                          nutrients-rich waters and the occurrence of oceanic whitetip
effective approach to glean important aspects of the distribution                     sharks, as it has been observed in other pelagic species (Barlow
of species for which data are scant, but which require                                et al., 2021). In addition, low concentrations of nitrate can be an
management because of their vulnerability to fishing. While in                         indicative of oligotrophic waters where distribution of
this research we identified the main factors analyzed in this study                    zooplankton and schools of foraging preys are more patchy
driving the probability of catching a juvenile oceanic whitetip                       (Priyadarshi et al., 2019). We suggest that oceanic whitetip
shark in the western Indian Ocean, the results should be                              shark could be associated with low-nitrogen oligotrophic
interpreted with caution. Our species distribution model                              waters as it might facilitate, as a visual predator, its foraging
explained a small proportion of total deviance (9%). However,                         behavior on patchy prey distributions (Collin, 2018). This is

Frontiers in Marine Science | www.frontiersin.org                                 9                                       June 2022 | Volume 9 | Article 863602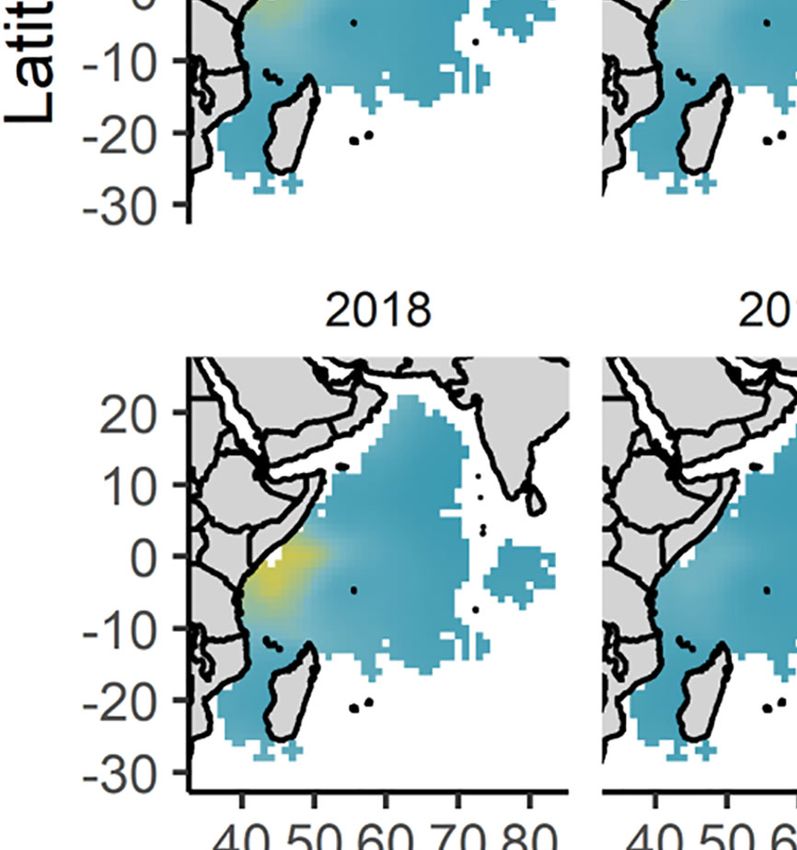
Lopetegui-Eguren et al.                                                                                            Spatio-Temporal Distribution of Oceanic Whitetip Shark

     A                                                                                       B

     C                                                                                       D

 FIGURE 4 | Partial effects of four predictor variables in the final model for predicting the catch probability of an oceanic whitetip shark. (A) Sea surface temperature
 (SST) (°C), (B) nitrate (mmol.m-3), (C) target tuna catch (tons) and (D) week. Effect size for each variable is expressed in probability units (0-1) and indicates the
 individual contribution of each variable to total catch probability. Shaded polygons indicate approximate 95% confidence intervals for smooth terms, and the black
 vertical lines in the x-axis the distribution of the data.

    A                                                                                    B

 FIGURE 5 | Partial effects of two categorial predictor variables in the final model for predicting the catch probability of an oceanic whitetip shark. (A) Year, and
 (B) Set type (FAD or FSC). The dashed lines indicate the 95% confidence interval for the parametric terms, and black boxes in the x-axis the distribution of the data.

Frontiers in Marine Science | www.frontiersin.org                                   10                                            June 2022 | Volume 9 | Article 863602
Lopetegui-Eguren et al. Spatio-Temporal Distribution of Oceanic Whitetip Shark
TABLE 4 | Accuracy indices to evaluate the predictive performance of the areas in the eastern Pacific Ocean where the nitrate
model: Area Under the receiver operating Curve (AUC), Sensitivity, Specificity and
concentrations were around 145.2 mmol.m-3 (Lezama-Ochoa
True Skill Statistic (TSS).
et al., 2019). The oceanic regions in the Indian Ocean are
Iteration AUC Sensitivity Specificity TSS characterized by low concentrations of nitrate, in comparison
to other oceanic regions in the Atlantic and Pacific Oceans
1 0.73 0.79 0.60 0.39
2 0.73 0.67 0.71 0.38
(Pennington et al., 2006). These low concentrations might also
3 0.71 0.53 0.80 0.33 confound the interpretation of the effect of nitrate in the oceanic
4 0.70 0.65 0.67 0.33 whitetip shark catch probability.
5 0.73 0.76 0.60 0.36 We also found higher probabilities of juvenile oceanic
Mean 0.72 0.68 0.68 0.36
whitetip shark catch when sets were made under FADs
compared to FSC of tunas. This is consistent with the
supported by other studies with higher catches of other visual association behavior and attraction of juvenile oceanic whitetip
predators, such as tunas, along the offshore side of an upwelling sharks to FADs (Filmalter et al., 2013). The affinity of pelagic
frontal boundary, which is characterized with high frontal species with FADs is not fully understood but a widely accepted
occurrence supporting schools of forage fish, yet clear, low theory relies on their social behavior (Jacoby et al., 2012) and
nutrient and low-chlorophyll waters facilitating foraging for suggests that FADs may act as a “meeting point” (Dagorn and
visual predators (Hahlbeck et al., 2017). Its association with Fré on, 1999). While it has been hypothesized that FADs may be
low-nitrogen oligotrophic waters could also be a behavioral acting as an “ecological trap” for pelagic species aggregating
mechanism to avoid competition and predator avoidance underneath them impacting their behavior, biology, and
(Lima and Dill, 1990; Brown and Kotler, 2004), yet this migration (Marsac et al., 2000), these factors are little known
explanation for juvenile oceanic whitetip sharks needs to be for oceanic whitetip shark and other sharks. Furthermore, the
further examined. Moreover, the range of nitrate values found in majority of the observed sets in our study were made in FADs,
our study area (0-3.8 mmol.m-3) was very low compared to other and our models did not account for fishing effort and FAD
research studies modeling other migratory species, such as the densities. We recommend future studies to explore the effect of
spinetail devil ray (Mobula mobular) distribution in upwelling the densities, drift and distribution of FADs on the spatial
FIGURE 6 | Spatial distribution of the mean and standard deviation (Sd) predicted catch probability of an oceanic whitetip shark over 2010-2020 and across the
fishing grounds of the tropical tuna purse seine fishery in the western Indian Ocean. For predictions the FAD fishing technique was used as baseline.
Frontiers in Marine Science | www.frontiersin.org 11 June 2022 | Volume 9 | Article 863602Lopetegui-Eguren et al. Spatio-Temporal Distribution of Oceanic Whitetip Shark FIGURE 7 | Spatial distribution of the mean predicted catch probability of an oceanic whitetip shark by monsoon regimes and across the fishing grounds of the tropical tuna purse seine fishery in the western Indian Ocean. Winter monsoon (December-March), spring intermonsoon (April and May), summer monsoon (June- September) and autumn intermonsoon (October and November) in the western Indian Ocean. For predictions the FAD fishing technique was used as baseline. Frontiers in Marine Science | www.frontiersin.org 12 June 2022 | Volume 9 | Article 863602
Lopetegui-Eguren et al.                                                                            Spatio-Temporal Distribution of Oceanic Whitetip Shark

distribution and behavior of oceanic whitetip shark and other               Marsac, 2017). We observed the catch probability of this species
pelagic species with aggregation behaviors to FADs.                         decreased slightly in the Kenya-Somali basin in the years 2015,
    Higher catch probabilities were also predicted at the                   2019 and 2020 driven by higher sea surface temperature values
beginning of the study period (year 2010 and 2011), followed                observed during these years explained by marine heatwaves
by a decrease in 2012 and stabilization for the rest of the study           associated to Indian Ocean basin wide warming and positive
period. While this temporal trend in the year effect may suggest a          Indian Ocean Dipole events (Zhang et al., 2018; Holbrook et al.,
population decline in oceanic whitetip shark and then a                     2019; Saranya et al., 2021; Shi and Wang, 2021). This ocean-
stabilization of this species in the study area, we need to                 atmosphere phenomenon resulted in a higher sea surface
interpret this result with caution as the number of observed                temperature in the western side of the Indian Ocean as well as a
sets in the first two years (2010 and 2011) were considerably                less intense Somali upwelling with a reduction in the nitrate
lower resulting in high uncertainty in these early years. However,          concentrations and the primary production in the western
this explanation cannot be completely ruled out as over the last            Indian Ocean (Yang et al., 2020). The frequency, duration and
decades large declines in the abundance of oceanic whitetip shark           intensity of heatwaves are also increasingly affecting the
have been reported throughout its global range (Rigby et al.,               distribution of coastal and oceanic pelagic species leading to
2019; Tremblay-Boyer et al., 2019; Pacoureau et al., 2021),                 shifts in their distributions (Lonhart et al., 2019; Cheung and
including the Indian Ocean (IOTC, 2015; Young and Carlson,                  Frölicher, 2020). Furthermore, as studied in other shark species,
2020). Population declines in oceanic whitetip shark are believed           projected increases in sea surface temperature induced by climate
to have been primarily driven by the increasing susceptibility of           change could also redistribute and shift oceanic whitetip
this species to different fishing gears (primarily longline and              distributions to more southern waters in the Indian Ocean
gillnets, followed by purse seine fisheries) in the Indian Ocean             (Sequeira et al., 2014; Lezama-Ochoa et al., 2016) or drive them
(Garcia and Herrera, 2019), together with its sensitive life history        to deeper waters (Dulvy et al., 2008; Tolotti et al., 2017;
traits (low fecundity, slow-moderate growth rate, and late sexual           Andrzejaczek et al., 2018) with unknown consequences to their
maturity), making this shark species to be highly vulnerable to             populations. Climate-driven changes on shark distributions and
overfishing (Young and Carlson, 2020).                                       the timing of their migrations can also impact their risks to
    The model predicted a higher catch probability of an oceanic            fisheries by decreasing their spatial protection, as it has been
whitetip shark offshore Kenya-Somalia coast during summer                   observed in the apex predator tiger shark (Galeocerdo cuvier) in
monsoon suggesting this may be an important area for this                   the northwest Atlantic Ocean (Hammerschlag et al., 2022).
species. Considering that most of the catches of oceanic whitetip           Considering the sea surface temperature effect on the
shark through all the study area were juveniles, we suggest that            distribution of the oceanic whitetip shark and that climate
this upwelling area may be used as a feeding ground by the young            change is increasing the positive Indian Ocean Dipole events
individuals of this species. In line with our results, previous             and thus marine heatwaves (Cai et al., 2009; Frölicher et al.,
studies on the distribution and mortality of shark species caught           2018; Oliver et al., 2019), understanding the effect of multiple
as bycatch also found catches of juvenile oceanic whitetip shark            climate change scenarios in combination with its interactions with
to be localized near the Somalian coast (Clavareau et al., 2020).           multiple fisheries in the Indian Ocean is necessary to ensure that
Other studies also found this area to be highly suitable for pelagic        this globally Critically Endangered species is recovered to
species such as silky sharks (Lezama-Ochoa et al., 2016) and                sustainable levels.
adult individuals of blue sharks (Coelho et al., 2018). The                     It is important to emphasize that the species distribution model
seasonality of the higher catch probabilities in this important             for juvenile oceanic whitetip shark derived in the present study is
area appears to be associated to the upwelling seasonality                  based on data collected by only the EU and associated flags tropical
in Kenya-Somali basin (Schott and McCreary, 2001). We                       tuna purse seine fishery, which mostly captures juveniles and
found that the highest catch probabilities occurred during the              operates in the western part of the Indian Ocean. This obviously
summer monsoon regime when the upwelling decreases sea                      limits the applicability of our model and interpretations to the
surface temperature and increases biological productivity                   region of the Indian Ocean where the fishery operates, to the years
(Supplementary Animations 1, 2), thus attracting schools of                 where the fishery collected observer data, and to the limited size
prey fishes to top predators (Young et al., 2015). In line with this,        range of oceanic whitetip sharks that are susceptible to capture by
other studies have also suggested this area to be a feeding area for        the fishery. Future modeling efforts could improve on our efforts by
migratory pelagic species such as skipjack tuna (Druon et al.,              collecting and analyzing datasets from multiple fisheries including
2017), and blue whale (Balaenoptera musculus) (Charles et al.,              longline and gillnet fisheries that are also known to interact with this
2012) during the summer monsoon.                                            species throughout the Indian Ocean (Garcia and Herrera, 2019).
    Interannual predictions in response to only environmental               Not only will this approach increase the spatial coverage of the
changes in sea surface temperature and nitrate concentrations               model to the entire Indian Ocean but also provide greater coverage
showed high consistency in the higher catch probabilities of this           of the population’s length distribution as longline gear tends to
species in the Kenya-Somali basin, yet with some interannual                capture larger individuals than purse seine. This will ultimately
variation in this area. Interannual climatic processes are well             improve the predictive abilities of the model, as well as its validation,
known to affect the spatio-temporal distributions of pelagic                and provide an improved representation of the overall distribution
migratory fish species (Bacha et al., 2017; Kai et al., 2017;                of this species.

Frontiers in Marine Science | www.frontiersin.org                      13                                        June 2022 | Volume 9 | Article 863602
You can also read