A Capillary Model for Predicting Saturated Hydraulic Conductivity of Ion-Adsorption Rare Earth Ore Based on Improved Kozeny-Carman Equation
←
→
Page content transcription
If your browser does not render page correctly, please read the page content below
Hindawi
Geofluids
Volume 2022, Article ID 2947220, 10 pages
https://doi.org/10.1155/2022/2947220

Research Article
A Capillary Model for Predicting Saturated Hydraulic
Conductivity of Ion-Adsorption Rare Earth Ore Based on
Improved Kozeny–Carman Equation

 Liang Shi ,1,2 Yun-zhang Rao ,1 Dan Wang ,1 Mei-dao Zhang,1 and Tao Huang1
 1
 School of Resources and Environmental Engineering, Jiangxi University of Science and Technology, Ganzhou 341000, China
 2
 School of Resources and Architectural Engineering, Gannan University of Science and Technology, Ganzhou 341000, China

 Correspondence should be addressed to Yun-zhang Rao; raoyunzhang@jxust.edu.cn

 Received 4 December 2021; Accepted 13 January 2022; Published 18 February 2022

 Academic Editor: Yanan Gao

 Copyright © 2022 Liang Shi et al. This is an open access article distributed under the Creative Commons Attribution License,
 which permits unrestricted use, distribution, and reproduction in any medium, provided the original work is properly cited.
 During the in-situ leaching process of ion-adsorption rare earth ore, the seepage velocity of the leaching solution is one of the core
 problems in studying the leaching efficiency. The determination of the saturated hydraulic conductivity is of great significance to
 reveal the leaching process. The classical Kozeny–Carman (KC) equation is widely employed to predict the hydraulic conductivity
 of sandy soils. However, in the equation, the effect of tortuosity on the hydraulic conductivity is not considered, and the specific
 surface area is difficult to determine in practice. In this study, the capillary model for predicting the saturated hydraulic
 conductivity of ion-adsorption rare earth ore was established. First, we assumed that all the pores in the ore body are a series of
 parallel and tortuous capillaries with equal diameters. Based on the assumption and Hagen–Poiseuille’s law, the KC equation was
 improved by introducing the tortuosity. Second, the constant head permeability tests were carried out to derive the seepage
 velocity and hydraulic head loss under the steady seepage state. According to the experimental results, the diameter of the capillary
 was calculated with Darcy’s formula. Then we obtained a linear-fit relationship between capillary diameter and porosity to express
 the specific surface area variation with porosity. Third, by validating with experimental data, when the pore shape coefficient is 0.4,
 the saturated hydraulic conductivity calculated by the capillary model is in good agreement with the tested value. The proposed
 model can be considered to have a satisfactory capability to predict the saturated hydraulic conductivity of ion-adsorption rare
 earth ore.

1. Introduction Consequently, a reliable saturated hydraulic conductivity is
 required to control the seepage velocity of the leaching
Saturated hydraulic conductivity represents the ability of solution.
ion-adsorption rare earth ore to conduct water under sat- Theoretically, saturated hydraulic conductivity is related
urated conditions [1], and plays a key role in calculating to the characteristics of fluid and ore body [10]. The ion-
seepage velocity [2, 3]. The seepage velocity of the leaching adsorption rare earth ore, under the role of chemistry,
solution directly influences the leaching performance of ion- weathering and sedimentation, exists in the form of granite
adsorption rare earth ore [4]. Large seepage velocity not only or volcanic rocks rich in rare earth elements [11]. Within the
leads to preferential flows and leaching blind areas in the ore ore body, there are clay particles of different sizes with a
body [5, 6] but also to supersaturation of the ore body negative charge on their surface. Additionally, because of the
causing a landslide [7, 8], which will seriously endanger the lamellar structure of most particles, it is easier to form
environment, life, and property. On the contrary, the tortuous pore structures in the ore body [12, 13]. It has been
seepage velocity is too slow, resulting in a long mining well documented that saturated hydraulic conductivity de-
period, increasing time costs, and seriously affecting the pends on the feature parameters of particle and pore geo-
leaching efficiency of ion-adsorption rare earth ore [9]. metric structure of orebody, including porosity,
2 Geofluids

tortuousness of capillary, particle shape, and pore size according to Hagen–Poiseuille’s law. The relationship be-
distribution [14–17]. tween specific surface area and porosity is fitted through the
 Generally, the researchers obtain the saturated hydraulic constant head permeability test. Due to the improved KC
conductivity of ion-adsorption rare earth ore by field or equation and relationship, a novel model for calculating the
laboratory tests [18]. In real-life, it is labor-intensive, time- saturated hydraulic conductivity of ion-adsorption rare
consuming, and costly in field tests, and the test data ob- earth ore is proposed. The new model, validated with the
tained is limited [19]. For laboratory tests, the ore samples experimental data, can provide theoretical references for the
tested are disturbed by human activities, leading to the in-situ leaching process of ion-adsorption rare earth ore.
unrepresentative results of the true condition of the orebody
[20]. Therefore, previous studies attempted to estimate the 2. Improvement of KC Equation
saturated hydraulic conductivity with some easily available
parameters of the orebody [21]. Due to the diversity and In porous media, groundwater permeates as laminar flow
complexity of the factors influencing hydraulic conductivity along curved pore channels [36], as shown in Figure 1. To
[22], it is difficult to establish an accurate theoretical model facilitate studying, some investigators considered the flow
concerning hydraulic conductivity. Numerous scholars channels as capillaries [24, 38]. Based on this concept, some
studied the empirical or semiempirical models for hydraulic fundamental assumptions are as follows:
conductivity predictions [23]. Nevertheless, the applicability
of these empirical models to other soils needs to be further (1) The pores in the ion-adsorption rare earth ore body
evaluated [24]. are a series of parallel and tortuous capillaries with
 In 1927, Kozeny [25] proposed a model by taking the equal diameters.
channels of water flowing as uniform tubes, and the model (2) To fluids, all the pores in the ore body are involved in
was further developed by Carman [26] in 1937 the flow process.
 (3) In capillaries, all flowing fluids along streamlines are
 cw 1 n3 in laminar flow.
 Ksat � Cs , (1)
 μ S20 (1 − n)2
 The profile of the actual seepage channels of porous
where Ksat is the saturated hydraulic conductivity (cm/s), Cs media is shown in Figure 1(a). The tortuous lines with ar-
is the pore shape coefficient (dimensionless), cw is the unit rows in the figure are the streamlines, according to as-
mass of water (N/cm3), μ is the dynamic viscosity (Pa∙s), S0 sumption (1), the seepage channels consist of numerous
is the specific surface area (cm2/cm3), and n is the porosity capillaries. Taking a capillary as an object, the profile of a
(%). In recent years, the KC equation has been inspected by capillary in the ore body is given in Figure 1(b). To quan-
many investigators [27]. Lambe and Whitman [28] indicated titatively analyze the capillary geometric relationship, the
that the KC equation can be used to predict the hydraulic capillary profile was plotted based on the microelement
conductivity of sandy soils, but not clay. Ren et al. [29, 30] concept, as shown in Figure 1(c).
gave a theoretical explanation for the failed application of the The in-situ leaching process is described as that the
KC equation in clay and derived a new model by introducing leaching solution flows in these capillaries. To ensure the
an effective void ratio, which better predicted the hydraulic same permeation conditions of the leaching solution in both
conductivity of various soils ranging from coarse-grained to the capillaries and the pores of the orebody, the two con-
fine-grained. Fang et al. [31] and Wang et al. [32] proposed ditions must be met
the concept of effective specific surface area and improved (1) The total volume of capillaries is equal to the total
the accuracy of KC equation in clay. In general, the specific volume of pores in the orebody.
surface area can be obtained with some methods including
 (2) The total surface area of capillaries is equal to the
gas adsorption, ethylene glycol monoethyl ether, and
 total surface area of the ore particles.
methylene blue absorption techniques [33–35]. Unfortu-
nately, the methods require specialized equipment, resulting It can be expressed as
in difficult to directly obtain the specific surface area, which
limits the application of KC equation greatly. Due to the π
 Vv � Vc � aVc1 � a d2c lc , (2)
complex pore morphology in ion-adsorption rare earth ore 4
body, the seepage channels are not straight lines [36],
resulting in a tortuous flow of the leaching solution in the ore As � Acs � aAcs1 � aπdc lc , (3)
body, which can be expressed by the tortuosity. However, the
tortuosity is not taken into consideration in the KC equa- where Vv is the volume of pores in the orebody (cm3), Vc is
tion, while the tortuosity is closely related to the hydraulic the total volume of capillaries (cm3), Vc1 is the volume of a
conductivity [37]. capillary (cm3), As is the surface area of orebody particles
 Currently, there are few reports on the application of the (cm2), Acs is the total surface area of capillaries (cm2), Acs1 is
KC equation in the permeation of ion-adsorption rare earth the surface area of a capillary (cm2), a is a constant that
ore, and the accuracy of the original KC equation has yet to means the number of capillaries in the orebody, dc is the
be verified. Based on the above statement, tortuosity is in- diameter of the capillary (cm), and lc is the length of the
troduced in this paper to improve the KC equation capillary (cm).
Geofluids 3

 Soil particles

 A∞
 1
 y
 dy dl

 Ax1
 A1
 Streamlines
 (a) (b) (c)
 Figure 1: Profile of seepage section. (a) Actual seepage. (b) Hypothetical seepage. (c) Microelement section.

 According to Hagen–Poiseuille’s law [39], the flow rate where Ax1 is the projected area of Acc1 in the horizontal
through the cross-sections with any geometrical shape is direction (cm2), A is the cross-sectional area of the orebody
given by (cm2).
 According to the definition of hydraulic gradient ic1:
 cw R2H1
 Q1 � Cs i A , (4) dh 1 dh
 μ c1 cc1 ic1 � � . (10)
 dl τ dy
where ic1 is the hydraulic gradient along the streamline in a
capillary (dimensionless), Acc1 is the cross-sectional area of a Substituting equations (6), (9), and (10) into equation (4)
capillary (cm2), and RH1 is the hydraulic radius (cm). On a gives
section, RH1 is defined as the ratio of the cross-section area cw 1 n3 dh A
that is available for flow Af1 to the wetted perimeter Pw1 , and Q1 � Cs . (11)
can be expressed as follows: μ S20 τ 2 (1 − n)2 dy a

 Af1 The total flow rate through the ore body is given by
 RH1 � . (5)
 Pw1 i�a
 cw 1 n3 dh
 Q � Qi � aQ1 � Cs A. (12)
 In saturated orebody, Af1 can be considered as the i�1
 μ S0 τ (1 − n)2 dy
 2 2

capillary cross-sectional area Acc1, then the hydraulic radius
RH1 can be further simplified as According to Darcy’s law,
 Af1 Acc1 lc aVc1 Vv V /V n dh
RH1 � � � � � v s � . Q � Ksat A. (13)
 Pw1 Pw1 lc aAcs1 Acs As /Vs S0 (1 − n) dy
 (6) Comparing equations (12) and (13) gives
 According to the definition of tortuosity τ cw 1 n3
 Ksat � Cs . (14)
 dl μ S20 τ 2 (1 − n)2
 τ� , (7)
 dy
where τ is the tortuosity (dimensionless), Yu and Li [37] 3. Methodology
assumed that particles in porous media were rectangles with
equal size, considered the two possible configurations for 3.1. Materials. The ore samples were obtained from an ion-
flow through porous media of two-dimensional square adsorption rare earth mine located in Longnan County,
particles, i.e., some particles are overlapped and the others Jiangxi Province, China. The particle size distribution curve
are not, and established a geometric model for tortuosity of of the ore sample was detected using the high frequency
the flow path in porous media as follows: vibrating screen (GZS-1, Nanjing Ningxi Soil Instrument
 ���������������� Company, CHN), as shown in Figure 2. When the mass of
 √����� 2
 ⎢
 ⎡
 ⎢ √����� 0.5 1 − n ⎤⎥⎥ ore body particles larger than 2 mm is less than 50% of the
 τ � 0.5⎢⎢
 ⎢
 ⎣1 + 0.5 1 − n + 1 + 1 − √����
 ⎢ � ⎥⎥⎥⎥⎦. (8) total mass, and the mass of ore body particles larger than
 1− n
 0.075 mm is more than 50% of the total mass, indicating that
 the ion-adsorption rare earth is classified as sandy soil [40].
 As shown in Figure 1(c), the geometric relationship of Furthermore, some physical properties of the ore sample,
the capillary gives such as density, moisture content, porosity, liquid limit and
 Ax1 nA plastic limit were obtained according to the standard (GB/T
 Acc1 � � , (9) 50123, 2019) [41]. The rare earth partition of the ore sample
 τ aτ
 was determined by ICP-OES (Ultima 2, Horiba Company,
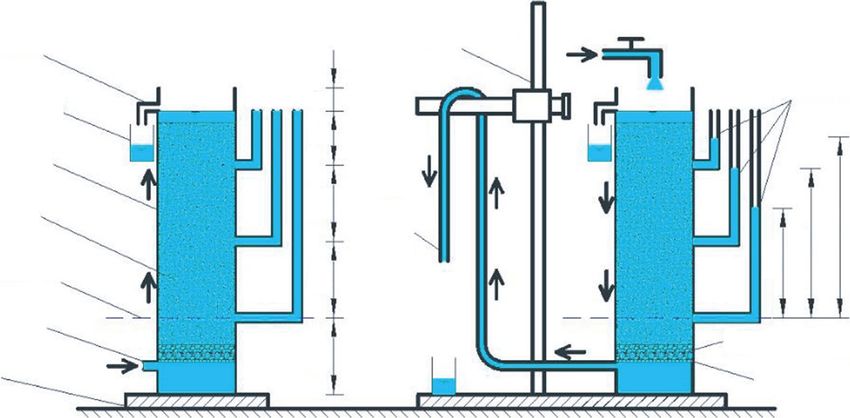
4 Geofluids

 120 30 Table 1: Partition and physical properties of ion-adsorption rare
 earth ore.
 Incremental percentage passing (%)

 Cumulative percentage passing (%)
 100 25 Partition (%) Physical properties
 CeO2 2.41 Specific gravity 2.71
 80 20 Dy2O3 7.94 Density (g/cm3) 1.67
 Er2O3 4.42 Natural moisture content (%) 16.21
 60 15 Eu2O3 0.11 Air-dried moisture content (%) 3.91
 Gd2O3 7.48 Porosity (%) 49.19
 40 10 Ho2O3 1.49 Liquid limit (%) 39.56
 La2O3 7.97 Plastic limit (%) 30.27
 Lu2O3 0.65 D10 (mm) 0.075
 20 5
 Nd2O3 12.47 D30 (mm) 0.506
 Pr6O11 2.83 D50 (mm) 1.207
 0 0 Sm2O3 5.94 D60 (mm) 1.717
 0.01 0.1 1 10
 Tb4O7 1.23 Cu 22.759
 Particle size (mm)
 Tm2O3 0.69 Cc 1.977
 Incremental Y2O3 39.76
 Cumulative Yb2O3 4.61
Figure 2: Particle size distribution of the ion-adsorption rare earth Notes: D10, D30, D50, and D60 are the particle sizes which is less than 10%,
ore. 30%, 50%, and 60% of the total soil mass on the particle size distribution
 curve, correspondingly, Cu is the coefficient of uniformity (D60/D10), and Cc
 is the coefficient of curvature ((D30)2/(D10 × D60)).
FRA), and the result was given in Table 1. The mineral
composition of the ore sample was analyzed by XRD
 2000
(SMART APEX II, Bruker Company, DEU), as shown in 1
 1800 1-Quartz
Figure 3. 2-Kaolinite
 1600 3-Halloysite
 4-Feldspar
 1400 1
 Intensity (Counts)

3.2. Permeation Apparatus. To investigate the permeation 3
characteristics of ion-adsorption rare earth ore, we con- 1200 4
 2
ducted the constant head permeability test with per- 1000
meameter (TST-70, Beijing Luda Xingye company, CHN), 2 2
 800
and the schematic was presented in Figure 4. The per- 2
 600 1 2 4 3
meameter consists of a water supply system and test system. 2 1 1 4
A peristaltic pump continuously supplies water at a constant 400 2 1
rate, and the test system is a metal cylinder with an open-top 200
end, 40 cm in height and 10 cm in internal diameter. Above
 10 20 30 40 50 60 70 80
the top of the metal cylinder, an overflow hole is equipped to
 2θ(°)
maintain a certain hydraulic head, and on the bottom, a
porous plate is set above the outflow hole. Three piezometers Figure 3: Mineral composition of ion-adsorption rare earth ore.
with an internal diameter of 0.6 cm are installed in the
vertical direction of the metal cylinder sidewall. The hy- where m is the mass of ore sample (g), ds is the specific
draulic head in the piezometer can be read by the scale board gravity of ore sample (dimensionless), ρw is the density of
on the metal cylinder, and the elevation baseline is located at water at 4°C (g/cm3), w is the moisture content of ore sample
the No. III piezometer. During the permeation test stage, a (%), and e is the porosity ratio of ore sample (dimensionless).
rubber hose fixed on the sliding supports is connected with
 In the constant head permeability test, water is the fluid
the outflow hole. Under the rubber hose is a measuring glass
 medium. According to the direction of water injection, the
for the collection of the permeated water.
 test undergoes two stages: layered saturation stage and
 permeation test stage.
3.3. Experimental Design. It is reported that pore structure
has a great effect on the hydraulic conductivity of porous 3.3.1. Layered Saturation Stage. The water supply pipe was
media [42, 43]. In this paper, the porosity ratio is taken as the connected with the outflow hole to inject water from the
test control variable. According to the standard (GB/T bottom of the metal cylinder. When the liquid level in the
50123, 2019) [41], seven groups of samples were prepared metal cylinder reached the porous plate, laid a layer of sand
and natural air-dried. The mass of the ore sample is cal- about 2 cm thick as a buffer layer to prevent the loss of fine
culated with the formula (15), the result is listed in Table 2. particles, and measuring the height hs1 from the surface of
 ds ρw (1 + w)V the sand to the opening of the metal cylinder. The m1 ore
 m� , (15) sample was loaded into the metal cylinder in layers, each
 1+e
 layer was controlled at a height of 2∼3 cm, and stamped
Geofluids 5

 Sliding bracket
 Overflow hole
 Q
 Piezometer
 Measuring glass I II III 3 I II III
 7
 Metal cylinder
 10
 Ore sample Rubber h1
 hose h2
 h3
 Elevation baseline 10

 Outflow hole
 Sand buffer layer
 Q 10
 Pedestal Porous plate

 (a) (b)
 Figure 4: Schematic of permeameter (cm). (a) Layered saturation stage. (b) Permeation test stage.

 Table 2: Ratio and characteristic parameters of samples.
Sample no. Porosity ratio Porosity (%) Height of ore sample (cm) Volume of ore sample (cm3) Mass of ore sample (g)
1 0.8 44.4 26 2041 3192.99
2 0.9 47.4 26 2041 3024.93
3 1.0 50.0 26 2041 2873.69
4 1.1 52.4 26 2041 2736.85
5 1.2 54.5 26 2041 2612.44
6 1.3 56.5 26 2041 2498.86
7 1.4 58.3 26 2041 2394.74

evenly. When the surface of the ore sample was completely water began to flow in the ore sample and tended to be
wet, the next layer of the ore sample was loaded. When the stable, then the hydraulic head height and seepage ve-
height of the sample exceeded 3 to 4 cm above the pie- locity were recorded under the stable state. By calcu-
zometer opening No. I, the sample loading was terminated. lating, hydraulic head loss and seepage velocity as a
The height hs2 from the surface of the sample to the top of the function of porosity were plotted in Figures 5 and 6,
metal cylinder was measured. The remaining sample mass respectively.
m2 was weighed to obtain the mass of the filled sample Darcy’s formula was applied to calculate the hydraulic
m � m1 − m2, and the height of the ore sample hs � hs1 − hs2. head loss of water flowing in a uniform circular tube
At last, the hydraulic head height of three piezometers was
observed and recorded until their height reached 270 mm. lc u2
 hf � λ , (16)
 dc 2g

3.3.2. Permeation Test Stage. The water supply pipe was where hf is the hydraulic head loss (cm), λ is the coefficient of
fixed on the top of the metal cylinder so that the water flows frictional drag (dimensionless), and u is the seepage velocity
from top to bottom. A rubber hose was connected with the of the fluid in the capillary (cm/s).
outflow hole and fixed on the sliding bracket. The outlet According to the definition of Reynolds number Re, it
height of the rubber hose was adjusted at 1/3, 1/2, and 2/3 of can be expressed as
the height of the ore sample by the sliding bracket, re- ρw udc ρw vdc
spectively, which produced three kinds of hydraulic head Re � � , (17)
 μ μn
differences Δh in the ore sample. Under a stable seepage
state, the seepage velocity was measured with a stopwatch where v is the average seepage velocity of fluid over the
and a measuring cylinder. In the meantime, the hydraulic cross-section (cm/s).
head height of the three piezometers was recorded. Then, the In the laminar flow state, Jing et al. [38] proposed that
water temperature at the inlet and outlet was measured with the relationship between λ and Re can be expressed as
a thermometer. 163.2
 λ� . (18)
 Re
4. Results and Discussion
 Combining equations (16), (17), and (18) gives
4.1. Specific Surface Area and Porosity �������
 81.6μvlc
 dc � . (19)
4.1.1. Relationship between Diameter of Capillary and ncw hf
Porosity. Resulting from the hydraulic head difference Δh,
6 Geofluids

 11 capillary dc can be obtained. Linear regression analysis was
 10
 used to solve for parameters dc and n.
 Figure 7 illustrates that there is a significant linear
 Hydraulic head loss (cm)

 9 correlation between the diameter of capillary dc and porosity
 8 n, and the correlation coefficient (R2) is 0.9815, the fitted line
 7
 corresponds to the equation as follows:
 6 dc � 0.0104n − 0.0037. (20)
 5
 4
 4.1.2. Relationship between Specific Surface Area and
 3
 Porosity. According to the definition of specific surface area
 44 46 48 50 52 54 56 58 60 S0
 Porosity (%)
 As As nAs
 ∆h1 S0 � � � , (21)
 ∆h2
 Vs (1 − n)V (1 − n)Vv
 ∆h3
 where V is the volume of the orebody (cm3) and Vs is the
Figure 5: Relationship between hydraulic head loss and porosity. volume of orebody particles (cm3).
 Substituting equations (2) and (3) into equation (21)
 gives the relationship between specific surface area and
 0.0030
 diameter of capillary and porosity as follows:
 0.0025 4n
 S0 � . (22)
 Seepage velocity (cm/s)

 dc (1 − n)
 0.0020
 Substituting equation (20) into equation (22) gives the
 0.0015 relationship between specific surface area and porosity as
 follows:
 0.0010
 4n
 S0 � 2 . (23)
 0.0005 −0.0104n + 0.0141n − 0.0037

 0.0000
 44 46 48 50 52 54 56 58 60
 Porosity (%) 4.2. Model Establishment and Validation. Equation (14) is
 the novel improved KC equation, including tortuosity and
 ∆h1
 specific surface area which can be estimated by equations (8)
 ∆h2
 ∆h3 and (23), respectively. Substituting equations (8) and (23)
 into equation (14), a capillary model for predicting the
 Figure 6: Relationship between seepage velocity and porosity. saturated hydraulic conductivity Ksat of ion-adsorption rare
 earth ore is obtained as follows:
 Substituting the test result of hydraulic head loss hw and
seepage velocity v into equation (19), the diameter of

 2
 c n ⎢
 ⎡
 ⎢ −0.0104n2 + 0.0141n − 0.0037 ⎤⎥⎥⎥
 Ksat � Cs w 2
 ⎢
 ⎢
 ⎣ √ ����
 � ���������������������������
 √ ����� √ ����
 � ⎥⎦ . (24)
 4μ (1 − n) 1 + 0.5 1 − n + 1 +((0.5 1 − n )/(1 − 1 − n ))2

 The model contains only one parameter to be measured, shape coefficient Cs is equal to 0.2, 0.3, 0.4, and 0.5, re-
the porosity, which is easily determined by experiment. spectively. The predicted values were plotted on a log-log
Compared with the KC equation, the capillary model is coordinate system against the tested values, as shown in
greatly simplified and easier to use. Figure 8.
 The pore shape coefficient is an empirical constant with a Figure 8 shows that the pore shape coefficient Cs has an
value ranging from 0.2 to 0.5 [44, 45]. To evaluate the ac- influence on the saturated hydraulic conductivity Ksat. When
curacy of the capillary model, we compared the prediction Cs is 0.4, the predicted result is in accordance with the
result of this model with experimental data, when the pore experimental result.
Geofluids 7

 0.0024 107.20%
 0.012

 Saturated hydraulic conductivity (cm/s)
 0.0022
 dc = 0.0104n – 0.0037
 Diameter of capillary (cm)

 0.010 94.29%
 0.0020 R2 = 0.9815
 0.008 85.64%
 0.0018

 0.0016 0.006 82.79%
 Relative error
 103.02%
 0.0014 0.004
 135.20% 15.82%
 0.0012 4.94%
 0.002 78.87% –3.64%
 0.0010 –9.44%
 –4.83%
 0.000 3.17%
 44 46 48 50 52 54 56 58 60 –27.67%
 Porosity (%) 44 46 48 50 52 54 56 58 60
 Porosity (%)
Figure 7: Relationship between the diameter of capillary and
porosity. Experimental data
 Equation (1)
 Equation (24)
 Figure 9: Capillary model versus original KC equation for Cs is 0.4.
 0.01

 is a larger contact area among the particles, leading to a
 Predicted Ksat (cm/s)

 decrease of the surface area of the seepage channels, which is
 neglected in calculating specific surface area. Finally, the
 saturated hydraulic conductivity by calculating is smaller
 0.001
 compared with the tested value. With an increase of po-
 rosity, the contact mode among orebody particles changes
 from surface contact to point contact and ignoring the
 contact area between particles has little effect on the cal-
 culation result.
 0.0001 To assess the robustness of the proposed capillary model,
 0.0001 0.001 0.01
 the capillary model was compared with the original KC
 Tested Ksat (cm/s)
 equation, Terzaghi’s formula, and Chapuis’s formula, and
 Equation (24), Cs = 0.2 equality the average relative error was calculated with the tested
 Equation (24), Cs = 0.3 y = 3x value, the calculation results are shown in Table 3.
 Equation (24), Cs = 0.4 y = x/3 Table 3 shows that the capillary model has good ro-
 Equation (24), Cs = 0.5
 bustness in predicting the saturated hydraulic conductivity
Figure 8: Predicted versus tested Ksat values for different pore of ion-adsorption rare earth ore. Hence, the capillary model
shape coefficient Cs. has better performance.

4.3. Discussion 4.3.2. Model Error. In this paper, theoretical derivation,
 experimental research, and statistical analysis were used to
4.3.1. Model Evaluation. When Cs is 0.4, to assess the
 study the model for predicting saturated hydraulic con-
predicting capacity of the capillary model compared to the
 ductivity. In the process, some errors were made, and the
original KC equation, the saturation hydraulic conductivity
 specific reasons are mainly as follows:
was calculated using the KC equation (1) and the capillary
model (24), respectively, and the relative error was calcu- (1) Equation (2) is established based on the assumption
lated with the tested value, as shown in Figure 9. that all pores in the ore body are considered effective
 In Figure 9, it is shown that when Cs is 0.4, the saturated pores. However, in practice, there are nonconnected
hydraulic conductivity calculated by the capillary model is pores such as isolated pores, blind pores, and dead-
more consistent with the test result. The maximum relative end pores [31, 32], which are ineffective pores in the
errors of the original KC equation and capillary models are seepage process. The result generated from the as-
135.2% and 27.67%, respectively. sumption has a difference from the tested result.
 The relative error is largest with the porosity of 44.4% Additionally, the pores volumes are equivalent to the
and the calculated value of the capillary model is less than the total capillary volume, in fact, the distribution of the
tested value, as shown in Figure 9. At that time, the contact pores in the ore body is complex, and the cross-
area among particles is not considered and the contact area sectional size and direction of the seepage channels
increases with the porosity decreases. When the porosity is are different. Hence, the assumption of taking
small, the particles are relatively densely arranged and there seepage channels in the ore body as parallel and
8 Geofluids

 Table 3: Calculation results of different equations.
 Tested values Capillary model Original KC equation Terzaghi’s formula [43] Chapuis’s formula [23]
Porosity (%)
 Saturated hydraulic conductivity (×10−4 cm/s)
44.4 5.126 3.708 9.169 0.720 4.351
47.4 7.347 7.579 17.280 0.911 5.499
50.0 13.442 12.793 27.290 1.125 6.765
52.4 21.230 19.226 38.807 1.361 8.144
54.5 27.737 26.727 51.492 1.620 9.632
56.5 33.484 35.136 65.055 1.901 11.226
58.3 38.251 44.301 79.257 2.205 12.922
 Average relative error (%) -3.10 98.15 -91.64 -49.94

 tortuous capillaries with equal diameters may cause tortuosity. A capillary model of saturated hydraulic con-
 an error in the result. ductivity for ion-adsorption rare earth ore is established
 (2) Equation (3) is established based on the assumption through the constant head permeability test. Meanwhile, the
 that the contact area among the ore particles is model is compared with the original KC equation and
 neglected, the surface area of seepage channels is validated with the experimental data. The main conclusions
 equal to the surface area of ore particles. In reality, are as follows:
 the contact among the ore particles reduces the (1) Based on the geometric relationship of the capillary
 surface area of seepage channels, and the error will be and Hagen–Poiseuille’s law, the KC equation is
 more pronounced with the porosity decrease. modified by introducing the tortuosity, and the
 (3) The operation process of the constant head per- equation shows that the saturated hydraulic con-
 meability test inevitably occurs an error, such as the ductivity is inversely proportional to the square of
 uniformity and saturation degree of ore samples. the tortuosity.
 (2) Capillary diameter presents an obvious linear rela-
5. Conclusions tionship with the porosity, and the correlation co-
 efficient is 0.9815. The empirical equation for specific
The saturated hydraulic conductivity of ion-adsorption rare
 surface area and porosity is established by the fitting
earth ore is an essential parameter for the mining efficiency
 linear equation.
of in-situ leaching. Due to the tortuous and complex pore
structure in the orebody, there are challenges in modeling (3) The capillary model for predicting the saturated
the saturated hydraulic conductivity of ion-adsorption rare hydraulic conductivity of ion-adsorption rare earth
earth ore. In this study, the KC equation is developed by ore is as follows:
assuming the seepage channels as capillaries and introducing

 2
 c n ⎢
 ⎡
 ⎢ −0.0104n2 + 0.0141n − 0.0037 ⎤⎥⎥⎥
 Ksat � Cs w ⎢
 2⎢
 ⎣ ���������������������������
 √����� 2 ⎥⎦ . (25)
 4μ (1 − n) 1 + 0.5 1 − �n + 1 +((0.5√����
 √ ���� �
 1 − n )/(1 − 1 − n ))

 When Cs is 0.4, the saturated hydraulic conductivity cal- Acknowledgments
culated by the capillary model gives the best agreement with the
tested value, and the maximum relative error is 27.7%. This research was supported by the National Natural Science
Compared to the original KC equation, Terzaghi’s formula, and Foundation of China (51964014); the Education Department
Chapuis’s formula, the capillary model has higher accuracy. of Jiangxi Province (GJJ209414); and the Jiangxi University
 of Science and Technology Ph.D. cultivation (3105500029).
Data Availability
 References
The data that support the findings of this study are available
from the corresponding author (VS) upon reasonable [1] J. D. Jabro, “Estimation of saturated hydraulic conductivity of
request. soils from particle size distribution and bulk density data,”
 Transactions of the AsAE, vol. 35, no. 2, pp. 557–560, 1992.
 [2] G. Korvin, “Permeability from microscopy: review of a
Conflicts of Interest dream,” Arabian Journal for Science and Engineering, vol. 41,
 no. 6, pp. 2045–2065, 2016.
The authors declare that there are no conflicts of interest [3] X. J. Wang, Y. L. Zhuo, K. Zhao et al., “Experimental mea-
regarding the publication of this paper. surements of the permeability characteristics of rare earth ore
Geofluids 9

 under the hydro-chemical coupling effect,” RSC Advances, [20] F. K. Boadu, “Hydraulic conductivity of soils from grain-size
 vol. 8, Article ID 11652, 2018. distribution: new models,” Journal of Geotechnical and
 [4] T. Li, A. X. Wu, Y. T. Feng et al., “Coupled DEM-LBM Geoenvironmental Engineering, vol. 126, no. 8, pp. 739–746,
 simulation of saturated flow velocity characteristics in column 2000.
 leaching,” Minerals Engineering, vol. 128, pp. 36–44, 2018. [21] B. Dolinar, “Predicting the hydraulic conductivity of saturated
 [5] S. H. Luo, T. Luo, and G. S. Wang, “Effect of heterogeneity of clays using plasticity-value correlations,” Applied Clay Science,
 leaching solution on leaching rate in ionic rare earth ore vol. 45, no. 1-2, pp. 90–94, 2009.
 body,” Soils, vol. 50, no. 2, pp. 421–427, 2018. [22] L. D. O. Trani and B. Indraratna, “The use of particle size
 [6] S. L. Zhang, X. S. Liu, and G. Q. Sun, “Effect of liquid injection distribution by surface area method in predicting the satu-
 intensity on preferential flow and its characteristics by soil rated hydraulic conductivity of graded granular soils,”
 sensors,” Sensors and Materials, vol. 33, no. 6, pp. 1989–1998, Géotechnique, vol. 60, no. 12, pp. 957–962, 2010.
 2021. [23] R. P. Chapuis, “Predicting the saturated hydraulic conduc-
 [7] Y. Z. Rao, Y. S. Zhang, R. Rao et al., “Sensitivity analysis on the tivity of soils: a review,” Bulletin of Engineering Geology and
 influence factors of slope stability for ion-absorbed rare earth the Environment, vol. 71, no. 3, pp. 401–434, 2012.
 ore by in-situ leaching,” Mining Research and Development, [24] Z. X. Zeng, Y. J. Cui, and J. Talandier, “Evaluating the in-
 vol. 35, no. 9, pp. 60–63, 2015. fluence of soil plasticity on hydraulic conductivity based on a
 [8] G. S. Wang, S. H. Luo, S. L. Hu et al., “Seepage process and general capillary model,” Engineering Geology, vol. 278, no. 3-
 slope deformation of barefoot type rare earth mine in - situ 4, Article ID 105826, 2020.
 leaching,” Chinese Rare Earths, vol. 38, no. 3, pp. 35–46, 2017. [25] J. Kozeny, “Uber kapillare leitung des wassers im boden,
 [9] D. F. Liu, Z. Y. Zhang, and R. A. Chi, “Seepage mechanism Sitzungsberichte,” Akademie Wissenschaften Wiener, vol. 136,
 during in-situ leaching process of weathered crust elution- no. 2, pp. 271–306, 1927.
 deposited rare earth ores with magnesium salt,” Physico- [26] P. C. Carman, “Fluid flow through granular beds,” Transac-
 chemical Problems of Mineral Processing, vol. 56, no. 2, tions of the Institution of Chemical Engineers, vol. 15, no. 1,
 pp. 350–362, 2020. pp. 150–166, 1937.
[10] M. Najafzadeh, D. B. Laucelli, and A. Zahiri, “Application of [27] J. J. Ma, “Review of permeability evolution model for frac-
 model tree and evolutionary polynomial regression for tured porous media,” Journal of Rock Mechanics and Geo-
 evaluation of sediment transport in pipes,” KSCE Journal of technical Engineering, vol. 7, no. 3, pp. 351–357, 2015.
 [28] T. W. Lambe and R. V. Whitman, Soil Mechanics, John Wiley
 Civil Engineering, vol. 21, no. 5, pp. 1956–1963, 2017.
 and Sons, New York, NY, USA, 1969.
[11] Y. F. Xiao, X. S. Liu, Z. Y. Feng et al., “Role of minerals
 [29] X. W. Ren, Y. Zhao, Q. L. Deng et al., “A relation of hydraulic
 properties on leaching process of weathered crust elution-
 conductivity-void ratio for soils based on Kozeny-Carman
 deposited rare earth ore,” Journal of Rare Earths, vol. 33, no. 5,
 equation,” Engineering Geology, vol. 213, pp. 89–97, 2016.
 pp. 545–552, 2015.
 [30] X. W. Ren and J. C. Santamarina, “The hydraulic conductivity
[12] S. H. Luo, Q. Q. Huang, G. S. Wang et al., “Permeability
 of sediments: a pore size perspective,” Engineering Geology,
 change rule of ion-adsorption rare-earth in ore leaching
 vol. 233, pp. 48–54, 2018.
 process,” Nonferrous Metals Science and Engineering, vol. 5,
 [31] Y. G. Fang, J. Chen, R. G. Gu et al., “Applicability of clay
 no. 2, pp. 95–99, 2014.
 permeability based on modified Kozeny-Carman equation by
[13] Z. Q. Guo, Y. M. Lai, J. F. Jin et al., “Effect of particle size and
 effective specific surface area,” Rock and Soil Mechanics,
 solution leaching on water retention behavior of ion-absorbed vol. 41, no. 8, pp. 2547–2554, 2020.
 rare earth,” Geofluids, vol. 2020, Article ID 4921807, 13 pages, [32] M. T. Wang, J. J. Wang, G. L. Xu et al., “Improved model for
 2020. predicting the hydraulic conductivity of soils based on the
[14] W. B. Zheng, X. L. Hu, D. D. Tannant et al., “Quantifying the Kozeny-Carman equation,” Hydrology Research, vol. 52, no. 3,
 influence of grain morphology on sand hydraulic conduc- pp. 719–733, 2021.
 tivity: a detailed pore-scale study,” Computers and Geo- [33] J. C. Santamarina, K. A. Klein, Y. H. Wang, and E. Prencke,
 technics, vol. 135, Article ID 104147, 2021. “Specific surface: determination and relevance,” Canadian
[15] R. Kango, V. Shankar, and M. A. Alam, “Evaluation of hy- Geotechnical Journal, vol. 39, no. 1, pp. 233–241, 2002.
 draulic conductivity based on grain size distribution pa- [34] M. Maček, A. Mauko, A. Mladenovič et al., “A comparison
 rameters using power function model,” Water Supply, vol. 19, of methods used to characterize the soil specific surface
 no. 2, pp. 596–602, 2018. area of clays,” Applied Clay Science, vol. 83-84, pp. 144–152,
[16] B. Xiao, W. Wang, X. Zhang et al., “A novel fractal solution for 2013.
 permeability and Kozeny-Carman constant of fibrous porous [35] R. P. Chapuis and M. Aubertin, “On the use of the Koze-
 media made up of solid particles and porous fibers,” Powder ny–Carman equation to predict the hydraulic conductivity of
 Technology, vol. 349, pp. 92–98, 2019. soils,” Canadian Geotechnical Journal, vol. 40, no. 3,
[17] J. D. Teng, J. Y. Kou, S. Zhang et al., “Evaluating the influence pp. 616–628, 2003.
 of specimen preparation on saturated hydraulic conductivity [36] J. C. Wu, Y. Q. Xue, and M. G. Jin, Groundwater Dynamics,
 using nuclear magnetic resonance technology,” Vadose Zone pp. 9–15, China Water & Power press, Beijing, China, 2009.
 Journal, vol. 18, no. 1, pp. 1–7, 2019. [37] B. M. Yu and J. H. Li, “A geometry model for tortuosity of flow
[18] Y.-F. Deng, A.-M. Tang, Y.-J. Cui, and X.-L. Li, “Study on the path in porous media,” Chinese Physics Letters, vol. 21, no. 8,
 hydraulic conductivity of Boom clay,” Canadian Geotechnical pp. 1569–1571, 2004.
 Journal, vol. 48, no. 10, pp. 1461–1470, 2011. [38] Y. H. Jing, T. G. Jin, and J. C. Fan, “Calculation model of head
[19] S. H. Luo, J. Liu, G. S. Wang et al., “Statistical analysis for loss in the filtration process with uniform media,” China
 location arrangment to measure mechanical parameters of ore Water & Wastewater, vol. 16, no. 2, pp. 9–12, 2000.
 body in ion-absorbed rare earth mining,” Journal of Engi- [39] D. W. Taylor, Fundamentals of Soil Mechanics, John Wiley &
 neering Geology, vol. 26, no. 2, pp. 422–430, 2018. Sons, New York, NY, USA, 1948.
10 Geofluids

[40] X. N. Gong, Y. S. Liu, G. X. Li et al., Soil Mechanics, pp. 27-28,
 China Architecture & Building Press, Beijing, China, 2002.
[41] Ministry of Water Resources of People’s Republic of China,
 GB/T 50123-2019 Standard for Geotechnical Testing Method,
 China Planning Press, Beijing, China, 2019.
[42] S. H. Yin, Y. J. Shao, A. X. Wu et al., “The effect of ferrous ions
 on hydraulic conductivity in fine tailings,” Engineering Ge-
 ology, vol. 260, Article ID 105243, 2019.
[43] S. H. Yin, Y. Qi, F. F. Xie et al., “Permeability characteristic of
 weathered crust elution-deposited rare earth ores under
 different pore structures,” Chinese Journal of Nonferrous
 Metals, vol. 28, no. 5, pp. 1043–1049, 2018.
[44] J. B. Walsh and W. F. Brace, “The effect of pressure on porosity
 and the transport properties of rock,” Journal of Geophysical
 Research, vol. 89, no. B11, pp. 9425–9431, 1984.
[45] D. Hansen, “Discussion of “On the use of the Kozeny–Car-
 man equation to predict the hydraulic conductivity of soils”,”
 Canadian Geotechnical Journal, vol. 41, no. 5, pp. 990–993,
 2004.
You can also read