A Real-Time Electricity Price Decision Model for Demand Side Management in Wind Power Heating Mode
←
→
Page content transcription
If your browser does not render page correctly, please read the page content below
ORIGINAL RESEARCH
published: 26 February 2021
doi: 10.3389/fenrg.2021.634603
A Real-Time Electricity Price Decision
Model for Demand Side Management
in Wind Power Heating Mode
Qiang Li 1*, Jian Li 1, Zhengyong Huang 1, Fulin Fan 2 and Weijun Teng 3
1
School of Electrical Engineering, Chongqing University, Chongqing, China, 2Department of Electronic and Electrical Engineering,
University of Strathclyde, Glasgow, United Kingdom, 3State Grid Henan Electric Power Research Institute, Zhengzhou, China
The problem of wind power curtailment (WPC) during winter heating periods in China’s
“Three-North regions” is becoming worse. Wind power heating, though being an effective
way to increase wind power consumptions, is constrained by high electric heating costs
under a peak-to-valley electricity price pattern. This study develops a real-time price (RTP)
decision model which adjusts the time-varying RTPs within an acceptable range of heating
users based on the WPC distribution over a particular dispatch day. The lower RTPs
accompanying the higher WPC can guide the electric heating user side equipped with
regenerative electric boilers (REBs) to actively increase REB imports to absorb additional
wind generation. Then, the demand side response using REBs under the RTP scheme is
Edited by:
Yang Li, optimized to minimize the total heating cost met by electric heating users while assisting in
Northeast Electric Power University, the large-scale wind generation accommodation. The total heating costs and WPC
China
reductions under different heating scenarios are compared and discussed alongside
Reviewed by:
Chen Liang,
the effectiveness of the RTP-based demand side management in terms of reducing the
Nanjing University of Information WPC and heating costs and increasing the feasibility of wind power heating during winter
Science and Technology, China
heating periods.
Shaoyan Li,
North China Electric Power University, Keywords: demand side management, electric heating, real-time electricity price, regenerative electric boiler, wind
China power heating
*Correspondence:
Qiang Li
419737100@qq.com INTRODUCTION
Specialty section: By the end of 2019, the cumulative installed capacity of wind power in China reached 210 GW, and
This article was submitted to the annual national wind generation was about 405.7 TWh (National Energy Administration, 2020).
Smart Grids, Though the total installed capacity ranked first in the world, the severe issue of wind power
a section of the journal curtailment (WPC) restricts China from becoming the largest wind power utilization country. The
Frontiers in Energy Research “Three-North regions” of China having abundant and concentrated wind energy resources are
Received: 28 November 2020 suffering from the most significant WPC, accounting for 98% of the national WPC of 41.9 TWh in
Accepted: 12 January 2021 2017 (National Energy Administration, 2020). This is mainly because the installed capacity of
Published: 26 February 2021 renewable energy in the “Three-North regions” is inversely correlated with the local electricity
Citation: demand. As of the end of 2017, grid-connected wind farms in the “Three-North regions” contributed
Li Q, Li J, Huang Z, Fan F and Teng W to about 74.23% of the national total installed capacity and had a wind power penetration rate as high
(2021) A Real-Time Electricity Price
as 70%, while the local electricity consumption reached 36% of the national volume only.
Decision Model for Demand Side
Management in Wind Power
In particular, the electricity generation mix of the “Three-North regions” is dominated by thermal
Heating Mode. power, most of which is supplied by combined heat and power (CHP) units. In winter heating
Front. Energy Res. 9:634603. periods, the mode of “ordering power by heat” reduces the ability of thermoelectric units to adjust
doi: 10.3389/fenrg.2021.634603 their electrical power outputs, resulting in a more significant WPC phenomenon (Liu, 2013; Lü et al.,
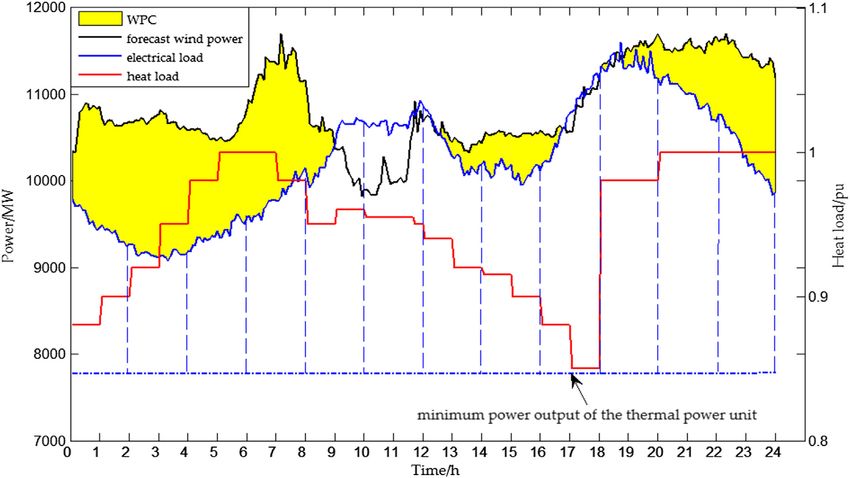
Frontiers in Energy Research | www.frontiersin.org 1 February 2021 | Volume 9 | Article 634603Li et al. Electricity Price Model for DSM 2013; Yao et al., 2018). The CHP units providing 92% of the total especially during peak periods, and in dealing with installed capacity of thermal power in Jilin Province must fluctuations of renewable power outputs (Khodayar and increase their minimum export limits to meet the heat Shahidehpour, 2013; De Jonghe et al., 2014; Sánchez de la demand required during winter heating periods. In addition, Nieta et al., 2014; Shafie-khah et al., 2015). The demand side heat demand peaks generally coinciding with electricity demand self-adjustment is more economical and practical than investing troughs further reduce the feasible region of wind power in the power supply side to meet the peak demand. Therefore, acceptance and compress the space for wind power to access encouraging users to actively switch to the wind power heating the local grids. mode is expected to be a practical and direct way to increase wind Given actual characteristics of the “Three-North regions,” power consumptions during winter heating periods. This can be improving the flexibility of CHP units is expected to realized by reducing real-time electricity prices (RTPs) in significantly benefit for the wind power integration (Li et al., response to WPC signals, which guides the users to actively 2015; Cui et al., 2016; Xie et al., 2016; Li et al., 2018a; Li et al., increase the electric heating demands to consume the 2020). A chance-constrained programming-based scheduling additional wind generation. The introduction of the DSR model was developed in (Li et al., 2020) to deal with the under the RTP scheme not only permits an active demand insufficient flexibility of an integrated energy system with CHP side management (DSM) for the WPC alleviation (Sioshansi units. To address the problem of the CHP economic emission and Short, 2009; Ai et al., 2016; Shin et al., 2017; Schmidt and dispatch, a two-stage approach combining multi-objective Linder, 2020) but can also reduce heating costs of users, optimization with integrated decision-making was proposed in increasing their attractiveness of the electric heating in cost (Li et al., 2018a). With the deployment of electric boiler and compared to the conventional heating. An RTP decision thermal energy storage, a coordinated wind power method has been proposed in (Li et al., 2018b) which accommodating dispatch model was developed in (Cui et al., constructed a bi-level optimal scheduling model to maximize 2016) to improve the operational flexibility of CHP units. In the system profit. addition, heating with wind power, as an effective solution to the Most research related to RTPs only sets a single electricity WPC problem, has been significantly promoted in China in price signal in response to WPC. From the perspective of supply recent years (Comprehensive Department of National Energy and demand in electricity markets, the article develops an RTP Administration, 2015). The principle of the wind power heating decision model to adjust the time-varying RTPs based on the scale mode and its role and prospects in improving the grid’s capability and temporal distribution of WPC in a dispatch day. Then, the of wind power accommodation during off-peak periods were responses of electric heating with REBs under the RTP scheme are investigated in (Wang et al., 2013). optimized to minimize the total electric heating cost while Energy storage systems (ESSs) can convert energy between realizing the large-scale accommodation of wind generation. multiple forms and enable the time shift of a particular energy The daily heating costs and WPC reductions under four form, permitting an effective coordination between power supply particular heating scenarios are evaluated to verify the and demand (Chen et al., 2015; Gifford et al., 2020; Fan et al., effectiveness of the proposed RTP decision model for DSM in 2019). Nowadays, regenerative electric boiler (REB) as one of the terms of reducing the electric heating cost and increasing wind heat storage technologies has been deployed to alleviate the WPC power consumptions. (Xu and Jiang, 2015; Cui et al., 2016). An integrated energy This article is structured as follows: Theoretical Basis of RTP system including wind farms, REBs, and ESS was modeled in (Xu Decision Model for DSM section introduces the theoretical basis and Jiang, 2015) where the WPC was minimized taking into of the RTP decision model for DSM in the wind power heating account the ESS scale and the operating conditions of REBs. The mode; RTP Decision Model Based on WPC Distribution section China’s energy “13th Five-Year Plan” anticipated expanding the describes the RTP adjustment based on WPC distributions; DSR scale of the wind power heating mode and promoting the Model Under RTP Scheme for Wind Power Heating section integration of REBs with electric heating (Energy develops a DSR model using REBs under the RTP scheme; Administration of Jilin Province, 2017). In order to maximize Results and Model Validation section evaluates the wind power consumptions, the import of heat storage is expected performance of the proposed models in reducing the WPC to exactly track the WPC. However, the peak-to-valley pattern of and heating costs; and Conclusion and Future Work section electricity price currently adopted in the “Three-North regions” presents conclusions and recommendations for further work. affects the user’s choices of winter heating methods and thus the extent to which the heat storage can assist in the wind power accommodation. THEORETICAL BASIS OF RTP DECISION The electricity users in a long-standing consumption mode are MODEL FOR DSM reluctant to adjust their consumption behavior to match the load schedule. In order to promote their active participation in the Wind Power Accommodation by Electric load shaping, an attractive price signal needs to be offered as an Heating With Heat Storage incentive (Ketterer, 2014; Shen et al., 2016). Given a reasonable The daily curves of total available wind power outputs and price elasticity of demand, the demand side response (DSR) to electrical and heat demands during a typical high-wind winter short-term variations of electricity prices plays an increasingly heating period of 2015–2016 in a particular province in the important role in balancing short-term supply and demand, “Three-North regions” are shown in Figure 1. The feasible Frontiers in Energy Research | www.frontiersin.org 2 February 2021 | Volume 9 | Article 634603
Li et al.                                                                                                                                        Electricity Price Model for DSM

  FIGURE 1 | Daily profiles of total wind power (MW), electrical load (MW), and heat load (p.u.) in a particular province during a typical high-wind winter heating period
  of 2015–2016.

region of wind power acceptance denoted by the area between                                 Electric Heating Users With Wind Power
blue dashed lines is determined by the rise of the electrical                               Heating
demand above the minimum export limit of the thermal                                        Heating as a kind of livelihood guarantee project requires a high
power unit. The exceedance of available wind power outputs                                  reliability of heat supply. With expanding the scale of the wind
over the feasible region, that is, denoted by the yellow area, must                         power heating mode, the intermittency of wind generation
be curtailed so as to avoid violating the minimum export limit of                           requires the introduction of high-cost conventional generation
the thermal power unit. It can be seen that the large-scale WPC                             to ensure the supply reliability. However, the current low prices of
mostly coincides with electrical demand troughs at night, while                             fossil fuels make the conventional heating method more attractive
there still exists a small amount of WPC in some particular time                            to heat users, which slow-paced the development of the electric
slots in the daytime. The high WPC is mainly caused by the                                  heating. The contradiction between the electric heating demands
mismatch in daily profiles between available wind power outputs                              and the cost of wind power heating has become the focus of
and electrical demands.                                                                     market feasibility studies. To deal with this issue, the study
   It is noted that heat demands and available wind power                                   develops an RTP decision model where the time-varying RTPs
outputs are shown to have similar diurnal trends where heat                                 are adjusted to reflect the scale of predicted WPC during a
demand peaks mostly coincide with high wind power outputs.                                  particular dispatch day and guide electric heating users to
This permits the use of the electric heating with heat storage to                           actively increase their needs to consume the additional wind
meet heat demands while increasing wind power consumptions.                                 generation.
The otherwise curtailed wind power can supply the electric                                      The demand change of a single user has little impact on an
heating demand and/or charge the heat storage during                                        entire system. In order to facilitate the DSM, the study integrates
electrical off-peak periods; then, the stored heat is released to                           the electric heating users within a particular area(s) into a single
the users when needed, which alleviates the constraint of                                   user set where each user is considered to share the same heating
“ordering power by heat” and greatly improves the system                                    behavior. In addition, it is presumed here that the daily WPC will
flexibility.                                                                                 fully meet the heating demand with the operation of REBs.
   REBs are widely used for regenerative electric heating due to
their advantages of long service life (20–25 years), simple
structure, high heating efficiency, intelligent control, and zero                            RTP DECISION MODEL BASED ON WPC
labor cost. There are two main types of REBs, that is, a solid REB                          DISTRIBUTION
and a water REB. The former is studied in this article due to its
small footprint, large heat storage capacity per unit volume, and                           Before a particular dispatch day, wind farms will provide a system
no additional ancillary equipment.                                                          operator (SO) with their day-ahead wind power forecasts. Then,

Frontiers in Energy Research | www.frontiersin.org                                      3                                            February 2021 | Volume 9 | Article 634603
Li et al.                                                                                                                    Electricity Price Model for DSM

                                                                                  depends on Di. Furthermore, Ci should be maintained within a
                                                                                  reasonable range below Cimax ($/kWh):

                                                                                  .                            Ci ≤ Cimax                               (3)

                                                                                     In addition, it must be profitable for a wind farm to inject the
                                                                                  otherwise curtailed wind power onto the grid. This means that Ci
                                                                                  paid by the user set should be greater than the incremental
                                                                                  operating cost cw of the wind farm (i.e., 0.0087 $/kWh in this
                                                                                  study):

                                                                                  .                             Ci > cw                                 (4)

                                                                                     When there is no WPC at a particular time step, the RTP will
                                                                                  not be issued and no transactions will occur at that time step.
  FIGURE 2 | Typical demand curve with quantity D0 and price C0 being
  transacted at the equilibrium point.
                                                                                  DSR MODEL UNDER RTP SCHEME FOR
                                                                                  WIND POWER HEATING
the SO combines available wind power forecasts with the
                                                                                  Given the REB installation providing a user set with a certain
electrical demand forecast curve to predict the hourly WPC in
                                                                                  amount of controllable demand, the user set will actively shape its
the dispatch day, based on which hourly RTPs are determined
                                                                                  demand curve to match available wind power or WPC forecasts
subject to a set of constraints and issued prior to the dispatch day.
                                                                                  so as to exploit the price opportunity under the RTP scheme
The relatively lower RTPs accompanying higher WPC forecasts
                                                                                  described in RTP Decision Model Based on WPC Distribution
can encourage a user set to choose the time of heating supplied by
                                                                                  section. The user set can respond to RTP signals by increasing
the otherwise curtailed wind power and conduct day-ahead
                                                                                  electricity consumptions at times of low RTPs which result from
transactions according to its heat demand.
                                                                                  high WPC forecasts, and vice versa. The DSR using REBs under
   Given day-ahead predictions of available wind power outputs
                                                                                  the RTP scheme not only helps to put additional wind generation
Pwind.f(t) (MW) and electrical demands Pload(t) (MW), the WPC
                                                                                  onto the grid but also reduces heating costs met by users. From
forecast Pqf(t) (MW) at each 1-hour time step t within the
                                                                                  the perspective of the user set, this section will develop a DSR
dispatch day is determined by Eq. 1, avoiding the violation of
                                                                                  model using REBs to minimize the total heating cost by
the minimum export limit Ph.min (MW) of the thermal power
                                                                                  optimizing the heating behavior under the RTP scheme.
unit.

               Pqf (t)  Pwind.f (t) + Ph.min (t) − Pload (t).          (1)       Objective Function
                                                                                  The objective function of the DSR model is the total electric
   From a range of factors such as electricity prices, weather, and               heating cost of a user set in a particular dispatch day:
national economy, electricity prices are the dominant factor                                                           n
affecting electricity consumptions of users. The electricity has                                        minF  min  Ci ΔDi                             (5)
the common attribute of general goods, that is, a contrary                        ,                                   i1
relationship between demand and price, as shown in Figure 2,
                                                                                  where ΔDi (kWh) denotes the WPC reduction consumed by the
where D0 and C0 represent the quantity and the price transacted
                                                                                  REBs at the ith time step. The imports of the REBs supplied by
at an equilibrium point, respectively (the supply curve that
                                                                                  otherwise curtailed wind power at each time step in the dispatch
determines the equilibrium point is not plotted for brevity).
                                                                                  day are determined to minimize the objective function F. It is
   The demand curve in Figure 2 can also describe the negative
                                                                                  noted that the DSR model developed here deals with the
correlation between RTPs and WPC forecasts within a dispatch
                                                                                  optimization of the REB imports only, while the REB exports
day, which is approximated here by Eq. 2.
                                                                                  are not simulated in this work.
                                Ci  Cip × CB
                                                                                  Constraint Condition
                                       1                                          The daily electricity consumption needed for electric heating,
                                 p     Di                               (2)       denoted by Eh (kWh), limits the total volume of WPC that can be
                                Ci  n
                                         1                                        alleviated on a particular dispatch day:

                                     i1 Di
                                                                                                              WShot Th n
where Ci ($/kWh) denotes the RTP at the ith (i  1, . . . , n) time                                    Eh            ≥  ΔDi                           (6)
                                                                                  ,                             η       i1
step where wind farms are forecast to be curtailed by Di (kWh);
CB ($/kWh) is the benchmark value of RTPs equaling the sum of                     where W is the heat load index (W/m2), Shot is the heating area
Ci; and Ci* denotes the per unit RTP relative to CB which inversely               (m2), Th is the daily heating duration (h), and η is the

Frontiers in Energy Research | www.frontiersin.org                            4                                   February 2021 | Volume 9 | Article 634603
Li et al. Electricity Price Model for DSM
FIGURE 3 | Process of the DSR model under the RTP scheme.
electrothermal conversion efficiency. In addition, ΔDi is smaller TABLE 1 | Current peak-to-valley electricity prices for electric heating.
than the WPC volume Di at the ith time step:
Valley section Flat section Peak section
. 0 ≤ ΔDi ≤ Di (7)
Period 21: 00-24: 00 7: 00-7: 30 7: 30-11: 30
From the perspective of the user set, the implementation of 0: 00-7: 00 11: 30-17: 00 17: 00-21: 00
Price ($/kWh) 0.04142 0.07865 0.11588
RTPs should not increase the average electricity price met by the
user set during the day. This is formulated by Eq. 8 as
n
Ci ΔDi RESULTS AND MODEL VALIDATION
0 ≤ i1n ≤ Cav (8)
ΔDi The developed DSR model using REBs under the RTP scheme for
, i1 the wind power heating is validated here based on four particular
heating days with various WPC distributions (2015.12.18,
where Cav represents the average electricity price ($/kWh) before
2016.01.21, 2016.02.22, and 2016.04.03). The following four
the price adjustment. In addition, the import rate Pen.in(t) (MW)
different heating scenarios are simulated for each day to
of an REB at time step t must not exceed its maximum import
evaluate the performance of the proposed approach in putting
limit Pin.N (MW):
additional wind generation onto the grid and reducing heating
0 ≤ Peb.in (t) ≤ Pin.N . (9) costs met by the user set.
Scenario 1: Conventional heating with a constant conventional
A flowchart describing the optimization of the REB imports heating price;
under the RTP scheme is shown in Figure 3. Scenario 2: Wind power heating under peak-to-valley
As a comparison to the wind power heating cost, the electricity price scheme with REB importing at off-peak time;
conventional heating cost for the heating area Shot (m2) is also Scenario 3: Wind power heating under peak-to-valley
estimated here based on the conventional heating price Cr ($/m2) electricity price scheme with REB tracking WPC;
for an entire heating season and then evenly spread to each day Scenario 4: Wind power heating under the RTP scheme with
within the season. REB tracking WPC.
Frontiers in Energy Research | www.frontiersin.org 5 February 2021 | Volume 9 | Article 634603Li et al. Electricity Price Model for DSM
TABLE 2 | Technical parameters of a single REB.
Boiler type Footprint/m2 Maximum import limit/MW Total Maximum heat storage
heat storage /MWh temperature/°C
Solid REB 48 3.5 28 850
TABLE 3 | Residential district heating parameters.
Parameter Value
η 98%
Total heating area, Shot 15*200,000 m2
Daily heating duration, Th 24 h
Heat load index, W 58 W/m2 Beijing Gas and Heating Engineering Design Institute (2010)
Conventional heating price, Cr 3.92 $/m2
Ci max 0.58 $/kWh
FIGURE 4 | Daily curves of WPC (MW) and corresponding RTPs (C/ /kWh) on (A) 2015.12.28, (B) 2016.01.21, (C) 2016.02.22, and (D) 2016.04.03.
The 5-minute average available wind power output forecasts and Table 1 (Jilin Province Price Bureau, 2018). The total area of the
actual demands at a provincial level in the “Three-North regions” over 15 residential districts with the heat demand across the province is
each day are converted into 1-hour average data in line with the about 3 million m2. Given technical parameters of a solid REB and the
adopted time step length. The province studied here currently employs residential district heating as listed in Tables 2, 3, respectively, it is
peak-to-valley electricity prices for electric heating, as shown in evaluated by Eq. 6 that each 0.2 million m2 residential district needs to
Frontiers in Energy Research | www.frontiersin.org 6 February 2021 | Volume 9 | Article 634603Li et al. Electricity Price Model for DSM
FIGURE 5 | Aggregation of optimized REB imports (MW) and remaining WPC (MW) under Scenario 4 on (A) 2016.01.21 and (B) 2016.02.22.
be equipped with 11 REBs. Therefore, it is presumed here that a total distribution of WPC. For example, only 2080.2 MWh otherwise
of 165 REBs are installed within the whole province. curtailed wind generation is absorbed by REBs on 2016.02.22 where
the WPC mostly occurs during peak demands (see Figure 4C).
Compared to the conventional heating method in Scenario 1,
Simulation Results of the RTP Decision the peak-to-valley electricity price pattern adopted in Scenarios 2
Model and 3 leads to significant electric heating costs. With the
Figure 4 shows the daily curves of WPC forecasts on the four implementation of the RTP scheme in Scenario 4, total electric
heating days and their corresponding RTPs determined by the heating costs are largely reduced to the levels close to or even
RTP decision model (for the exact RTP values, the reader is smaller than the total conventional heating cost. The significantly
referred to Table A1 in Appendix). The WPC is shown to not decreased electric heating costs will make the electric heating with
only happen in off-peak periods but may also occur at times of REBs more attractive, expanding the scale of the wind power
normal or even peak electrical demands. This means that REBs heating mode. In addition, the total heating cost on 2016.02.22 is
simply importing during electrical demand troughs cannot higher than the total cost on 2016.01.21 under Scenario 4. This is
ensure the WPC to be minimized. Therefore, it is necessary to because the WPC occurs at such fewer time steps that higher RTPs
implement the RTP scheme that guides the user set to charge are issued on 2016.02.22. Among all heating scenarios, Scenario 4
REBs in response to the WPC, that is, tracking the WPC. using REBs to track the WPC under the RTP scheme achieves the
greatest WPC reduction and an acceptable total heating cost.
The additional wind generation put onto the grid can reduce
Evaluation on WPC Reductions and Heating fossil fuel consumptions of conventional thermal power plants and
Costs thus increase the environmental benefit. The revenue associated
In Scenario 4, the time and rates at which the REBs import are with the environmental benefit received by wind farms can
optimized to minimize the total heating cost. Figure 5 shows the contribute to the use-of-system charge paid to the SO who is
aggregation of the optimized imports of REBs along with the responsible for the reliable system operation. The win-win
remaining WPC in Scenario 4 on 2016.01.21 and 2016.02.22 where situation of wind farms, network owners, and electric heating
the REB imports greatly increase wind power consumptions which users illustrates the feasibility of implementing the DSR with
would otherwise be curtailed during off-peak and peak periods, REBs under the RTP scheme as proposed in this work.
respectively. To illustrate the advantages of the DSR model under
the RTP scheme adopted in Scenario 4, total WPC reductions and
total heating costs over each day estimated under the four heating CONCLUSION AND FUTURE WORK
scenarios are compared in Figure 6 and Table 4.
The wind power heating mode employed in Scenarios 2–4 is The electric heating demand management permitted by the heat
mostly shown to achieve a maximum of 4261.2 MWh WPC storage combined with a suitable electricity price incentive is
reduction with the help of REBs. However, simply charging expected to assist in the development of the wind power heating
REBs at off-peaks in Scenario 2 may decrease the REB mode during winter heating periods. This study has developed a
performance in the WPC reduction depending on the temporal real-time price (RTP) decision model to introduce an RTP scheme
Frontiers in Energy Research | www.frontiersin.org 7 February 2021 | Volume 9 | Article 634603Li et al. Electricity Price Model for DSM
FIGURE 6 | WPC reductions (MW) under the four heating scenarios on (A) 2016.01.21 and (B) 2016.02.22.
Building on the present work, the integrated energy system modeled
TABLE 4 | Total WPC reductions (MWh) and heating costs (10 k$) under four
heating scenarios on two particular days.
here should be extended to incorporate other renewable energy
resources such as photovoltaic energy and reflect transmission
WPC reduction/MWh Heating cost/10 k$ constraints on both heat and electricity. This will permit to estimate
2016.01.21 2016.02.22 2016.01.21 2016.02.22 the most suitable REB locations within the system that maximize the
use of renewable energy. Furthermore, capital and operating
Scenario 1 0 0 6.992 6.992
Scenario 2 4261.2 2080.2 17.65 17.65 expenditures of REBs will be compared with the heating cost saving
Scenario 3 4261.2 4261.2 19.796 39.148 of users relative to the conventional heating. The cost–benefit analysis
Scenario 4 4261.2 4261.2 4.542 7.906 can indicate the investment return and payback period, assessing the
economic feasibility of deploying REBs from the perspective of heating
users. In addition, the proposed RTP-based demand side management
taking into account a negative correlation between the RTP and the for the wind or renewable power heating will be further tested on other
wind power curtailment (WPC) within a particular dispatch day. cities or provinces, for example, in the “Three-North regions,” which
The time-varying RTPs not only met the acceptable range of electric are suffering from the WPC problem in heating seasons.
heating users but also covered the cost of a wind farm to put
otherwise curtailed wind power onto the grid. Given electric heating
users being equipped with regenerative electric boilers (REBs), a
DATA AVAILABILITY STATEMENT
demand side response (DSR) model using REBs under the RTP
scheme was developed to minimize the total electric heating cost by The original contributions presented in the study are included in
charging REBs at lower RTPs so as to alleviate the higher WPC. The the article/Supplementary Material; further inquiries can be
developed RTP decision and DSR models have been tested on four directed to the corresponding author.
particular heating days at a provincial level in the “Three-North
regions” in China. Compared to the currently adopted peak-to-
valley price pattern, the RTPs reflecting the WPC distribution in a AUTHOR CONTRIBUTIONS
dispatch day permitted the electric heating users with REBs to exploit
the price opportunity while helping to increase wind power QL performed the experiment and simulation; JL contributed to
consumptions. Furthermore, the implementation of the RTP the conception of the work; ZH performed analysis and prepared
scheme largely reduced the total electric heating cost met by the manuscript; FF performed analysis and revised the
users to the level close to or even smaller than the conventional manuscript; and WT assisted in analysis with constructive
heating cost, which may increase the attractiveness of the electric discussions.
heating with REBs in cost, and in turn, expand the scale of the wind
power heating mode. In addition, the DSR model optimizing the
REB imports to track the lower RTPs has maximized the WPC FUNDING
reduction in this work, while simply charging the REBs during
electrical demand troughs may degrade the WPC alleviation This research was supported by National Natural Science
depending on the temporal distribution of WPC. Foundation of China (NSFC) (51707016).
Frontiers in Energy Research | www.frontiersin.org 8 February 2021 | Volume 9 | Article 634603Li et al. Electricity Price Model for DSM
REFERENCES Liu, J. (2013). Basic issues of the utilization of large-scale renewable power with
high security and efficiency. Proc. Chin. Soc. Electr. Eng. 33 (16), 2–8. doi:10.
3969/j.issn.2095-0802.2014.11.031 [in Chinese, with English summary].
Ai, X., Zhou, S., and Zhao, Y. (2016). Study on time of use pricing of user side Lü, Q., Wang, W., Han, S., Yuan, S., Zhang, J., and Li, W. (2013). A new evaluation
considering wind power uncertainty. Power Syst. Technol. 40 (5), 1529–1535. method for wind power curtailment based on analysis of system regulation capability.
doi:10.13335/j.1000-3673.pst.2016.05.035 [in Chinese, with English summary] Power Syst. Technol. 37 (7), 1887–1894. [in Chinese, with English summary]. doi:10.
Chen, L., Xu, F., Wang, X., Min, Y., Ding, M., and Huang, P. (2015). 1016/S0924-8579(07)70847-6
Implementation and effect of thermal storage in improving wind power National Energy Administration (2020). Wind power grid operation in the
accommodation. Proc. CSEE 35 (17), 4283–4290. doi:10.13334/j.0258-8013. first half of 2018. Available at: http://www.nea.gov.cn/201802/01/c_13694
pcsee.2015.17.001 [in Chinese, with English summary] 2234.htm (Accessed February 1, 2020) [in Chinese, with English summary].
Comprehensive Department of National Energy Administration (2015). Notice on [Online]
the work of clean heating using wind power (No. 306, 2015). Available at: http:// Sánchez de la Nieta, A. A. S., Contreras, J., Muñoz, J. I., and O’Malley, M. (2014).
zfxxgk.nea.gov.cn/auto87/201506/t20150615_1938.htm (Accessed June 5, Modeling the impact of a wind power producer as a price-maker. IEEE Trans.
2015) [in Chinese, with English summary]. [Online] Power Syst. 29 (6), 2723–2732. doi:10.1109/tpwrs.2014.2313960
Cui, Y., Chen, Z., Yan, G., and Tang, Y. (2016). Coordinated wind power Schmidt, M., and Linder, M. (2020). A novel thermochemical long term storage
accommodating dispatch model based on electric boiler and CHP with concept: balance of renewable electricity and heat demand in buildings. Front.
thermal energy storage. Proc. CSEE 36 (15), 4072–4081. [in Chinese, with Energy Res. 8, 137. doi:10.3389/fenrg.2020.00137
English summary]. doi:10.13334/j.0258-8013.pcsee.152406 Shafie-khah, M., Heydarian-Forushani, E., Golshan, M. E. H., Moghaddam, M. P.,
De Jonghe, C., Hobbs, B. F., and Belmans, R. (2014). Value of price responsive load Sheikh-El-Eslami, M. K., and Catalão, J. P. S. (2015). Strategic offering for a
for wind integration in unit commitment. IEEE Trans. Power Syst. 29 (2), price-maker wind power producer in oligopoly markets considering demand
675–685. doi:10.1109/tpwrs.2013.2283516 response exchange. IEEE Trans. Ind. Inf. 11 (6), 1542–1553. doi:10.1109/tii.
Energy Administration of Jilin Province (2017). Notice on issuing the “13th Five- 2015.2472339
Year plan” for energy development in Jilin. Available at: http://nyj.jl.gov.cn/ Shen, J., Jiang, C., Liu, Y., and Wang, X. (2016). A microgrid energy management
ghjh/20170522/852.html(Accessed May 22, 2017) [in Chinese, with English system and risk management under an electricity market environment. IEEE
summary]. [Online] Access 4, 2349–2356. doi:10.1109/access.2016.2555926
Fan, F., Xu, H., and Kockar, I. (2019). “Utilisation of energy storage to improve Shin, H., Lee, D., and Baldick, R. (2017). An offer strategy for wind power
distributed generation connections and network operation on Shetland producers that considers the correlation between wind power and real-time
Islands,” in Proceedings of 25th international conference on electricity electricity prices. IEEE Trans. Sustainable Energy 9 (2), 695–706. doi:10.1109/
distribution, Madrid, Spain, June 3, 2019 (CIRED 2019 Conference), 1764, 1–5. TSTE.2017.2757501
Beijing Gas; Heating Engineering Design Institute (2010). City thermal net design Sioshansi, R., and Short, W. (2009). Evaluating the impacts of real-time pricing on
criterion CJJ34-2010. Beijing, China: China Architecture & Building Press, 21–30. the usage of wind generation. IEEE Trans. Power Syst. 24 (2), 516–524. doi:10.
Gifford, J., Ma, Z., and Davenport, P. (2020). Thermal analysis of insulation design 1109/tpwrs.2008.2012184
for a thermal energy storage silo containment for long-duration electricity Wang, C., Li, Q., and Xie, G. (2013). Evaluation of wind power heating in
storage. Front. Energy Res. 8, 99. doi:10.3389/fenrg.2020.00099 facilitating wind power integration capability during valley load period.
Jilin Province Price Bureau (2018). Notice on further clarifying the relevant issues Electr. power 46 (12), 100–106. [in Chinese, with English summary]. doi:10.
concerning the clean heating price policy of the province. Available at: http://wjj.jl. 4028/www.scientific.net/amr.953-954.501
gov.cn/scjgjg/zyynyjg_67230/dj/201802/t20180223_3716147html(Accessed Xie, D., Lu, Y., Sun, J., Gu, C., and Li, G. (2016). Optimal operation of a combined
February 23, 2018) [in Chinese, with English summary]. [Online] heat and power system considering real-time energy prices. IEEE Access 4,
Ketterer, J. C. (2014). The impact of wind power generation on the electricity price 3005–3015. doi:10.1109/access.2016.2580918
in Germany. Energy Econ. 44, 270–280. doi:10.1016/j.eneco.2014.04.003 Xu, M., and Jiang, D. (2015). Research on energy performance and economic
Khodayar, M. E., and Shahidehpour, M. (2013). Stochastic price-based coordination analysis of wind power heating system. Energy China 37 (8), 42–47. doi:10.
of intrahour wind energy and storage in a generation company. IEEE Trans. 3969/j.issn.1003-2355.2015.08.008 [in Chinese, with English summary]
Sustain. Energy 4 (3), 554–562. doi:10.1109/tste.2012.2228284 Yao, S., Gu, W., Zhou, S., Lu, S., Wu, C., and Pan, G. (2018). Hybrid timescale
Li, Y., Wang, C., Li, G., Wang, J., Zhao, D., and Chen, C. (2020). Improving dispatch hierarchy for combined heat and power system considering the
operational flexibility of integrated energy system with uncertain renewable thermal inertia of heat sector. IEEE Access 6, 63033–63044. doi:10.1109/
generations considering thermal inertia of buildings. Energy Convers. Manag. access.2018.2876718
207, 112526. doi:10.1016/j.enconman.2020.112526
Li, Y., Wang, J., Zhao, D., Li, G., and Chen, C. (2018a). A two-stage approach for Conflict of Interest: The authors declare that the research was conducted in the
combined heat and power economic emission dispatch: combining multi- absence of any commercial or financial relationships that could be construed as a
objective optimization with integrated decision making. Energy 162, potential conflict of interest.
237–254. doi:10.1016/j.energy.2018.07.200
Li, Y., Yang, Z., Li, G., Mu, Y., Zhao, D., Chen, C., et al. (2018b). Optimal Copyright © 2021 Li, Li, Huang, Fan and Teng. This is an open-access article
scheduling of isolated microgrid with an electric vehicle battery swapping distributed under the terms of the Creative Commons Attribution License (CC BY).
station in multi-stakeholder scenarios: a bi-level programming approach via The use, distribution or reproduction in other forums is permitted, provided the
real-time pricing. Appl. Energy 232, 54–68. doi:10.1016/j.apenergy.2018.09.211 original author(s) and the copyright owner(s) are credited and that the original
Li, Z., Wu, W., Shahidehpour, M., Wang, J., and Zhang, B. (2015). Combined heat and publication in this journal is cited, in accordance with accepted academic practice.
power dispatch considering pipeline energy storage of district heating network. No use, distribution or reproduction is permitted which does not comply with
IEEE Trans. Sustainable Energy 7 (1), 12–22. doi:10.1109/TSTE.2015.2467383 these terms.
Frontiers in Energy Research | www.frontiersin.org 9 February 2021 | Volume 9 | Article 634603Li et al. Electricity Price Model for DSM
APPENDIX
TABLE A1 | Exact RTP values (C/ /kWh) on (a) 2015.12.18, (b) 2016.01.21, (c) 2016.02.22, and (d) 2016.04.03.
Day(a) Hour 1 2 3 4 5 6 7 8 9 10 11 12
RTP 1.475 1.524 1.579 1.578 1.578 1.470 1.470 1.410 1.439 1.685 9.257 —
Hour 13 14 15 16 17 18 19 20 21 22 23 24
RTP — — 58.000 16.364 — 1.907 1.840 2.005 1.598 2.616 — —
Day(b) Hour 1 2 3 4 5 6 7 8 9 10 11 12
RTP 1.146 1.089 1.022 1.027 1.114 1.170 1.021 1.056 1.821 — — 40.206
Hour 13 14 15 16 17 18 19 20 21 22 23 24
RTP 9.188 2.835 2.063 1.818 4.130 54.782 7.595 2.842 1.955 1.427 1.206 1.085
Day(c) Hour 1 2 3 4 5 6 7 8 9 10 11 12
RTP 3.448 4.7746 3.940 3.979 — — — — — — — —
Hour 13 14 15 16 17 18 19 20 21 22 23 24
RTP — 14.551 3.039 2.339 1.357 1.105 1.333 1.549 1.460 2.368 5.937 5.497
Day(d) Hour 1 2 3 4 5 6 7 8 9 10 11 12
RTP 1.220 1.122 1.104 1.119 1.088 1.182 1.436 1.395 1.969 2.358 12.079 35.121
Hour 13 14 15 16 17 18 19 20 21 22 23 24
RTP 13.779 21.103 8.387 23.961 11.911 2.320 4.305 22.441 6.776 1.950 1.984 1.209
Frontiers in Energy Research | www.frontiersin.org 10 February 2021 | Volume 9 | Article 634603You can also read