A CASE STUDY OF THE PROSPECTS ON SOLAR INDUSTRY PLAYERS
←
→
Page content transcription
If your browser does not render page correctly, please read the page content below

Ming-Lang Wang, Kang-Wei Wang, Int. Jou Eco.& Res, 2020, V11 i3 (mj), 89 – 110   ISSN: 2229-6158

    A CASE STUDY OF THE PROSPECTS ON SOLAR INDUSTRY PLAYERS
                     Ming-Lang Wang1, *, Kang-Wei Wang2
                          marlon@g.chu.edu.tw1,*, w6211082000@yahoo.com.tw2
       1
           Department of Industrial Management, Chung Hua University, Associate Professor
                    30012, No.707, Sec.2, Wu-Fu Rd., Hsinchu City, Taiwan, R.O.C.
           2
               Medical Affairs Bureau Ministry of National Defense, Director, Comptroller Office
               10462, No.409, Bei-An Rd., Taipei City 104, Republic of China (Taiwan)
                              *Corresponding author , marlon@g.chu.edu.tw
Abstract
Due to the rapid economic development, Taiwan’s demand for energy is increasing urgently. Nowadays, fossil fuels are still
the primary source of energy. However, carbon dioxide emissions cause the greenhouse effect and abnormal climate change.
To reduce carbon dioxide emissions, the Kyoto Protocol and the Copenhagen Accord have become the international norms.
"Renewable Energy" has become the focus of global energy development. The solar energy industry in Taiwan has been
developed for more than 20 years. The industry has developed from the past "amorphous silicon" research and manufacturing
to today's "crystalline silicon solar cells" mass production. This study expects that by discussing the development strategy of
the solar energy industry. In the current competitive environment, we will select an appropriate development strategy and
take the Taiwanese solar energy industry structure as the main elements of analysis. Based on the operating experience of key
solar companies in Taiwan and the formulation of government policies, the study finds that the driving factors affecting the
introduction of the solar industry are government promotion and intervention constructs, functional constructs, technical
constructs, efficiency constructs, and risk constructs. Besides, from the above findings, the following suggestions are made: 1.
The government must formulate accurate subsidies and incentives, 2. The government and industry strategic alliance, 3.
Improve the photoelectric conversion rate and establish technology Patents, 4. Develop the most appropriate development
strategy to avoid marginalization.

Keywords: Solar Industry; Development Strategy; Driving Factors; Industrial Potential

1.Background
      In the face of the global energy crisis, the solar energy industry is becoming increasingly important.
In order for this industry to play the role of sustainable energy in Taiwan, the government and the
private sector promote relevant measures to raise the development of the solar energy industry. Taiwan
is located in the subtropical region, and the long sunshine time is very suitable for the development of
solar energy. Although the sunshine conditions are good, the land conditions in Taiwan where solar
energy equipment can be installed are insufficient. According to the statistics of the Department of
interior, Taiwan's per capita land area is 1532 square meters, Population density is second only to
Bangladesh, ranking second in the world (Xi-Min Lu, 2016). Under such conditions, the land area in
Taiwan where solar energy facilities can be installed is greatly restricted. Non-nuclear homes are the
primary energy policy of the Taiwanese government. It is expected that the renewable energy power
generation ratio will reach 20% by 2025. The development of solar energy has become a major
government policy. (Minutes of the "29th Committee Meeting of the National Council for Sustainable
Development of the Executive Yuan", 2016).

      IJER – May - June 2020                                                                                              89
      available online @ www.ijeronline.com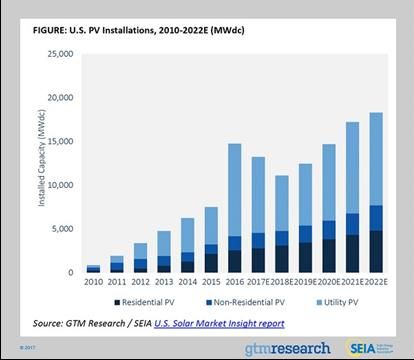
Ming-Lang Wang, Kang-Wei Wang, Int. Jou Eco.& Res, 2020, V11 i3 (mj), 89 – 110   ISSN: 2229-6158

     The Executive Yuan announced the "Sustainable Energy Policy Convention" in 2008. At the clean
level, the country ’s carbon dioxide emissions will be reduced and will return to 2005 emissions in 2020.
The low-carbon energy in the power generation system will increase from 40% to more than 55%. (A
Study of Sustainable Energy Policy Convention, 2008). In 2000, Motech Industries Inc., Taiwan's first
solar industry manufacturer, was established. The company's solar cell conversion rate reached 13% in
the next year. In 2007, it was the first in Taiwan to pass the ISO14001 environmental management
systems and Occupational Health and Safety Assessment Series 18001 certification, becoming the
world's sixth largest solar electronics manufacturer and the leader of Taiwan's solar industry. Among

them are E-Ton Solar Tech.、Sino-American、Giga Solar、NSP Corp.、GINTECH and other related solar

listed and OTC companies.
     Sino-American, Giga Solar, NSP Corp., and GINTECH have invested in stable and profitable
investments in power plants at home and abroad. In recent years, NSP Corp. has covered the United
States, Britain, and Japan, and has entered the European Union, Central Asia, Southeast Asia, Africa,
and Central and South America. After the power plant completes the merger and acquisition, part of the
power will be resold. To sell 70% to keep 30% of the business model. Although the long-term operating
investment rate of return of the power plant is less than 10%, it is very suitable for long-term stable
enterprise investment (Yong-Xiang Jian, 2016). Taiwan's solar output value reached a new high of NT$
2015 billion in 2010, but in 2011, due to the low price competition in China and the European debt crisis,
market demand has shrunk significantly, and the output value has dropped to NT$ 170.8 billion. In 2012,
it fell sharply to NT$ 93 billion. In 2014, the output value returned to NT$ 114.7 billion. Although it was
hit by the US anti-dumping and countervailing investigations in 2015, the output value still reached NT$
156.1 billion (Department of Statics, Economic of Affairs, 2015).
     After years of development, Taiwan’s solar energy industry has become a core competitive
advantage of the industry with high efficiency, low cost, and flexibility. Integrate the cooperation of
upstream, midstream and downstream companies for R & D. Through international cooperation, develop
forward-looking key technologies and niche products to assist industrial technology upgrades. At the
same time, use overseas marketing strategies and operating methods to expand overseas markets.
Taiwan has unlimited potential to develop solar energy, and has excellent technology research and
development and manufacturing capabilities, but it lacks long-term planning, relevant regulatory
integration, and insufficient domestic demand market. It is necessary to create the highest benefits under
limited resources through industry-government-academic cooperation (Cheng-Cong Guo, 2015).
     The core values of Taiwan's development of the solar energy industry are discussed from the
"economic energy perspective", "innovative technology perspective", and "environmental sustainability
perspective". The purpose of this study is: 1. To explore the driving factors driving the development of
the solar energy industry. 2. Analyze the development trend and industrial potential of Taiwan's solar

     IJER – May - June 2020                                                                                            90
     available online @ www.ijeronline.com
Ming-Lang Wang, Kang-Wei Wang, Int. Jou Eco.& Res, 2020, V11 i3 (mj), 89 – 110 ISSN: 2229-6158
energy industry. 3. Whether Taiwan is competitive in the development of the solar energy industry.
4. Provide reference for government to formulate relevant policies and counseling and subsidy
measures for enterprises.
2.Literature Review
2.1 Definition of Solar Energy
The types of solar energy can be divided into thermal energy and light energy. In the thermal
energy part, they can be divided into solar water heaters and solar thermal power generation. It can also
be called solar cell in the light energy part, and can be divided into silicon semiconductor and thin film.
Silicon semiconductors can be divided into a-Silicon wafer, Poly-Silicon silicon wafers, and a-Si thin
films; thin films can be divided into compound semiconductors and new technologies and new materials.
What are new technologies and new materials? For example, organic silicon dye-sensitized solar cell
(DSSC, DSC or DYSC), polymer, or nanotechnology, spherical silicon (Zhao-Wei Zheng, 2011).
2.2 Utilization, advantages and disadvantages of solar energy
There are three main methods for directly using solar radiation energy: the first method is
photothermic conversion; the second method is photoelectric conversion; the third method is
photochemical conversion. Photothermic conversion, which is a commonly used method at present, is
widely used in cooking, drying cereals, supplying hot water, heating indoors, air conditioning, solar
thermal power generation, and high temperature heat treatment. Solar energy can also be used in
seawater desalination, etc. Photoelectric conversion is the direct conversion of solar energy into
electrical energy. It uses the photoelectric effect of certain substances to directly convert solar radiation
energy into electrical energy. Its core is the solar cell. Since solar energy must have enough area to
receive sunlight, and it requires a large amount of silicon or compound semiconductors, the demand far
exceeds the use of integrated circuits (ICs). Therefore, the most important key to the solar industry lies
in the upstream raw materials and wafers. Whoever can master the upstream raw materials and wafer
production technology can master the entire industry. However, Taiwan does not have silicon ore
(silicon oxide) or silicon raw material manufacturing technology, so the raw materials used by Taiwan ’s
solar industry are actually controlled by foreign manufacturers.
Taiwan's main strength in the global solar energy industry chain is the silicon chips and battery
modules in the midstream. Silicon chip manufacturers include Green Energy, Danen Tech.,
Sino-American, Sino-American, Eversolcorp, and GIGASTORAGE. In terms of solar cells, major
manufacturers include Motech Industries Inc., NSP, GINTECH, Phoenix Silicon Inc., Tainergy Tech Co.
Ltd., E-Ton Solar Tech, TSEC Corp., etc. In 2015, with a total global solar cell production capacity of
55GW, Taiwan accounted for 8GW of production, and the world's second largest market share, after
China's 30GW. In terms of downstream modules, TYNSOLAR CORPORATION and Inventech are
represented. However, due to the small size and high cost of Taiwan's module factories, the global
IJER – May - June 2020 91
available online @ www.ijeronline.comMing-Lang Wang, Kang-Wei Wang, Int. Jou Eco.& Res, 2020, V11 i3 (mj), 89 – 110 ISSN: 2229-6158
market competitiveness is weak (Jun-Hua Wu, 2017). In terms of materials, conductive paste is a key
component of solar cells. Silver aluminum paste can be applied to the serial wires of solar cell modules.
At present, Taiwanese manufacturer GigaSolar has become a leader in this field and can compete with
international manufacturers.
2.3. Taiwan solar energy development problems and solutions
According to the above, the problem can be categorized into two aspects: environmental aspect and
technical aspect. Cheng-Cong Guo (2015) pointed out that nothing more than land resource use and
ecological hazards. Although solar power plants can reduce air pollution, they require a lot of area.
Although solar power plants can reduce air pollution, they require a lot of area. In Taiwan, which is
densely populated, has a population density of 644 people per square kilometer, and ranks 10th in the
world, it requires considerable effort and coordination to build many solar power plants. Solution: (a)
Use the roof, walls, windows, etc. of the home school as much as possible to build solar power facilities;
(b) Use remote areas, mountain areas, open spaces on both sides of highways, and railways to build
large-scale solar power plants to compensate for the land insufficient. (c) Installing large-scale solar
power plants in lakes, reservoirs or idle fishing ports is also a solution. The case of neighboring Asian
countries that lack land (Japan, South Korea, etc.) are currently constructing or have completed the
MW-level floating solar power plant case, which can provide Taiwan reference.
The cost of solar power generation is still higher than the cost of petrochemical power generation.
According to the Sunshot project of the United States Department of Energy (DOE), it is expected that
the module cost will be reduced to $ 0.50 per watt in 2020. At present, various countries have different
subsidies for large-scale solar power generation systems, and some adopt the renewable energy power
generation ratio system (Renewable Portfolio Standard, RPS). Some adopt a renewable energy power
purchase system (Feed-in Tariff, FIT), which is regarded as the most effective economic incentive.
Guaranteeing the purchase price has the functions of stabilizing market prices, increasing investment
confidence and ensuring investment cost-effectiveness.
2.4. Overview of global solar energy
Some cities in Germany and Japan have developed into solar cities, and the country has paid
attention to the development of solar energy very early, and has detailed promotion plans and programs.
Regarding Germany, in 2015, the capacity of German solar installations increased by 1.3GW, and
1.3GW of new installations were added. Although it is less than the target set by the German
government ’s renewable energy plan in 2014 (2.5 GW), it also accounts for solar energy worldwide 2%
of the newly added device capacity. The German government expects to have about 200GW of solar
installation capacity by 2050, so an average of 4-5GW of solar installation capacity needs to be added
every year. The German official report pointed out that the total solar power output in 2015 was
estimated to be 38.5TWh, which is equivalent to 7.5% of German electricity usage, providing a total of
IJER – May - June 2020 92
available online @ www.ijeronline.comMing-Lang Wang, Kang-Wei Wang, Int. Jou Eco.& Res, 2020, V11 i3 (mj), 89 – 110 ISSN: 2229-6158
38% of German electricity usage. According to statistics, at the end of 2015, the total solar energy
installation capacity in Germany was 40GW, and records show that during summer weekdays, solar
energy output can provide 35% of peaking power demand during weekends, and on weekends and
holidays, there are even records showing that solar energy output provides 50% peaking power demand.
Figure 1. Renewable energy generation ratio in Germany from 2005 to 2015
(Source: German Trade Office Taipei)
German solar power output began to increase significantly from 2010 to 2012, mainly due to
government policy guidance. The German government began to set solar power generation targets at the
time. This measure not only increased the proportion of solar power generation, but also helped the
energy transformation (German Trade Office Taipei, 2017).
In Japan, more than 80% of Japan ’s energy relies on imports. Since the Fukushima nuclear disaster,
the Japanese government has vigorously promoted renewable energy. In 2012, the “Special Measures for
Renewable Energy Act” was introduced, and electricity generated by solar power was purchased at a
high price. It also attracts Japanese companies to flock into the solar energy industry. However, as Japan
lowered its solar energy purchase price year by year, it caused Japan's "solar bubble" to collapse.
Japanese Tokyo Shoko Research (TSR) released a survey report on December 12, 2016, which pointed
out that the number of bankruptcies of Japanese solar-related companies reached 65 in 2016, a 20.4%
increase from 2015. The number of bankruptcies reached a record high since the investigation began in
2000. TSR also pointed out that "the elimination rate of the Japanese solar energy industry in 2017 will
probably be even greater than in 2016." In 2016, the purchase price of solar power in Japan was 24 yen
per KWh, which was 40% lower than the 40 yen in 2012. In 2017, the purchase price has been further
reduced to 21 yen. The Japanese government hopes to increase the proportion of renewable energy
generation to between 22% and 24% by 2030, but the current figure is still only 14%. Many renewable
energy supporters have begun to worry that the above goals may not have been achieved possibility
IJER – May - June 2020 93
available online @ www.ijeronline.comMing-Lang Wang, Kang-Wei Wang, Int. Jou Eco.& Res, 2020, V11 i3 (mj), 89 – 110 ISSN: 2229-6158
(Cheng-Qi Tsai, 2017).
In China, in 2006, China began to implement the "Renewable Energy Law of the People's Republic
of China". The implementation of this law provides policy protection for the development of the solar
industry. The signing of the Kyoto Protocol, the announcement of environmental protection policies and
the commitment to the world have brought opportunities to China's solar energy-related industries. The
development of western China provides a huge domestic market for the solar energy industry. The rise
in oil prices and the adjustment of China's energy strategy have led the government to increase its
support for the development of renewable energy sources. All of these will bring great opportunities for
the development of China's solar energy industry. In addition, China is also actively using the funds and
technologies of international organizations such as the Global Environmental Fund, World Bank, the
United Nations Development Program, and the Asian Development Bank and related national
governments' fund and technology to accelerate the commercialization of China's solar cell industry and
solar power generation. Overall, the three major cities of Shenzhen, Beijing, and Shanghai took the
opportunity to garden park expositions, Olympics, and World Expos, and entered into a show of the use
and exhibition of green energy, such as solar energy and other renewable energy, and were planned to
enter the venue in the large-scale construction that highlights the image of the city, it demonstrates the
achievements China has made in developing solar power systems (Chia-Sheng Wang, 2011).
The largest solar plant in the United States, ISEGS, is located in the City of Needles, California.
There are three plants in total. The maximum power generation capacity is as high as 377,000 kw, which
is the largest in the world and can meet the peak-time electricity demand of 140,000 California
households. As the number of solar installations in the United States continues to grow, the price of
large solar power plants fell below the threshold of $ 1 per watt for the first time. The US market
continued the installed capacity of solar energy in 2016, and the installed capacity in the first quarter of
2017 increased by 2044MW. According to the US Solar Energy Industries Association (SEIA) and the
GTM research report "U.S. Solar Market Insight Report", the first quarter of 2017 was the sixth
consecutive quarter in the United States where the single-season installed capacity exceeded 2GW, and
the installed capacity of large-scale power plants also continued to exceed 1GW. The report points out
that the US non-residential solar market grew by 29% compared with the first quarter of 2016. However,
due to the peak installed capacity in the fourth quarter of 2016, the first quarter of 2017 fell by 39%
compared with the previous quarter. The report explained that after the United States announced the
extension of the Investment Tax Relief (ITC) program, the demand for rush-installation of large-scale
solar power plants decreased, and the demand continued from 2016 onwards. At present, the state with
the fastest solar energy development in the United States is Minnesota, and community-based solar
systems continue to contribute to the state's solar development. Idaho and Indiana saw significant growth
in solar capacity in the first quarter of 2017, with emerging markets in Utah, Texas and South Carolina,
IJER – May - June 2020 94
available online @ www.ijeronline.comMing-Lang Wang, Kang-Wei Wang, Int. Jou Eco.& Res, 2020, V11 i3 (mj), 89 – 110 ISSN: 2229-6158
and California continuing to maintain the largest domestic solar market in the United States (Delilah Lin,
2017).
SEIA also estimated in the report that in the next five years, the total installed capacity of the
United States will increase three times than it is now; the installed capacity in 2017 will reach 12.9GW,
which will be 10% less than the installed capacity in 2016. Starting from 2022, the annual installed
capacity of solar energy will reach at least 18GW. Abigail Ross Hopper, SEIA ’s director and chief
executive, said, “The US solar industry continues to grow, contributing 17 times faster job opportunities
than the US economy. Moreover, solar energy has the advantage of low price and will become
increasingly important in the market. "
Figure 2 SEIA estimated solar system installation capacity from 2017 to 2022 (source:Austin Perea, 2017)
2.5. Comparison of advantages and disadvantages of the global solar industry
In order to enhance the future competitive advantages of Taiwan's solar photovoltaic industry, this unit
selects the four countries of the United States, Japan, Germany, and China to compare their solar energy
industry development trends and government related industrial policy key projects with Taiwan to provide
development directions and policy recommendations.
In the United States, the diversification of state markets is the strength of the United States, making
the United States less vulnerable to the non-prosperity or recession cycle encountered by many European
solar photovoltaic markets. Coupled with the vast land and sunny California and the southwestern
United States, the power plants are very densely set up, suitable for solar energy development. The US
plans to implement state-level and local policy measures including improved net metering electricity
prices and parallel system regulations. The regulations passed the third-party subsidy model and
IJER – May - June 2020 95
available online @ www.ijeronline.comMing-Lang Wang, Kang-Wei Wang, Int. Jou Eco.& Res, 2020, V11 i3 (mj), 89 – 110 ISSN: 2229-6158
renewable energy power generation quota system (RPS). Unfortunately, the current tax incentives do not
take into account system performance, lifespan, and solar power generation time. Therefore, compared
to Europe, China, Japan, and other countries, the US market actually shows unhealthy growth (Jung-Hui
Chiu, 2012).
In China, solar energy resources are very rich. More than two-thirds of the country's land area has
more than 2200 hours of annual sunshine hours. Therefore, the prospects for using solar energy
resources in China are very broad. China's use of solar energy is still in its infancy, and there is still a
considerable gap compared with developed countries. Overall, the main components of the cost of solar
products include raw materials, equipment and manpower. The cost of raw materials accounts for the
highest proportion. Most of China's polysilicon is imported from abroad. With the current domestic
refining technology, the refined polysilicon has high cost and poor quality. Therefore, China has no
advantage in terms of raw material costs. But in terms of equipment and manpower, China's advantages
are quite obvious (Zhen-Hua Zhu, 2013).
In Germany, the common market is one of the most important goals of regional integration in
Europe. The purpose is to create a win-win situation for Germany through the free circulation of capital,
goods, services and personnel. Both technology and commodities have good circulation, further
expanding the market of German products, FIT created a solar miracle in Germany. The German version
of FIT allows power companies to distribute the additional costs equally to all users, allowing market
incentives other than government subsidies to become the main growth drivers of the industry. FIT
allows all power users to participate substantially, and it also promotes the willingness of private
financing to the solar industry. As long as the solar power generation system is connected to the national
distribution network, it will enjoy a 20-year fixed price purchase guarantee. In addition to facilitating the
calculation of the investment rate of return of the industry, group or individual, it also makes the relevant
manufacturers feel the need to save costs under market competition (Dan Martin, 2009).
In Japan, with the introduction of Japanese solar photovoltaics, the cost of the system also began to
decline. Through the company's technology development and government support policies and the
purchase of surplus power by power companies, the domestic market of Japanese solar photovoltaics has
been established. In addition, Japan's Ministry of Education, Science and Culture, Ministry of Land,
Infrastructure, Transport and Tourism has budgeted to invest in solar power generation-related measures.
Furthermore, 655 local governments and towns in Japan have their own subsidy programs for residential
solar systems. However, since the 311 strong earthquake that triggered the Fukushima nuclear disaster in
2011, Japan ’s “solar bubble” collapsed as Japan ’s solar energy purchase prices were lowered year by
year (Jung-Hui Chiu, 2012).
In Taiwan, the advantages of the development of the semiconductor and flat panel display
industries have made Taiwan have considerable potential for the development of the solar industry. It is
IJER – May - June 2020 96
available online @ www.ijeronline.comMing-Lang Wang, Kang-Wei Wang, Int. Jou Eco.& Res, 2020, V11 i3 (mj), 89 – 110 ISSN: 2229-6158
also easier to enter the solar energy field because its manufacturing technology and semiconductor
manufacturing have many similarities. At present, Taiwanese manufacturers lack the manufacture of
silicon materials and must rely on foreign imports. The main production equipment must also rely on the
supply of foreign manufacturers. The cost of imports is high. Furthermore, Taiwan solar cell templates
and system verification systems and standards have not established international standards. Failure to
fully recognize each other internationally makes it extremely difficult to export products internationally.
Two-thirds of Taiwan ’s land is in high mountain areas, and only one-third of the land is suitable for
living, and most of it is concentrated on the southwestern coast, which limits the area of Taiwan ’s land
where solar facilities can be installed. Therefore, the use of unconventional installation area has become
an important strategy for the development of solar energy in Taiwan (Qi-Xiu Wang, Xiang-Ke Kong,
Zuo Yu-Ting, 2008).
3. Methodology
The purpose of the questionnaire is to explore Taiwan's solar industry players’ current
developments and related issues. The questionnaire used is the "Taiwan Solar Energy Industry
Development Questionnaire" compiled by researchers as a research tool. The Likert 5-points scale is
used, which are "very important", "important", "normal", "unimportant", and "very unimportant" for
respondents to evaluate the importance of relevant development profile questions. Among them, "very
important" is 5 points, and "very unimportant" is 1 point. Distribution period: From December 2019 to
February 2020, a total of 400 copies were distributed, and the number of collections was 184. The
effective recovery rate was 46%.
3.1 questionnaire design
The questions in this research questionnaire refer to relevant literature. In the design of the
questionnaire, the practitioners of the solar energy industry are also consulted to assess whether the
questionnaire questions conform to the actual environment faced by the relevant personnel of the solar
energy company. The questionnaire questions in this study have been streamlined to facilitate the
respondent's answers, and the factors and opinions considered by the relevant personnel of the solar
industry when facing the problem are detailed in the questionnaire to improve the data collection.
According to Ai-Ling Huang et al. (2013) research, promotion facet refers to persuasion activities on
products or organizations and how to market in 7W, hoping to change customers’ attitudes or induce
customers to adopt certain actions that the government expects, therefore, you need to decide the target
ethnic group and the content of the message before using the promotion strategy, and then consider the
transmission media, channels and methods.
Tsu-Lung Chou (1999) pointed out that technology strategy is a part of business strategy. When
technology becomes an important and critical element in business operation and competition, enterprise
strategy planning also becomes important in business strategy link. In the era of knowledge economy,
IJER – May - June 2020 97
available online @ www.ijeronline.comMing-Lang Wang, Kang-Wei Wang, Int. Jou Eco.& Res, 2020, V11 i3 (mj), 89 – 110 ISSN: 2229-6158
technology has become the most important resource for enterprise competition. In high-tech industries,
technological resources and technical capabilities determine the main factors for the success or failure of
the industry's competition. Therefore, technology strategy is the key to business strategy. According to
domestic and foreign journals and literature, the facets that will affect the prospects of Taiwan's solar
industry are:
Prospects of the solar industry Development potential
Government promotion and intervention
Functional constructs
Technical constructs Solar industry
Efficiency constructs
Risk constructs
Figure 3-1. Research structure
3.2 Analysis method
Descriptive statistics provide a simple summary of the measured samples, and the results are
quantified. This result is part of the statistical data that forms a broader content. The data is organized
and summarized to describe the attributes of a certain group in order to have an overall understanding of
the general characteristics of the data.
Reliability analysis, questionnaire reliability refers to the reliability of the questions, that is the
measurement of error, and also the consistency or stability of the test results as the basis. Reliability
measures include test-retest reliability 、 split-half reliability 、 equivalent-forms reliability and
Cronbach’s α reliability, etc. (Wane S. Chou, 2002). Nunnally (1978) argues that in exploratory studies,
if the reliability is greater than 0.7, it is acceptable. The Cronbach's alpha value of this questionnaire is
0.709 in line with Nunnally's argument. If the reliability of the questionnaire is higher, it means that the
questionnaire is more stable.
Validity analysis, validity is whether the measurement tool can accurately check the consistency of
the items in the questionnaire. Generally used "Content Validity" and "Construct Validity". Content
validity refers to the appropriateness of the test questions to sample the relevant content or range of
IJER – May - June 2020 98
available online @ www.ijeronline.comMing-Lang Wang, Kang-Wei Wang, Int. Jou Eco.& Res, 2020, V11 i3 (mj), 89 – 110 ISSN: 2229-6158
behavior. "Construct Validity" refers to the degree of correspondence between a certain structure shown
in the measurement results and the measured values, that is, the degree to which the questionnaire can
measure the theoretical concepts or characteristics. Factor analysis is commonly used to construct
validity. This method is to extract the common factors between variables and represent the more
complex data with fewer constructs; based on the common factors extracted from the questionnaire, you
can understand the effective measurement of the questionnaire. What are the characteristics? Generally
speaking, in validity analysis, the indicators used to measure whether the items of the questionnaire have
good validity mainly include factor loadings and KMO (Kaiser-Meyer-Olkin) sampling suitability test
(Yu Huang, 2012).
KMO (Kaiser-Meyer-Olkin) sampling suitability test to check the correlation between variables.
The KMO value is between 0 and 1. When the KMO value is larger, it means that the lower the partial
correlation coefficient between any two variables. The more common factors there are, the better the
effect of factor analysis and extraction of common factors, and the more suitable for factor analysis.
According to Kaiser (1974), the suitability of factor analysis can be judged from the size of the KMO
sampling suitability value. The KMO standard is calculated as
The standard can take a value between 0 and 1. The KMO value must be at least greater than 0.6, and a
value above 0.9 indicates excellent results. The Kaiser-Meyer-Olkin sampling suitability in this study is
0.697. In other words, the value of this study is closer to 1, and there are more common factors between
variables. The effect of extracting common factors by factor analysis is relatively good., Suitable for
factor analysis.
Bartlett Test of Sphericity
Bartlett Test of Sphericity, Bartlett proposed a spherical test for the correlation matrix between
variables, and this test method showed a χ2 distribution, the higher the correlation between the variables,
the higher the value of χ2, indicating that it is more suitable for factor analysis. The χ²-distribution is
quite sensitive to the sample size, so in actual analysis, it is rarely presented that the spherical test
accepts the null hypothesis, that is, when the spherical test method is used, the opportunity for presenting
the results of the resource analysis is suitable. If there are k samples and sample differences
then Bartlett's test statistics are (Bartlett, 1951):
IJER – May - June 2020 99
available online @ www.ijeronline.comMing-Lang Wang, Kang-Wei Wang, Int. Jou Eco.& Res, 2020, V11 i3 (mj), 89 – 110 ISSN: 2229-6158
Factor analysis
The main purpose of factor analysis is to find out the structure of the data, use a few factors to
explain a group of variables that are related to each other, and retain the most information, and then
rename each factor. Factor analysis. The application of factor analysis is to find potential factors, filter
variables, summarize the data, select representative variables from the variables (select a variable to use
among the factors), construct validity, and simplify the data (variables with high correlation, only One
needs to be selected as a representative).
Factor Loadings
Factor loadings is the correlation between each variable and factor, so this value is like Pearson
correlations (Pearson correlations), the value is between -1 ~ 1. The square of the factor loadings
indicates how many variables this factor can explain. After executing the factor analysis, there is an
important decision, which variables can be attributed to a certain factor. According to Hair, J. F., Black,
B., Babin, B., Anderson, R. E., & Tatham, R. L. (1992) argument, factor loadings below 0.4 are too low
and 0.6 above is high. However, the data is just corroboration. Sometimes, due to various factors, the
results obtained are slightly lower than expected (Kim, J., & Mueller, C. W, 1978).
4. Results
4.1. Industry Sample Structure
This study uses secondary data analysis and literature review to establish a research structure, and
then through the literature to explore the relevant information and design questionnaire. It is hoped that
the results of the questionnaire survey will be used to understand the trend and vision of the solar
industry in Taiwan, and how the company will maintain a competitive edge and competitiveness in the
industry for future evaluation and research. Through the initial test, questionnaires are officially issued
and collected, and then use SPSS software to analyze. Beside, this study adopts Likert 5-Points Scale,
the instrument was validated in advance through several personal interviews with Solar Industry
managers on site, scoring the subjective cognition an "1" for very unimportant, and a "5" for very
important. The questionnaire was issued between December 2019 and February 2020. A total of 400
anonymous questionnaires were sent, and 216 valid questionnaires were found after deducting the
damaged and ones with incomplete answers. The effective recovery rate was 46.00%, and then use SPSS
18.0 software to analyze and understand the current and future trends and visions of Taiwan's food
biotechnology industry. The following are the results of our analysis such as the statistical variables of
the affiliated company, department, job title, work field, seniority of the relevant industry, company
capital composition, and company product items.
IJER – May - June 2020 100
available online @ www.ijeronline.comMing-Lang Wang, Kang-Wei Wang, Int. Jou Eco.& Res, 2020, V11 i3 (mj), 89 – 110 ISSN: 2229-6158
4.1.1. The Companies
Table 1. Distribution of effective samples of companies
Frequency Percentage Effective percentage Cumulative percentage
Giga Solar 30 16.3 16.3 16.3
SEC Corporation 47 25.5 25.5 41.8
GIGASTORAGE
Corp.
28 15.2 15.2 57.1
DANEN TECH. 7 3.8 3.8 60.9
Sino-American
Silicon Products Inc. 15 8.2 8.2 69.0
Others 57 31.0 31.0 100.0
Total 184 100.0 100.0
From the distribution of the above companies, "Other (DelSolar, Alfa Energy)" accounts for the
majority of 31%, followed by "TSEC Corporation" at 25.5%, and at least "Danen Technology" 3.8%.
4.1.2. Departments
Table 2. Distribution of effective samples by department
Effective
Frequency Percentage Cumulative percentage
percentage
R&D Department 32 17.4 17.4 17.4
HR Dept. 1 .5 .5 17.9
Marketing Dept. 7 3.8 3.8 21.7
Quality Control
Department
48 26.1 26.1 47.8
Maintenance department 20 10.9 10.9 58.7
Materials
3 1.6 1.6 60.3
Department
Financial Accounting
Department
5 2.7 2.7 63.0
Manufacturing
department 50 27.2 27.2 90.2
Purchasing Department 4 2.2 2.2 92.4
1
other 14 7.6 7.6
100.0
sum 184 100.0 100.0
In terms of the distribution of the above-mentioned departments, the "manufacturing department"
accounts for 27.2% of the majority, followed by the "quality control department" of 26.1%, and the
smallest department is the "human resources department" of 0.5%.
IJER – May - June 2020 101
available online @ www.ijeronline.comMing-Lang Wang, Kang-Wei Wang, Int. Jou Eco.& Res, 2020, V11 i3 (mj), 89 – 110 ISSN: 2229-6158
4.1.3. Job title
Table 3. Sample distribution of effective positions
Effective
Frequency Percentage Cumulative percentage
percentage
President 1 .5 .5 .5
General manager 1 .5 .5 1.1
Deputy General Manager 3 1.6 1.6 2.7
Director 3 1.6 1.6 4.3
Deputy Director 4 2.2 2.2 6.5
Associate Manager 2 1.1 1.1 7.6
Manager 6 3.3 3.3 10.9
Assistant manager 3 1.6 1.6 12.5
deputy manager 15 8.2 8.2 20.7
Section head 5 2.7 2.7 23.4
Senior Engineer 44 23.9 23.9 47.3
Engineer 93 50.5 50.5 97.8
Other 4 2.2 2.2 100.0
Sum 184 100.0 100.0
In terms of the distribution of the above titles, the majority of engineers are 50.5%, followed by
senior engineers are 23.9%, and at least the chairman and general manager are 0.5%.
4.1.4. Fields of work
Table 4. Distribution of samples in the field of work
Frequency Percentage Effective percentage Cumulative percentage
Technology R & D 37 20.1 20.1 20.1
Academic Research 3 1.6 1.6 21.7
Marketing 3 1.6 1.6 23.4
Industry analysis 3 1.6 1.6 25.0
Product planning 2 1.1 1.1 26.1
Policy implementation and
4 2.2 2.2 28.3
supervision
Production / Manufacturing 117 63.6 63.6 91.8
other 15 8.2 8.2 100.0
sum 184 100.0 100.0
In terms of the above-mentioned work areas, "production / manufacturing" accounts for 63.6% of
the majority, followed by "technology research and development" accounts for 20.1%, and at least
"product planning" accounts for 1.1%.
IJER – May - June 2020 102
available online @ www.ijeronline.comMing-Lang Wang, Kang-Wei Wang, Int. Jou Eco.& Res, 2020, V11 i3 (mj), 89 – 110 ISSN: 2229-6158
5. Years of experience in related industries
Table 5. Distribution of effective sample of seniority
Frequency Percentage Effective percentage Cumulative percentage
0~3 years 72 39.1 39.1 39.1
4~6 years 45 24.5 24.5 63.6
7~10 years 31 16.8 16.8 80.4
11~15 years 23 12.5 12.5 92.9
More than 16 years 13 7.1 7.1 100.0
sum 184 100.0 100.0
In terms of the seniority of the above-mentioned related industries, the highest number of seniority
in "0 to 3 years" accounted for 39.1%, followed by "4 to 6 years" accounted for 24.5%, at least for "more
than 16 years" accounted for 7.1%.
6. The company's capital composition (%)
Table 6. Distribution of effective capital samples
Frequency Percentage Effective percentage Cumulative percentage
Foreign investment accounts
1 .5 .5 .5
for more than half
Foreign investment accounts
74 40.2 40.2 40.8
for less than half
All Taiwanese 109 59.2 59.2 100.0
sum 184 100.0 100.0
In terms of capital composition of the above-mentioned companies, "all Taiwan-funded" accounts
for a maximum of 59.2%, followed by "less than half of foreign investment" accounts for 40.2%, and at
least "more than half of foreign investment accounts for 0.5%".
7. Registered capital
Table 7. Distribution of valid sample of capital registration
Effective Cumulative
Frequency Percentage
percentage percentage
30 million to 80 million 3 1.6 1.6 1.6
80 million to 200 million 2 1.1 1.1 2.7
200 million to 1 billion 24 13.0 13.0 15.8
1 billion to 3 billion 56 30.4 30.4 46.2
3 billion to 6 billion 83 45.1 45.1 91.3
6 billion to 10 billion 16 8.7 8.7 100.0
sum 184 100.0 100.0
According to the capital registration of the above-mentioned companies, "3 billion to 6 billion"
IJER – May - June 2020 103
available online @ www.ijeronline.comMing-Lang Wang, Kang-Wei Wang, Int. Jou Eco.& Res, 2020, V11 i3 (mj), 89 – 110 ISSN: 2229-6158
accounted for the most of 45.1%, followed by "1 billion to 3 billion" accounted for 30.4%, at least "80
million to 200 million" accounted for 1.1%.
8. The company's products
Table 8. Distribution of effective samples of product types
Response value
% Of observations
Number Percentage
Solar module 102 32.4% 55.4%
Solar conductive paste 29 9.2% 15.8%
Solar monocrystalline battery 101 32.1% 54.9%
Silicon chip 41 13.0% 22.3%
Solar Ingot / Block 19 6.0% 10.3%
Solar cell 8 2.5% 4.3%
other 15 4.8% 8.2%
total 315 100.0% 171.2%
It can be seen from the above results that the products produced by the solar energy company are
mainly "Solar Module" 32.4% and "Solar Monocrystalline Battery" 32.1%. Due to the relationship of
multiple choice questions, the sum of the percentage of observations is 171.2%, indicating that in a
multiple-choice question with a maximum of three answers, each person answered an average of 1.712
answers.
4.2. Reliability and validity verification
In order to discuss the interviewees' important issues on the solar industry and solar development,
this study designed a total of 20 items from expert interviews and secondary data. Through the initial test,
questionnaires are officially issued and collected, and then use SPSS software to analyze. Beside, this
study adopts Likert 5-Points Scale, the instrument was validated in advance through several personal
interviews with Solar Industry managers on site, scoring the subjective cognition an "1" for very
unimportant, and a "5" for very important. The questionnaire was issued between December 2019 and
February 2020, a total of 400 copies were distributed, and 184 valid questionnaires were found after
deducting the damaged and ones with incomplete answers. The effective recovery rate was 46%, and
then use SPSS 18.0 software to analyze and understand the prospects and visions of Taiwan's solar
industry. The following are the results of our analysis.
Table 9. KMO and Bartlett Test of Sphericity
Kaiser-Meyer-Olkin measure of sampling adequacy .697
Chi-Square Approximation Value 1139.275
Bartlett Test of Sphericity df 276
Significance .000
From the information obtained in Table 9 above, KMO=0.697、Bartlett Test of Sphericity is
1139.275,Significance=0.000,The results show that the data is suitable for factor analysis.
IJER – May - June 2020 104
available online @ www.ijeronline.comMing-Lang Wang, Kang-Wei Wang, Int. Jou Eco.& Res, 2020, V11 i3 (mj), 89 – 110 ISSN: 2229-6158
After passing the test, the principal components analysis in the factor analysis is continued to
extract the common factors. According to the principle that the eigenvalues is greater than 1 as the
number of common factors, a total of 5 main factors are selected, which can explain 60.084% of the total
variation. Then through the VARIMAX, the selected factors are rotated to make the representative
meaning of each factor more obvious and easier to explain. The results are shown in Table 10. (The
yellow part is the absolute value of the factor loadings is greater than 0.45)
Table 10. Comparison of factor loadings
Elements
Variables
1 2 3 4 5
Government intervention .736 .062 .279 -.029 .045
Consensus to promote energy transformation .753 .122 .021 .038 .126
Government Promotion .717 .177 .036 -.038 -.059
Popularization of solar panels on the roof .695 -.061 -.199 -.157 .052
Increase the purchase price of solar power .503 .057 -.107 -.278 .446
Media propaganda .495 .001 .063 .026 -.045
Erecting solar panels on the coast, seaside, etc. .386 .081 .027 -.601 .110
Attractive forward-looking approach .214 .583 .064 .364 -.096
Power generation network .057 .692 .018 .036 -.023
Increase the guaranteed years of solar power acquisition -.022 .598 -.089 .191 .450
Move to high energy efficiency, renewable energy supply, and
store in smart grid
-.097 .351 -.009 .457 -.013
Solar conversion efficiency needs to be improved -.095 .178 .128 .651 .141
Encourage local government to actively participate .213 .226 -.318 .584 -.068
Waste recycling .395 -.202 .731 .103 .016
Uniform waste disposal standards -.261 .298 .635 .087 .040
Establish a waste disposal center -.053 -.116 .451 .385 -.031
Improve solar waste resource recycling technology .041 .038 .733 -.114 .043
Try to reduce risks and consider the status of nuclear power -.085 .155 .045 .009 .645
24 hours power supply .299 -.319 .223 .050 .649
Government Promotion .188 .676 .075 .003 -.074
IJER – May - June 2020 105
available online @ www.ijeronline.comMing-Lang Wang, Kang-Wei Wang, Int. Jou Eco.& Res, 2020, V11 i3 (mj), 89 – 110 ISSN: 2229-6158
This study summarizes five factors and summarizes the detailed information as shown in the table
below:
Table 11. Results of principal component analysis
Total explained
Name of Factor Factor loading Eigenvalue
variance
1.Government promotion and intervention factors .753
Consensus to promote energy transformation .736
Government intervention .717
Government Promotion 3.926 16.359%
.695
Popularization of solar panels on the roof
Increase the purchase price of solar power .503
Media propaganda .495
2. Functional factors
Interwoven power generation network .692
Government Promotion .676 2.898 12.075%
Increase the guaranteed years of solar power
acquisition .598
Attractive forward-looking approach .583
3. Technical factors
Improve solar waste recycling .733
Improve solar waste recycling .731 2.152 8.965%
Uniform waste disposal standards .635
Establish a waste disposal center .451
4. Efficiency factors
The conversion efficiency of solar energy needs to be
improved .651
Encourage local government to actively participate .584 1.795 7.481%
Shift to high energy efficiency, renewable energy
supply .457
Erecting solar panels on the coast, seaside, etc. -.601
5. Risk factors
24 hours’ power supply .649
Try to reduce risks and consider the status of nuclear .645 1.135 4.728%
power
Increase the guaranteed years of solar power
acquisition .450
Factor 1 is mainly composed of six types of high-relevant variables, such as "government
intervention", "consensus to promote energy transformation", "government promotion", "Popularization
of solar panels on the roof ", "increasing the purchase price of solar power", and "media propaganda”,
the factor named as "Government Promotion and Intervention Factor". The factor loadings are between
0.495 and 0.753, the eigenvalue is 3.926, and the explained variance is 16.359%.
Factor 2 is mainly composed of four types of high-relevant variables, such as "Attractive
forward-looking approach", "Interweaving power generation network", "Increase the guaranteed years of
solar power acquisition", and "Government promotion”, named as "functional factor". The factor
loadings are between 0.583 and 0.692, the eigenvalue is 2.898, and the explained variance is 12.075%.
IJER – May - June 2020 106
available online @ www.ijeronline.comMing-Lang Wang, Kang-Wei Wang, Int. Jou Eco.& Res, 2020, V11 i3 (mj), 89 – 110 ISSN: 2229-6158
Factor 3 is mainly composed of four types of highly relevant variables, such as "recycling auxiliary
materials for recycling waste", "uniform waste disposal standards", "establishing a waste disposal
center", and "improving solar waste recycling". Due to the higher loading of the first two factors, this
factor is named as "technical factor". The factor loading between 0.451 and 0.733, the eigenvalue is
2.152, and the explainable variation is 8.965%.
Factor 4 is mainly composed of four types of highly relevant variables, such as “Establish solar
panels along the coast and seaside", "Turn to high energy efficiency, renewable energy supply", "Solar
conversion efficiency needs to be improved”, and "Encourage local governments to actively participate".
Due to the higher loading of the first two factors, this factor is named as “Efficiency Factor”. The factor
loading between 0.451 and 0.657, the eigenvalue is 1.795, and the explainable variation is 7.481%.
Factor 5 is mainly composed of three highly relevant variables, such as "Increase the guaranteed
years of solar power acquisition ", "Try to reduce risks and consider the status of nuclear power ", and
"available power supply in 24 hours". Due to the higher loading of the first two factors, the factor is
named as "risk factor". The factor loading is between 0.450 and 0.649, the eigenvalue is 1.135, and the
explainable variation is 4.728%.
5. Conclusion and suggestion
5.1. Conclusion
Through the compilation of the literature, this study has learned that as environmental awareness is
raised, all countries are eager to find alternative energy sources, so the development of the solar energy
industry has potential. Taiwan ’s current lack of raw materials and production equipment in the solar
industry is also limited by land restrictions. Under the constraints of production equipment, Taiwan
should develop various patents to avoid relying on imports to cause excessive production costs; under
the constraints of small land area and dense population, for Taiwan to make solar energy a pivotal
alternative, it must have new thinking and think about both. The space reuse method effectively
increases the proportion of solar power generation. The case of neighboring Asian countries that lack of
land (Japan, South Korea, Singapore, etc.) are currently constructing or have completed the MW-level
floating solar power plant case, which can provide reference for Taiwan.
According to the analysis of the above data, this study divides the key factors that affect the
prospects of Taiwan's solar energy industry at this stage into five constructs, namely the government
promotion and intervention construct, function construct, technology construct, efficiency construct, and
risk construct, as follows describe the importance of each aspect to the company and the department:
In the government promotion and intervention aspect, the research results show that the two
companies " DelSolar Co Ltd." and "ALFA ENERGY CORPORATION" have a significant difference
in this aspect compared with other companies, and are more important than other companies, the quality
control department pays more attention to this aspect than other departments.
IJER – May - June 2020 107
available online @ www.ijeronline.comMing-Lang Wang, Kang-Wei Wang, Int. Jou Eco.& Res, 2020, V11 i3 (mj), 89 – 110 ISSN: 2229-6158
In terms of functional aspects, the research results show that " GIGASTORAGE Corp." has a clear
difference in this aspect compared to other companies. In this aspect, the materials department pays
more attention than other departments.
In the technical aspect, the research results show that the company and the department have no
obvious significance in this aspect, of which "Giga Solar Materials Corp." is more important than other
companies, and the importance of the materials department is also higher than other departments.
In terms of efficiency, the results of the study show that "GIGASTORAGE Corp." is significantly
different from other companies in this aspect, and it is also more important than other companies. The
human resources department pays more attention than other departments.
In terms of risk, the research results show that "DANEN Technology Corp." is significantly
different from other companies and is more important than other companies. The material department
pays more attention than other departments.
5.2. Suggestion
5.2.1. The government needs to formulate perfect subsidies and incentives
Perfect subsidies and incentives are an important key to promote renewable energy, and also a policy
incentive for government and industry development. For the solar energy industry in Taiwan, government
policies, subsidy systems, regulations, etc. have a certain degree of influence on the industry. Therefore, it
is recommended to provide policies related to industrial development, and continue to cooperate with
industry players to expand end-user adoption and drive the expansion of the upstream and midstream.
5.2.2. Vertical integration and strategic alliance
Establish a complete industrial structure and value chain through domestic and foreign peers and
different industries. Because Taiwan ’s upstream raw materials must rely on imports in the solar industry
development structure, and the development of the solar industry must master the stable supply of
upstream raw materials in order to stabilize the solar industry development. Taiwan's main strength in
the global solar energy industry chain is the silicon chips and battery modules in the midstream. In terms
of downstream modules, although they can meet domestic needs, due to the small scale of module
factories, high costs, and weak global market competitiveness, mid- and downstream manufacturers
need to develop economies of scale among each other. At the same time, industry players need to
discuss strategies and methods to attract foreign industry investment to reduce the cost of raw materials
for the solar industry, and then make up for the deficiencies of the solar industry.
5.2.3. Improve photoelectric conversion efficiency and establish technology patents
Earth rotation and climate change factors make solar energy intermittent. Compared with traditional power
generation methods (power, water, wind, etc.), solar energy can only be used as auxiliary energy, Therefore, under
the environmental constraints, the development of solar photovoltaics must increase the conversion efficiency to
IJER – May - June 2020 108
available online @ www.ijeronline.comMing-Lang Wang, Kang-Wei Wang, Int. Jou Eco.& Res, 2020, V11 i3 (mj), 89 – 110 ISSN: 2229-6158
the maximum to supplement the peak power consumption; at the same time, establish solar storage technology to
ensure that the energy supply is not limited to environmental and climatic factors and affect stability. Taiwan has
great advantages in the development of the semiconductor and flat panel display industries, and Taiwan has
considerable potential for the development of the solar industry. Because the manufacturing involved in the solar
industry has many similarities with semiconductor manufacturing, it is easier to enter the solar field. However,
because Taiwan's solar cell template and system verification have not established international standards, they
cannot fully recognize each other internationally, which makes it extremely difficult to export products. Therefore,
to occupy a place in the international market, Taiwan technology patents must be established.
5.2.4. Formulate the most suitable development strategy to avoid market marginalization:
The external environment is changing rapidly. If you don’t keep up, you may be eliminated. However,
in addition to the government's efforts to strive for international space for industry, more medium- and
long-term development strategies and options are needed. In order to enhance competitiveness and expand
advantages, major manufacturers have gradually adopted vertical integration or strategic alliances in recent
years to respond to the fierce global competition. Therefore, this study suggests that on the existing basis,
the industry chooses suitable development strategies, integrates effective resources and solutions, and
strengthens cooperation between various supply chains to avoid being marginalized by the market in order
to enhance the competitiveness of Taiwan's solar industry.
REFERENCES
Ai-Ling Huang, Qing-Yan Yang, Wen-Xin Wang, Ji-Xian Huang, You-Da Lin, Her-Nian Xie, (2013),
“Discussion on Strengthening Policy Marketing Practices of Government Agencies - Take the
New Taipei City Government Tax Collection Office as an example to promote local tax online
reporting,” National Academy of Civil Service T&D Fashion, Vol.160, pp.1-15. [Accessed on
2020/03/29].
Austin Perea, (2017), Solar Market Insight Report 2017 Q4. Solar Energy Industries Association.
Bartlett, M. S., (1951). “An inverse matrix adjustment arising in discriminant analysis,” The Annals of
Mathematical Statistics, Vol. 22, pp.107-111.
Bureau of Energy, Ministry of Economic Affairs, (2015), “Taiwan's short, medium and long-term of
Solar Energy in Taiwan,” Energy Information Platform-Energy Analysis.
https://www.moea.gov.tw/MNS/dos/home/Home.aspx [Accessed on:2020/04/12]
Burns, John Edward, (2011), Comparative analysis of supporting solar policies in the USA: a study of
the potential effects of solar renewable energy certificates(SRECs) on residential photovoltaics,
National Chiao Tung University, Global MBA, unpublished master thesis, Hsinchu City.
Cheng-Cong Guo, (2015), “The Current Situation, Problems, Solutions or Suggestions for the
Development of Solar Energy in Taiwan,” Energy Information Platform” Chung-Hua Nuclear
Society.
Cheng-Qi Tsai, (2017), The Japanese solar bubble collapsed! Businesses have successively retreated,
and the number of bankruptcies has soared to a new high, MoneyDJ,
https://tw.money.yahoo.com/ [Accessed on 2020/03/25]
Chia-Sheng Wang, (2011), Project Evaluation: The Feasibility of Promoting Kaohsiung Become a Solar
City, National University of Kaohsiung IMEBA, unpublished master thesis, Kaohsiung City.
Dan Martin, (2009), “Feed-in Tariff, FIT”, Driving the Growth of the PV Industry.
http://www1.semi.org/zh/MarketInfo/ctr_031895 [Accessed on 2020/01/28]
IJER – May - June 2020 109
available online @ www.ijeronline.comYou can also read


