A Comparative Analysis based approach for Bitcoin Price Forecasting
←
→
Page content transcription
If your browser does not render page correctly, please read the page content below
Published by : International Journal of Engineering Research & Technology (IJERT)
http://www.ijert.org ISSN: 2278-0181
 Vol. 10 Issue 04, April-2021

 A Comparative Analysis based approach for
 Bitcoin Price Forecasting
 Yash Wadalkar, Yellamraju V H Sai Tarun, Prof. Reena Sonkusare
 Jaiesh Singhal Head of Department
 UG Student Dept. of Electronics and Telecommunication
 Dept. of Electronics and Telecommunication Sardar Patel Institute of Technology
 Sardar Patel Institute of Technology Mumbai, India
 Mumbai, India

 Abstract— Bitcoin, one of the most famous and high- investors yield on this investment is significantly higher
in- demand cryptocurrencies, is a type of digital asset that than that of traditional banking or market schemes.
is extremely difficult to track and make predictions upon. Moreover, since there is no government intervention, the
In addition, Bitcoin price does not correlate with market- price is solely controlled by the public, for the public.
movements, therefore, predicting its price action and its
locus is an ordeal. In this paper, we have followed a
 Generalising, the prices of cryptocurrencies are not
comparative analysis approach, wherein we are using four driven by the market therefore technical analysis becomes
different models to predict the trend of BTC Time series important in determining the price range of bitcoin over a
data. The results justify that the models have achieved period. Since technical analysis does not depend on external
accurate forecasting trends. During the period of 16th to economic data, solely past price patterns are used to predict
31st December 2020, Bitcoin prices experienced the price of Bitcoin [4].
considerably high swings, due to the increased demand for In recent researches, LSTM and ARIMA
it. In quantitative terms, the prices experienced fluctuations models were used to forecast prices of Indian stocks for
to the tune of 8000 USD. Despite these enormous price a period of 5 months. LSTM showed better results
changes, we were able to achieve a model, that helped us
attain a Mean Absolute Error (MAE) of 153.55 USD and
 compared to ARIMA [5]. Another research where
Mean Square Error (MSE) of 43231.80 USD. Conventional Gradient Boost Tree Model was used to capture Twitter
Bitcoin price predicting researches follow a single to two data and public sentiments for a tenure of 3.5 weeks,
model approach. However, for a highly volatile asset like analysed each tweet, for which over 50 percent
Bitcoin, making long-term predictions and generalizing accuracy was achieved [6]. A study carried out by Wint
them based on limited number of models results in low forecasted the closing price of the Myanmar Stock Price
accuracy outputs. This gap has been bridged in our Index (MYANPIX) using ARIMA and Facebook
research, we have worked with different models, as well as Prophet. For all three periods (daily, weekly and
fragmented the time intervals into smaller portions, post monthly) prophet, having less error rate, has
which the prediction was made for only 2 days. Using this
approach, we attained results with least error rates. The
 outperformed ARIMA [7].
results obtained clearly show that ARIMA is the best model Understanding the recent developments and with
for predicting the future trends for BTC time series data. It reference to researches published in this domain, we have
takes into account the different types of decompositions like carried out condensation of various approaches, in our
Regular Trend, Sessional and Residual Trend making the research, which were followed to make predictions for equity
model give the best results. markets and other cryptocurrencies. A comparative analysis
 of four models has been incorporated to furnish the best
 Keywords—Ccryptocurrency; blockchain; bitcoin; Time- possible prediction model, wherein each model individually,
 series Analysis; Facebook Prophet; LSTM; ARIMA; contributes to the increased efficiency of the entire
 XGBoost
 mechanism.
 I. INTRODUCTION
 Technology has been disrupting the way humans II. METHODOLOGY
 live, work and even transact. Globally, economies and The below drawn flowgraph shows our approach
 financial institutions have been going digital at an towards building the models and comparing them based on
 unprecedentedly fast pace [1]. The advent of Fin-Tech has various performance metrics.
 left the conventional financial system archaic. One of the
 most recent developments in this space is the advent of
 Cryptocurrencies, more specifically, the most talked about,
 Bitcoin. Bitcoin, one of the original and first cryptocurrencies,
 currently has a market capitalization north of around 600
 billion USD, which would only grow steeply in the
 forthcoming years.
 This digital currency derives its popularity from two
 features: its decentralized nature [2] and the extraordinary
 volatility [3] that this asset exhibits. The returns that the
 Fig 1. Block Diagram of the proposed approach

IJERTV10IS040313 www.ijert.org 650
 (This work is licensed under a Creative Commons Attribution 4.0 International License.)
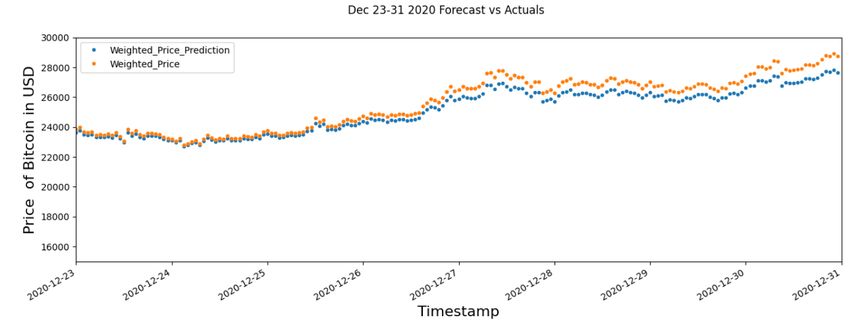
Published by : International Journal of Engineering Research & Technology (IJERT)
http://www.ijert.org ISSN: 2278-0181
 Vol. 10 Issue 04, April-2021

 First, we choose the data set on which the different The Prophet employs a three part time series model with
models are to trained. The dataset used in our case is the trend, seasonality, and holidays as its components. The
Bitcoin Historical Dataset. It has the data between the equation representing the model is given by:
period of January 1st 2012 to December 31st 2020, with
the Open High Low Close (OHLC) prices of Bitcoin. ( ) = ( ) + ( ) + ℎ( ) + (1)
Additionally, data of the volume of Bitcoin transacted, as
 In Equation (1), g(t) denotes logistic growth, s(t) denotes
well as the corresponding currency’s volume was taken
 periodic shifts, h(t) denotes effect due to holiday, and Et
into consideration [8].
 takes into account any missed irregularities by the model
 This is followed by filtering the time series data by
 [7][9].
data pre-processing, followed by dividing the dataset into
Test and Train data. The four models: LSTM, XGBoost,
 D. Auto Regressive Integrated Moving Average (ARIMA):
Prophet and ARIMA are trained on the training data and then
 This Model is one of the variants of the most used
the comparison of the results is made on the test data.
 Autoregressive Moving Average (ARMA). This model
 The aforesaid models have been described in detail
 is designed for time series data analysis, processing, and
in following section, which justifies their suitability for our
 forecasting. Each ARIMA Model is denoted by the
project.
 letters p, d, and q, where p denotes how many numbers
 of lagging observations does the model have, d denotes
 III. MACHINE LEARING MODELS the number of times difference between the raw
A. Long Short Term Memory (LSTM): observations are observed, and finally q is the size of the
 LSTM is a type of Recurrent Neural Network moving average (MA) window. Whereas for Seasonal
(RNN) that is used in the field of deep learning. It's used in data, ARIMA is denoted with a similar expression of the
a variety of fields, including machine translation and non-seasonal data with 4 additional parameters P, D, Q
speech recognition, and it's also good at classifying, and m: where m denotes the count of the periods each
processing, and forecasting time-series data [10]. For season has, P refers to the autoregressive part of the
building the LSTM model, the first step contains the model, D represents the differencing term and Q
filtering of the information which is not required in the represents the Moving average (MA) part of the ARIMA
cell states and is thrown away. Then, information model [12][13].
which is to be processed is stored in the cell states. This IV. RESULT ANALYSIS
is followed by a Sigmoid layer which acts as a filter for Based on the different methods/models used, the
what information is to be taken in input layer. And models were trained on the Historical data of Bitcoin Prices
then, based on these filtered inputs going through the from period from 16th December 2020 to 29th December
sigmoid layer and the series of tanh functions the final 2020 and the results are compared on the prediction made by
output is obtained. all the models from 29th December 2020 to 31st December
 2020. This specific period experienced a steep increase of
B. XGBoost Classifier: 8000 USD approx. in the Bitcoin Prices. So, the extreme
 XGBoost is a gradient boosting algorithm that uses volatility of Bitcoin Prices is also taken into consideration
 a decision tree based ensemble Machine Learning which helps in identification of the best model in the worst
 algorithm. It's made to be extremely powerful, adaptable, circumstances.
 and portable. XGBoost is the best option for The two main performance metrics, namely Mean
 structured/tabular data ranging from small to medium sizes Average Error (MAE) and Mean Square Error (MSE),
 and also decision tree based problems because it offers computed for each model [14]. The results are tabulated in
 parallel tree boosting. When adding new models, it uses Table 1.
 the gradient descent algorithm to reduce the loss. A detailed explanation of these results has been
 Therefore, it is known as Gradient boosting. XGBoost provided below. On the basis of values obtained in Table 1,
 basically aims to minimize the regularized objective we have compared each of the model's performance with the
 function (L1 and L2). This is accomplished by integrating other prediction models, alongside justifying the reason for
 the uncertainty through the penalty term with the convex choosing or rejecting the particular model for the fulfilment
 loss function dependent on the discrepancy between the of our purpose.
 expected and goal outputs. After each phase of the training
 process, new trees are introduced that project the A. Long Short-Term Memory (LSTM):
 residuals/errors of the prior trees. The final prediction is Figure 2 depicts the LSTM Model's forecast
 made by combining these. vs. Actual Prices from the time period of December
 23rd to December 31st.The LSTM is trained via sigmoid
C. Facebook Prophet: activation function along with Adam optimizer for 100
 Prophet is a model for forecasting time series data epochs.
 that was created by Facebook. Non-linear patterns align The Error between predictions and actual is
 with annual, weekly, and regular seasonality in the compared via Mean Squared Error (MSE) and Mean
 Generalized Additive Model (GAM). It is extremely Average Error (MAE). The MSE for LSTM is 114466.39
 effective at predicting highly seasonal data for any kind of and MAE is 264.28 USD, which is not that high compared
 pattern, whether the data is highly seasonal or missing. to other models but is not the best model for our use case.

IJERTV10IS040313 www.ijert.org 651
 (This work is licensed under a Creative Commons Attribution 4.0 International License.)
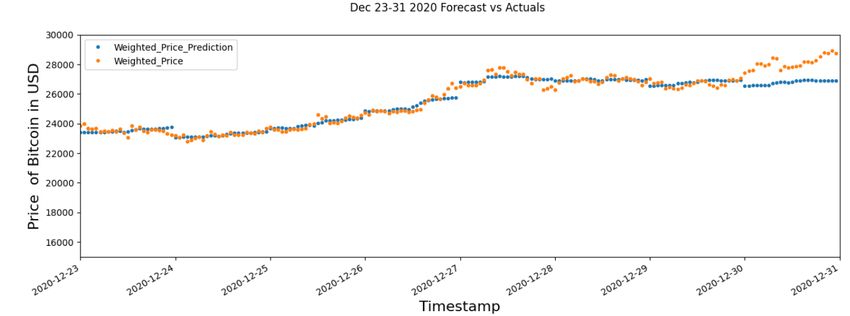
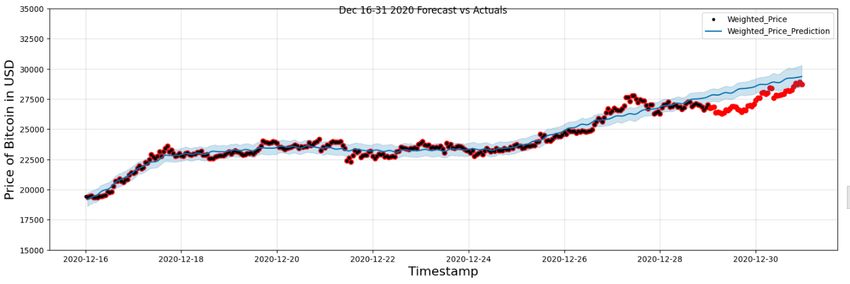
Published by : International Journal of Engineering Research & Technology (IJERT)
http://www.ijert.org ISSN: 2278-0181
 Vol. 10 Issue 04, April-2021

 273.17, which is less accurate compared to LSTM
B. XGBoost: Model. Thus, XGBoost is not the most accurate model for
 Figure 3 depicts the plot of XGBoost Forecast our use case.
vs. Actual Prices from December 23rd to December
31st. The MSE for XGBoost is 190613.16 and MAE is

 Fig 2. Forecast vs Actual for LSTM Model during Dec 23-31

 Fig 3. Forecast vs Actual for XGBoost Model during Dec 23-31

C. Facebook Prophet: model in our case.
 Figure 4 depicts the plot of Facebook Prophet D. Auto Regressive Integrated Moving Average(ARIMA):
Forecast vs. Actual Prices from December 23rd to The ARIMA Forecast vs Actual Prices for the
December 31st. The MSE for Facebook Prophet is period between December 23rd to December 31st is
334612.50 and MAE is 419.39 USD, which is less accurate shown in Figure 5. The MSE for ARIMA is 43231.80 and
compared to both LSTM and XGBoost. This shows that MAE is 153.55 USD, which is the least compared to all of
Facebook Prophet is not as flexible for volatile data the other models. Therefore, ARIMA is the best model for
prediction. Therefore, Facebook Prophet is also not the best this particular use case with the most accuracy.

IJERTV10IS040313 www.ijert.org 652
 (This work is licensed under a Creative Commons Attribution 4.0 International License.)
Published by : International Journal of Engineering Research & Technology (IJERT)
http://www.ijert.org ISSN: 2278-0181
 Vol. 10 Issue 04, April-2021

 Fig 4. Forecast vs Actual for Facebook Prophet during Dec 16-31

 Fig 5. Forecast vs Actual for ARIMA Model during Dec 16-31

TABLE I. Comparison of MSEs and MAEs in USD of different Models aforementioned objective. The performance parameters taken
 into consideration for our purpose were Mean Absolute Error
 Model MSE (in USD) MAE (in USD)
 LSTM 118736.68 281.84
 (MAE) and Mean Squared Error (MSE). The results thus
 XGBoost 190613.16 273.17 obtained clearly indicate that ARIMA with MAE of 153.55
 Prophet 334612.50 419.39 USD and MSE of 43231.80 USD emerges as the best model
 ARIMA 43231.80 153.55 among the other three. [Table 1]. The better performance of
 ARIMA compared to others can be attributed to the fact that
 V. CONCLUSION it takes into account the different types of decompositions
 This paper presents an enhanced, inclusive solution like Regular Trend, Sessional and Residual Trend. Thus, even
 for carrying out the time-series analysis for BTC dataset. The whenthe deviation of prices is higher than normal the
 BTC dataset contains the OHLC (Open High Low Close) data ARIMA Model is very accurate while making predictions for
 between the period of Jan 1st 2012 and Dec 31st 2020. Due both short as well as long term prices.
 to the extreme volatility in the price value, we have chosen to In further advancements to this study, capturing
 predict the prices from the period of 29th Dec 2020 to 31st governing factors would result in better accuracy of
 Dec 2020. Four different models, namely LSTM, ARIMA, prediction. For example, obtaining data on the trending page
 XGBoost and Facebook Prophet were used for achieving the of Twitter would provide us with insights about public

IJERTV10IS040313 www.ijert.org 653
 (This work is licensed under a Creative Commons Attribution 4.0 International License.)
Published by : International Journal of Engineering Research & Technology (IJERT)
http://www.ijert.org ISSN: 2278-0181
 Vol. 10 Issue 04, April-2021

feelings regarding Bitcoin, which would directly impact the
demand for it, in turn driving its price globally. Analyzing the
posts on the Reddit platform would also help similarly, as it
would help us to dive deeper and capture market sentiments
of Bitcoin investors and the general public [6]. These
insights can be reinforced into the training process of
models, which could further increase efficiency and
accuracy.

 REFERENCES
[1] M. Mudassir, S. Bennbaia, D. Unal and M. Hammoudeh, “Time-
 series forecasting of Bitcoin prices using high-dimensional features:
 a machine learning approach,” Neural Computing & Applications,
 2020
[2] S. Nakamoto, “Bitcoin: A peer-to-peer electronic cash system,” 2008
[3] D. G. Baur and T. Dimpfl, “Realized bitcoin volatility,” SSRN
 Electronic Journal, 2017
[4] Y.S. Abu-Mostafa and A.F. Atiya, “Introduction to financial
 forecasting,” Applied Intelligence, 1996, vol. 6, no. 3, pp. 205-213
[5] S. Selvin, R. Vinayakumar, E. A. Gopalakrishnan, V. K. Menon and
 K.P. Soman, “Stock price prediction using LSTM, RNN and CNN-
 sliding window model,” 2017 International Conference on Advances
 in Computing, Communications and Informatics (ICACCI), Udupi,
 India, 2017, pp. 1643- 1647
[6] T.R. Li, A.S. Cham Rajnagar, X.R. Fong, N.R. Rizik and F. Fu,
 “Sentiment-Based Prediction of Alternative Cryptocurrency Price
 Fluctuations Using Gradient Boosting Tree Model,” Frontiers in
 Physics, 2019, vol. 7, no. 98, pp. 1-8
[7] W.N. Chan, “Time Series Data Mining: Comparative Study of
 ARIMA and Prophet Methods for Forecasting Closing Prices of
 Myanmar Stock Ex- change,” Journal of Computer Applications and
 Research, 2020, vol. 1, no. 1, pp. 75-80
[8] Bitcoin Historical Dataset, Bitstamp Exchange, Feb.2021. [Online].
 Available: https://bitcoincharts.com/charts/bitstampUSD
[9] S.J. Taylor and B. Letham, “Forecasting at scale,” The American
 Statistician, 2018, vol. 72, no. 1, pp. 37-45
[10] W. Fang, P. Lan, W. Lin, H. Chang, H. Chang and Y. Wang,
 “Combine Facebook Prophet and LSTM with BPNN Forecasting
 financial markets: the Morgan Taiwan Index,” 2019 Inter-national
 Symposium on Intelligent Signal Processing and Communication
 Systems (ISPACS), Taipei, Taiwan, 2019, pp. 1-2
[11] W. Zhang, P. Wang, X. Li and D. Shen, “Quantifying the cross-
 correlations between online searches and Bitcoin market,” Physica
 A: Statistical Mechanics and its Applications, 2018, vol. 509, pp.
 657-672
[12] G.P. Zhang, “Time series forecasting using a hybrid ARIMA and
 neural network model,” Neurocomputing, 2003, vol. 50, pp. 159-175
[13] L. Wang, H. Zou, J. Su, L. Li and S. Chaudhry, “An ARIMA‐ANN
 Hybrid Model for Time Series Forecasting,” Systems Research and
 Behavioral Science, 2013, vol. 30, pp. 244-259
[14] C.J. Willmott and K. Matsuura, “Advantages of the mean absolute
 error (MAE) over the root mean square error (RMSE) in assessing
 average model,” Climate Research, 2005, vol. 30, no. 1, pp. 79-82
[15] J. Rebane, I. Karlsson, P. Papapetrou, and S. Denic, “Seq2Seq RNNs
 and ARIMA models for Cryptocurrency Prediction: A Comparative
 Study,” in Proceedings of SIGKDD Workshop on Fintech (SIGKDD
 Fintech’18), 2018.
[16] M. Nakano, A. Takahashi and S. Takahashi, “Bitcoin technical
 trading with artificial neural network,” Physica A: Statistical
 Mechanics and its Applications, 2018, vol. 510, pp. 587-609
[17] T. Shintate and L. Pichl, “Trend Prediction Classification for High
 Frequency Bitcoin Time Series with Deep Learning,” Journal of Risk
 and Financial Management, Jan. 2019, vol.12, no.1, p.17

IJERTV10IS040313 www.ijert.org 654
 (This work is licensed under a Creative Commons Attribution 4.0 International License.)
You can also read