A de novo genome assembly and annotation of the southern flying squirrel (Glaucomys volans)
←
→
Page content transcription
If your browser does not render page correctly, please read the page content below
2
                                                                                                                                    G3, 2022, 12(1), jkab373
                                                                                                                 https://doi.org/10.1093/g3journal/jkab373
                                                                                                        Advance Access Publication Date: 12 November 2021
                                                                                                                                             Genome Report

A de novo genome assembly and annotation of the
southern flying squirrel (Glaucomys volans)
Jesse F. Wolf       ,1,2,* Jeff Bowman         ,1,2 Sonesinh Keobouasone,3 Rebecca S. Taylor,1 and Paul J. Wilson1
1
  Biology Department, Trent University, Peterborough, ON K9J 7B8, Canada

                                                                                                                                                               Downloaded from https://academic.oup.com/g3journal/article/12/1/jkab373/6426101 by guest on 22 January 2022
2
  Ontario Ministry of Northern Development, Mines, Natural Resources and Forestry, Wildlife Research and Monitoring Section, Trent University, Peterborough,
  ON K9J 7B8, Canada
3
  Landscape Science and Technology Division, Environment and Climate Change Canada, Ottawa, ON K1S 5R1, Canada

*Corresponding author: Ontario Ministry of Northern Development, Mines, Natural Resources and Forestry, Wildlife Research and Monitoring Section,
Trent University, 1600 West Bank Drive, Peterborough, ON K9J 7B8, Canada. Email: jessewolf@trentu.ca

Abstract
Northern (Glaucomys sabrinus) and southern (Glaucomys volans) flying squirrels are widespread species distributed across North America.
Northern flying squirrels are common inhabitants of the boreal forest, also occurring in coniferous forest remnants farther south, whereas the
southern flying squirrel range is centered in eastern temperate woodlands. These two flying squirrel species exhibit a hybrid zone across a latitu-
dinal gradient in an area of recent secondary contact. Glaucomys hybrid offspring are viable and can successfully backcross with either parental
species, however, the fitness implications of such events are currently unknown. Some populations of G. sabrinus are endangered, and thus, in-
terspecific hybridization is a key conservation concern in flying squirrels. To provide a resource for future studies to evaluate hybridization and
possible introgression, we sequenced and assembled a de novo long-read genome from a G. volans individual sampled in southern Ontario,
Canada, while four short-read genomes (two G. sabrinus and two G. volans, all from Ontario) were resequenced on Illumina platforms. The final
genome assembly consisted of approximately 2.40 Gb with a scaffold N50 of 455.26 Kb. Benchmarking Universal Single-Copy Orthologs recon-
structed 3,742 (91.2%) complete mammalian genes and genome annotation using RNA-Seq identified the locations of 19,124 protein-coding
genes. The four short-read individuals were aligned to our reference genome to investigate the demographic history of the two species. A prin-
cipal component analysis clearly separated resequenced individuals, while inferring population size history using the Pairwise Sequentially
Markovian Coalescent model noted an approximate species split 1 million years ago, and a single, possibly recently introgressed individual.

Keywords: Northern flying squirrel; Southern flying squirrel; Glaucomys volans; Glaucomys sabrinus; hybrid zone; introgression; compar-
ative genomics

Introduction                                                                       hybridization (Garroway et al. 2010; Chunco 2014). Hybridization
                                                                                   can be an evolutionary dead end, or it can lead to adaptive intro-
High-throughput sequencing studies on hybrid zones of wild
                                                                                   gression (Arnold and Martin 2009; Abbott et al. 2013).
non-model species have revealed traits associated with diver-
                                                                                   Introgression can result in the merging of hybridizing forms, rein-
gence in sympatry and allopatry (Scordato et al. 2017), patterns of
                                                                                   forcement of reproductive barriers through selection for assorta-
introgression that differ between populations (Nolte et al. 2009),
and genes associated with reproductive isolation (Teeter et al.                    tive mating, and a non-neutral shift in fitness among
2008). Whole-genome sequencing provides insight into the evolu-                    introgressed individuals. In some instances, this enables the ex-
tionary process of hybridization and adaptive introgression, how-                  pansion of the introgressed species into a novel habitat (Arnold
ever, demonstrating the adaptive or fitness values of introgressed                 1992). Further complicating this, adaptive introgression com-
genomic regions remains an area of difficulty (Taylor and Larson                   bined with climate change can weaken reproductive isolation
2019). Studies of this kind benefit from a reference genome as a                   (Owens and Samuk 2020). In its extreme form, hybridization can
basis for identifying genomic regions of interest, and against                     drive extinction through introgression (Rhymer and Simberloff
which it is possible to evaluate potential hybrids and introgressed                1996).
individuals (Payseur and Rieseberg 2016).                                             Climate-driven range expansions have been noted in mam-
   Hybridization and introgression can occur between closely re-                   mals, insects, and fish (Moritz et al. 2008; Garroway et al. 2010;
lated species brought into secondary contact (Chown et al. 2015).                  Muhlfeld et al. 2014; Scriber 2014), among other taxa. Instances of
An increase in global surface temperatures has led to range shifts                 hybridization in wild ecosystems can be exacerbated by climate
among a variety of taxa on a global scale (Chen et al. 2011) and in-               change because of increased secondary contact, where barriers
creasing secondary contact between closely related species                         to interspecific reproduction are reduced or removed altogether
(Krosby et al. 2015), leading to increased opportunities for                       (Chunco 2014). Without such barriers, species that were

Received: June 08, 2021. Accepted: October 19, 2021
C The Author(s) 2021. Published by Oxford University Press on behalf of Genetics Society of America.
V
This is an Open Access article distributed under the terms of the Creative Commons Attribution License (https://creativecommons.org/licenses/by/4.0/), which
permits unrestricted reuse, distribution, and reproduction in any medium, provided the original work is properly cited.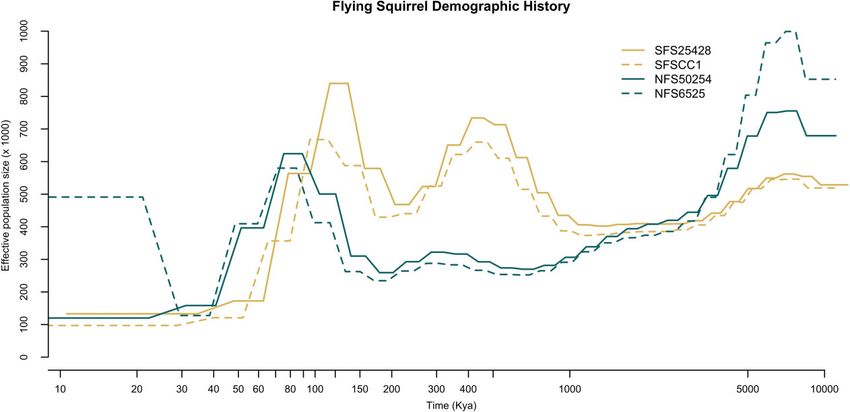
2 | G3, 2022, Vol. 12, No. 1
previously allopatric might interbreed, possibly leading to genetic tissue samples were extracted using a phenol-chloroform extrac-
admixture and outbreeding depression or heterosis (Barton 2001; tion. The extracted DNA was run on a 1.5% agarose gel and Qubit
Rius and Darling 2014). fluorometer using the High Sensitivity Assay Kit to ensure we had
As climate-mediated range expansion has been shown to in- sufficient DNA. The DNA extractions were also run on a
crease distributional overlap between related species (Chunco Nanodrop ND-8000 spectrophotometer to test purity. The DNA
2014), climate change will therefore likely drive interspecific hy- was normalized to 20 ng/ml at a final volume of 50 ml.
bridization between many taxa. For example, studies in North
America have noted hybrid zones across a latitudinal gradient De novo genome assembly
between southern (Glaucomys volans) and northern (Glaucomys Southern flying squirrel libraries from individual SFS_CC1 were pre-
sabrinus) flying squirrels (Garroway et al. 2010; Rogic et al. 2016). pared and paired-end sequenced on 1 lane on an Illumina HiSeq X
Interspecific hybridization is a key conservation concern for these to generate 150 base pair (bp) paired-end reads. Sequencing was con-
flying squirrel species, as population declines among northern ducted at The Centre for Applied Genomics (Next Generation
flying squirrels have been noted in some areas of the United Sequencing Facility, SickKids Hospital, Toronto, ON, Canada). The
Downloaded from https://academic.oup.com/g3journal/article/12/1/jkab373/6426101 by guest on 22 January 2022
States, where some populations are endangered (Wood et al. sequence reads from each sample were provided in a FASTQ file for-
2016). The potential for introgressive hybridization and the sub- mat. 10X Genomics long read Chromium sequencing was used to
sequent ecological and fitness consequences necessitates a holis- generate linked reads. The estimated genome size was thought to be
tic assessment of species biology in the Glaucomys hybrid zone. similar to that of the eastern grey squirrel (Sciurus carolinensis) ge-
The hybrid zone can be a valuable study system to facilitate the nome (2.82 Gb; Mead et al. 2020). We used FastQC (version 0.11.9;
assessment of interspecific hybridization, the potential for rein- Andrews 2010) to perform simple quality control checks on raw se-
forcement of reproductive barriers, and the associated ecological quence data to confirm the quality of the trimmed sequence reads.
conclusions in a wild, in vivo system. Long reads were assembled using Supernova as this assembler uses
Low hybrid fitness can also lead to increased divergence be- 10X linked-reads to produce phased assemblies of homologous chro-
tween species through reinforcement. Glaucomys hybrid offspring mosomes over multi-megabase ranges (Weisenfeld et al. 2018). The
are viable and can successfully backcross with either parental FASTA file representing the assembly was generated using the pseu-
species (Garroway et al. 2010), however, the fitness implications dohap style output. Assembly statistics were generated using BBMap
among hybrid or introgressed individuals is unknown. The pur- 38.90 (Bushnell et al. 2017). We used BUSCO v 3.1.0 (Benchmarking
pose of our study was to generate a de novo reference genome for Universal Single-Copy Orthologs; Waterhouse et al. 2018) and the
Glaucomys as a basis for identifying genomic regions of interest mammalia odb9 dataset to reconstruct 4,104 conserved mammalian
and to aid in evaluation of potential hybrids and introgressed genes to assess genome completeness.
individuals in future research. We annotated the reference ge-
nome using our already assembled and annotated flying squirrel Resequenced genome assemblies
transcriptome (Brown et al., 2021). Subsequently, using short Northern and southern flying squirrel libraries were prepared
reads from four individuals, two northern and two southern fly- and paired-end sequenced across eight lanes on an Illumina
ing squirrels, we assembled re-sequenced high coverage genomes HiSeq X to generate 150 bp paired-end reads. Sequencing was
by aligning to the reference genome for a comparative analysis conducted at The Centre for Applied Genomics (Next Generation
and demographic history reconstruction. Sequencing Facility, SickKids Hospital, Toronto, ON, Canada).
Forward and reverse reads were concatenated across eight lanes.
FastQC was run as above to determine forward and reverse read
Materials and methods quality and inform subsequent trimming parameters. We
Sample preparation trimmed the adapters and low-quality bases from the reads with
We isolated brain tissue from two adult G. volans and two adult G. Trimmomatic v0.39 and parameter specifications as follows:
sabrinus for sequencing. Approximately 1.0 g of frozen brain tis- Illumina adapters were removed, leading and trailing low quality
sue was removed from the hindbrain of each individual and im- or N bases were removed (below quality 3), reads were scanned
mediately stored in RNAlater-ICE (see Brown et al., 2021 for with a 4-base sliding window and cut when the average per qual-
additional details). Glaucomys sabrinus individuals were collected ity base drops below 15, and reads were dropped that were less
from near Kawartha Highlands Signature Site Park (Northern than 36 bases long after the previous step (Bolger et al. 2014). To
Flying Squirrel 6525; NFS_6525, female; 44.689 N, 78.335 W) and avoid any potential contamination of the genome sequence with
in Algonquin Provincial Park, ON, Canada (Northern Flying viral or bacterial sequences, we screened the trimmed reads with
Squirrel 50254; NFS_50254, male; 45.583 N, 78.466 W), and G. vol- Kraken2 (Wood et al., 2019) using the full standard database.
ans individuals were sampled near Sherborne Lake (Southern Reads from four individuals, including the individual used for
Flying Squirrel 25428; SFS_25428, male; 45.179 N, 78.840 W) and the de novo assembly, (NFS_6525, NFS_50254, SFS_25428, and
Clear Creek, Ontario, Canada (Southern Flying Squirrel CC1; SFS_CC1) were aligned to the synthetic linked-read reference ge-
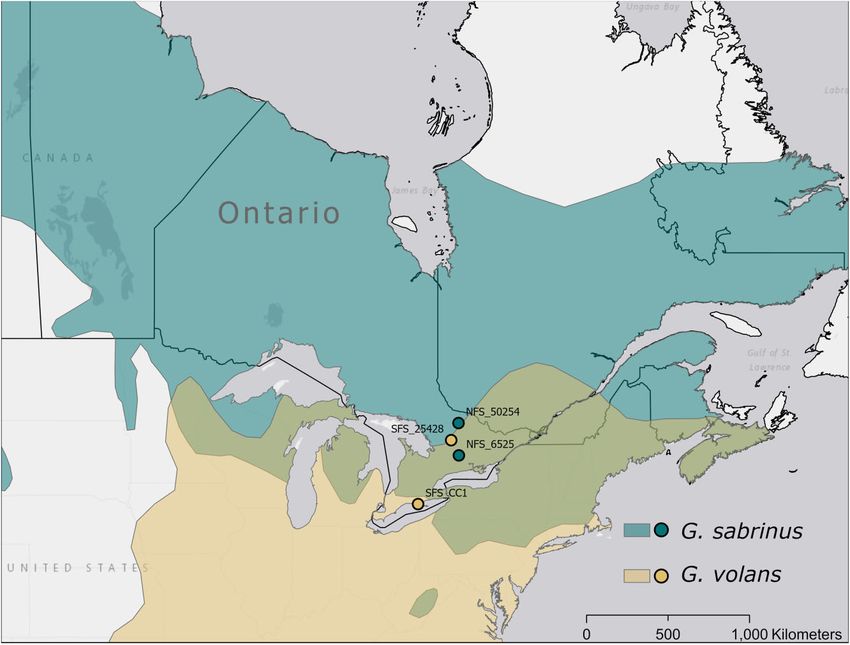
SFS_CC1, female; 42.523 N, 81.628 W; Figure 1). Algonquin nome using Bowtie2 2.2.4 (Langmead and Salzberg 2012), and the
Provincial Park (NFS_50254) was outside the northern edge of the SAM file was converted to a BAM file using Samtools 1.7 (Li et al.
hybrid zone, and Clear Creek (SFS_CC1) was outside the range of 2009). We removed poorly mapped reads via skipping alignments
G. sabrinus and not an area of sympatry. The sites were all ma- with MAPQ values smaller than 20 using Samtools 1.7. We re-
ture, closed canopy forests with a mixture of temperate decidu- moved duplicate reads and added correct read group information
ous trees such as sugar maple (Acer saccharum), red oak (Quercus to each BAM file using Picard 2.18.27 (http://broadinstitute.
rubra), and American beech (Fagus grandifolia), and coniferous github.io/picard/). We then clipped overlapping regions using
trees such as white pine (Pinus strobus) in uplands or white spruce clipOverlap from bamUtil 1.0.1.4 (Jun et al. 2015) and sorted the
(Picea glauca) and balsam fir (Abies balsamea) in riparian areas (see BAM file using Samtools 1.7 and built an index using Picard. All
Bowman et al. 2005 for more details). All four specimens were BAM files were checked using FastQC 0.11.9 (Andrews 2010), and
morphologically identified to their parental species. Squirrel we calculated the mean depth of coverage for each BAM file using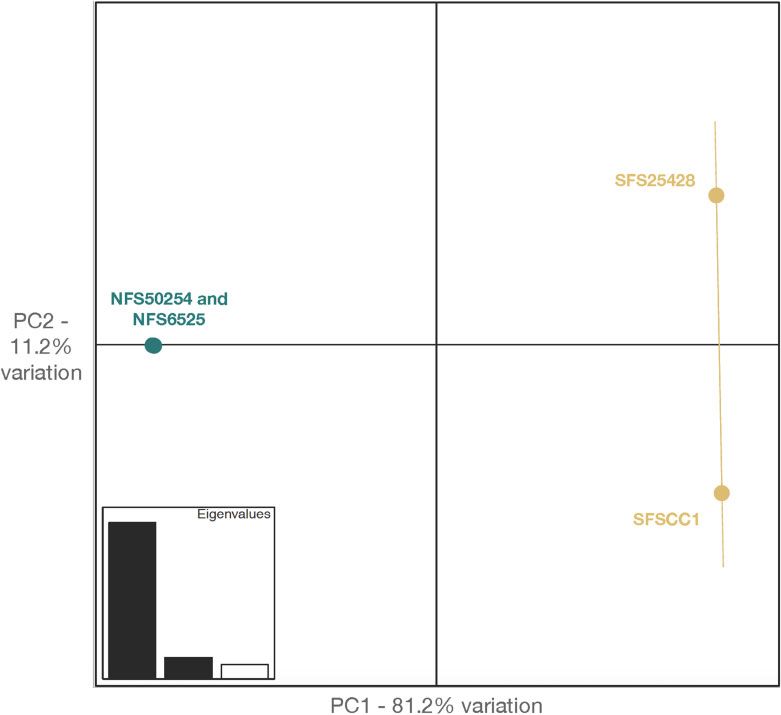
J. F. Wolf et al.   |   3

                                                                                                                                                                  Downloaded from https://academic.oup.com/g3journal/article/12/1/jkab373/6426101 by guest on 22 January 2022
Figure 1 Range of northern (Glaucomys sabrinus) and southern (Glaucomys volans) flying squirrels as delineated by IUCN (Cassola 2016a, 2016b), overlaid with
sampling locations. The geographic ranges are represented in the same colors as samples, while the hybrid zone is represented in olive. Both the
northernmost G. sabrinus sample from Algonquin Provincial Park, Ontario, and the southernmost G. volans sample from Clear Creek, Ontario, were located
outside of the hybrid zone. The southernmost G. volans sample (SFS_CC1) was used for de novo assembly.

Samtools. We used Haplotype Caller in gatk 3.8 (Mckenna et al.                   missing data (using the missing-indv command) for each individ-
2010) to call variants and produce a variant call format (VCF) file              ual in the final VCF file of 2 northern and 2 southern flying squir-
for each flying squirrel. Individual VCF files were combined using               rels using VCFtools.
the Combine GVCFs function, and then, we performed joint geno-
typing using Genotype GVCFs, both in GATK, to produce a VCF                      Annotation
file with both northern and southern flying squirrels. We did                    We identified and classified the repeat regions of the assembled
some additional filtering on the combined VCF files to ensure                    genome using RepeatMasker v. 4.1.0 (Smit et al. 2013). We config-
quality. We used VCFtools 0.1.16 (Danecek et al. 2011) to do two                 ured RepeatMasker with the RMBlast v. 2.10.0 sequence search
rounds of filtering. First, we removed indels (using the remove-                 engine, Tandem Repeat Finder v. 4.0.9 (Benson, 1999),
indels command), and any site with a depth of less than five or                  Dfam_Consensus database 3.1 (November 2020 release), and
more than 33 (approximately double the average depth across the                  used the “-species glaucomys” parameter for the analysis.
genome, using the min-meanDP and max-meanDP commands) and                            We used the gene prediction program AUGUSTUS 2.5.5 (Hoff
removed any low-quality genotype calls, with a score below 20 (us-               and Stanke 2019) to annotate the masked genome using predic-
ing the minGQ command), which in VCFtools are changed to miss-                   tions based on human genes. In addition, we incorporated RNA-
ing data. In the second round, we filtered to remove genotypes with              Seq data into AUGUSTUS using the transcriptome created from
more than 10% missing data (using the max-missing command).                      brain tissue by Brown et al., (2021). We used BLAT v. 1.04 to help
We did not filter to remove any SNP with a minor allele frequency                identify exon structure and allow for the subsequent generation
(MAF) as we have only one individual from each location and this                 of both intron and exon hints from alignments for AUGUSTUS
results in removing the private sites, instead relying on very high              (Hoff and Stanke 2019; http://augustus.gobics.de/binaries/
depth and stringent filtering to ensure a high-quality data set.                 readme.rnaseq.html). The genome run in AUGUSTUS used a par-
    The combined VCF file used for analyses with all individuals                 tial gene model allowing the prediction of incomplete genes at
contained 35,937,561 SNPs. After filtering, we measured the                      the sequence boundaries. The masked genome was split into 31
mean depth (using the depth command) and the frequency of                        parts of 1,995 sequences each to reduce the computational
4 | G3, 2022, Vol. 12, No. 1
resources and we concatenated the 31 output general feature for- Table 2 Nucleotide base composition of the long-read Glaucomys
mat (GFF) files into a single annotation file. volans reference genome
A C T G N
Comparative analyses
To compare whole-genome heterozygosity estimates, we used 29.77% 20.24% 29.75% 20.24% 0.17%
ANGSD to generate a site frequency spectrum and obtain hetero-
zygosity values for each individual. We used the parameters -C
for bacterial contaminants resulted in the further removal of an
50 -ref ref.fa -minQ 20 -minmapq 30 to remove the low-quality
average of 0.29% of reads. The final short read coverage for each of
bases and reads (Korneliussen et al. 2014). We generated a princi-
the four individuals were as follows: SFS_CC1 ¼ 15.75X,
pal component analysis (PCA) to determine the degree of differ-
SFS_25428 ¼ 17.55X, NFS_50254 ¼ 17.88X, and NFS_6525 ¼ 14.96X.
entiation between these samples. We also ran Pairwise
Our final VCF file contained 10% missing data. For all individuals,
Sequentially Markovian Coalescent (PSMC; Li and Durbin 2011) to
observed heterozygosity exceeded expected, while inbreeding coef-
model the historical effective population size and reconstruct the
Downloaded from https://academic.oup.com/g3journal/article/12/1/jkab373/6426101 by guest on 22 January 2022
ficients ranged from 0.00261 to 0.00358 (NFS_50254 ¼ 0.00276,
demographic history of both our northern and southern flying
NFS_6525 ¼ 0.00261, SFS_CC1 ¼ 0.00311, and SFS_25428 ¼ 0.00358).
squirrel genomes. We used the default parameters of 64 atomic
time intervals (-p “4 þ 25*2 þ 4 þ 6”), a generation time of 1.5 years
Comparative analyses and population history of
(COSEWIC 1998), and a mutation rate of m ¼ 2.0 109 muta-
G. sabrinus and G. volans
tions/site/generation (Gossmann et al. 2019).
Northern and southern flying squirrels grouped distinctly in our
PCA, while there was more variation among southern flying
Results and discussion squirrels, possibly due to collection locations that were farther
Glaucomys volans genome assembly apart (Figure 2). The first principal component accounted for
over 80% of the variation noted, and clearly separated both spe-
The final G. volans genome assembly was the untrimmed linked-
cies. Both southern individuals had higher whole-genome hetero-
read 10X Chromium assembly with Supernova (Weisenfeld et al.
zygosity relative to northern individuals. There are multiple
2018), which produced a genome consisting of 7,087 scaffolds
possible explanations for this result. For example, southern flying
50 Kb, a scaffold N50 of 455.26 Kb, a contig N50 of 75.63 Kb, a GC
squirrels are smaller-bodied and typically exhibit higher popula-
content of 40.48%, and a genome size of 2.40 Gb (Tables 1 and 2).
tion sizes and densities, whereas a lower effective population size
Although the genome produced here is fragmented compared to
in northern flying squirrels may result in decreased heterozygos-
the Earth BioGenome goals, future flying squirrel research will
ity (Arbogast 2007; Bowman et al. 2020). Overall, the levels of het-
benefit greatly from the presence of a reference genome. BUSCO
erozygosity of both flying squirrel species that we observed were
indicated the presence of 3,742 (91.2%) complete mammalian
comparable to other genome-wide estimates in mammals (see
genes of the 4,104 searched for. Our estimated genome size was
Figure 3 in Morin et al. 2021).
similar to the assembly of the thirteen-lined ground squirrel
Previous research has estimated the split between northern and
(Ictidomys tridecemlineatus; 2.5 Gb), whereas the BUSCO value for
southern flying squirrels to be in the early to mid-Pleistocene
the ground squirrel was 92.9% (Di Palma et al. 2011). Genome an-
(2,580,000–130,000 years ago; Arbogast 1999, 2007). Based on PSMC
notation of our final genome incorporating RNA-Seq data identi-
analysis, the split between the species seemed to occur approxi-
fied the locations of 19,124 protein-coding genes compared to
mately 1mya, whereas, after 1mya, the species exhibited different
28,262 protein-coding genes without using RNA-Seq data.
trajectories (Figure 3). The demographic reconstruction of one
Resequenced genome assembly northern flying squirrel (NFS_6525) showed an increase in recent
effective population size relative to the other northern individual
Trimming the concatenated short read pairs resulted in the re-
(NFS_50254; Figure 3). It is possible that the demographic history
moval of an average of 4.37% of reads. The human library was re-
of NFS_50254 more closely resembles that of the southern flying
moved from the full standard database, as its inclusion resulted in
squirrel samples. However, it is also possible that technical biases
a relatively high percentage of reads mapped as human due to
resulted in this pattern (e.g., relatively low sequencing coverage for
orthologous mammal genes. After removing the human library,
NFS_6525), as PSMC is less accurate in the recent past and is sus-
0.25–0.35% of the reads were classified as belonging to an identified
ceptible to an increase in effective population size as seen in our
bacterial taxon; screening trimmed concatenated short read pairs
data (e.g., Nadachowska-Brzyska et al. 2016). Previous work using
microsatellites has been consistent with panmixia in Ontario
Table 1 Summary statistics of the long read Glaucomys volans within each of these species (Garroway et al. 2011; Bowman et al.
reference genome
2020). To address introgression and hybridization concerns, future
Statistic Glaucomys volans genome research can utilize the reference genome produced here to per-
form analyses with a larger sample of genomes with varying
Scaffold sequence total (bp) 2.58 109
Number of scaffolds 61,815 degrees of introgression to help clarify these patterns.
Scaffold N50 (bp) 455,262
Scaffold L50 1,582
Scaffold N90 (bp) 117,214 Conclusion
Scaffold L90 5,080
We produced a high-quality southern flying squirrel reference ge-
Contig sequence total (bp) 2.53 109
Number of contigs 115,069 nome, an annotation in gff3 and bed format, and a
Contig N50 (bp) 75,631 RepeatMasked version of the genome, as well as high-coverage
Contig L50 9,446 northern and southern flying squirrel re-sequenced genomes.
Contig N90 (bp) 21,155
The availability of a high-quality reference genome is invaluable
Contig L90 30,374
in answering evolutionary questions surrounding hybridizationJ. F. Wolf et al. | 5
Downloaded from https://academic.oup.com/g3journal/article/12/1/jkab373/6426101 by guest on 22 January 2022
Figure 2 PCA of two northern (G. sabrinus—represented in turquoise) and two southern (G. volans—represented in yellow) flying squirrel genomic
variation. PC1 (x-axis) accounts for 81.2% of the variation, while PC2 (y-axis) accounts for 11.2% of the variation; combined, the first two principal
components account for over 90% of the genomic variation.
Figure 3 Reconstruction of historical effective population size (Ne) of both northern (G. sabrinus—represented in turquoise) and southern (G. volans—
represented in yellow) flying squirrels using PSMC analysis assuming a mutation rate m of 2.0 109 mutations/site/generation and a generation time of
1.5 years. Ne is in units of 1,000 individuals on the y-axis and time measured in thousands of years ago (Kya) is on the x-axis. Dashed lines separate the
individuals of the same species.
and introgression and for conservation efforts. This is the first Data availability
flying squirrel genome generated and will help future research
10X Chromium long-read and Illumina short-read data are
determine not only the presence of hybrids in the North
available at the National Center for Biotechnology Information
American flying squirrel hybrid zone but can also aid in identify-
(NCBI), under the BioProject accession number PRJNA723586.
ing loci of interest in these same populations.
This Whole Genome Shotgun project has been deposited at6 | G3, 2022, Vol. 12, No. 1
DDBJ/ENA/GenBankunder the accession JAJEJO000000000. The e.T9240A115091392. https://dx.doi.org/10.2305/IUCN.UK.2016-3.
version described in this paper is version JAJEJO010000000. RLTS.T9240A22257175.en.
Cassola F. 2016b. Glaucomys sabrinus. The IUCN Red List of
Threatened Species. 2016:e.T39553A22256914. https://dx.doi.org/
Acknowledgments 10.2305/IUCN.UK.2016-3.RLTS.T39553A22256914.en. Downloaded
The authors would like to thank: Michael G. C. Brown for assis- on 14 September 2021.
tance with sampling, Bridget Redquest and Austin Thompson for Chen IC, Hill JK, Ohlemüller R, Roy DB, Thomas CD. 2011. Rapid
range shifts of species associated with high levels of climate
DNA extractions, and Kathleen Lo for their comments on earlier
warming. Science. 333:1024–1026.
drafts of the manuscript.
Chown SL, Hodgins KA, Griffin PC, Oakeshott JG, Byrne M, et al. 2015.
Biological invasions, climate change and genomics. Evol Appl. 8:
Funding 23–46.
Chunco AJ. 2014. Hybridization in a warmer world. Ecol Evol. 4:
Downloaded from https://academic.oup.com/g3journal/article/12/1/jkab373/6426101 by guest on 22 January 2022
This research was supported by Natural Sciences and
2019–2031.
Engineering Research Council of Canada Discovery Grants to J.B.
COSEWIC 1998. Southern Flying Squirrel (Glaucomys volans)
and P.J.W., and by the Ontario Ministry of Northern
Assessment and Status Report. https://www.canada.ca/en/envi
Development, Mines, Natural Resources and Forestry. Funding
ronment-climate-change/services/species-risk-public-registry/
for sequencing was supported through the CanSeq150 program
cosewic-assessments-status-reports/southern-flying-squirrel/
of Canada’s Genomics Enterprise (www.cgen.ca). chapter-2.html.
Danecek P, Auton A, Abecasis G, Albers CA, Banks E, et al.; 1000
Conflicts of interest Genomes Project Analysis Group. 2011. The variant call format
and VCFtools. Bioinformatics. 27:2156–2158.
The authors declare that there are no conflicts of interest. Di Palma F, Alfoldi J, Johnson J, Berlin A, Gnerre S, et al. 2011. The
draft genome of Spermophilus decemlineatus. GenBank
GCA_000236235.1.
Literature cited Garroway CJ, Bowman J, Cascaden TJ, Holloway GL, Mahan CG, et al.
Abbott R, Albach D, Ansell S, Arntzen JW, Baird SJE, et al. 2013. 2010. Climate change induced hybridization in flying squirrels.
Hybridization and speciation. J Evol Biol. 26:229–246. Glob Chang Biol. 16:113–121.
Andrews S. 2010. FastQC: A Quality Control Tool for High Garroway CJ, Bowman J, Holloway GL, Malcolm JR, Wilson PJ. 2011.
Throughput Sequence Data. http://www.bioinformatics.babra The genetic signature of rapid range expansion by flying squirrels
ham.ac.uk/projects/fastqc (Accessed: 2021 October 3). in response to contemporary climate warming. Glob Chang Biol.
Arbogast BS. 1999. Mitochondrial DNA phylogeography of the new 17:1760–1769.
world flying squirrels (Glaucomys): implications for pleistocene Gossmann TI, Shanmugasundram A, Börno S, Duvaux L, Lemaire C,
biogeography. J Mammal. 80:142–155. et al. 2019. Ice-age climate adaptations trap the alpine marmot in
Arbogast BS. 2007. A brief history of the new world flying squirrels: a state of low genetic diversity. Curr Biol. 29:1712–1720.e7.
phylogeny, biogeography, and conservation genetics. J Mammal. Hoff KJ, Stanke M. 2019. Predicting genes in single genomes with
88:840–849. AUGUSTUS. Curr Protoc Bioinform. 65:1–54.
Arnold ML. 1992. Natural hybridization as an evolutionary process. Jun G, Wing MK, Abecasis GR, Kang HM. 2015. An efficient and scalable
analysis framework for variant extraction and refinement from
Annu Rev Ecol Syst. 23:237–261.
population scale DNA sequence data. Genome Res. 25:918–925.
Arnold ML, Martin NH. 2009. Adaptation by introgression. J Biol. 8:
Korneliussen TS, Albrechtsen A, Nielsen R. 2014. ANGSD: analysis of
9–11.
next generation sequencing data. BMC Bioinformatics. 15:356.
Barton NH. 2001. The role of hybridization in evolution. Mol Ecol. 10:
doi:10.1186/s12859-014–0356-4.
551–568.
Krosby M, Wilsey CB, McGuire JL, Duggan JM, Nogeire TM, et al. 2015.
Benson G. 1999. Tandem repeats finder: a program to analyze DNA
Climate-induced range overlap among closely related species.
sequences. Nucleic Acids Res. 27:573–580. 10.1093/nar/27.2.573
Nat Clim Change. 5:883–886.
9862982
Langmead B, Salzberg SL. 2012. Fast gapped-read alignment with
Bolger AM, Lohse M, Usadel B. 2014. Trimmomatic: a flexible trim-
Bowtie 2. Nat Methods. 9:357–360.
mer for Illumina sequence data. Bioinformatics. 30:2114–2120.
Li H, Durbin R. 2011. Inference of human population history from in-
Bowman J, Holloway GL, Malcolm JR, Middel KR, Wilson PJ. 2005.
dividual whole-genome sequences. Nature. 475:493–496.
Northern range boundary dynamics of southern flying squirrels:
Li H, Handsaker B, Wysoker A, Fennell T, Ruan J, et al.; 1000 Genome
evidence of an energetic bottleneck. Can J Zool. 83:1486–1494. Project Data Processing Subgroup. 2009. The sequence align-
Bowman J, O’Brien P, Wilson PJ. 2020. Landscape Genetics of Flying ment/map format and SAMtools. Bioinformatics. 25:2078–2079.
Squirrels in Ontario. Unpublished report, Environment and Mckenna A, Hanna M, Banks E, Sivachenko A, Cibulskis K, et al. 2010.
Climate Change Canada. The Genome Analysis Toolkit: a MapReduce framework for ana-
Brown MGC, Bowman J, Wilson PJ. 2021. Data on the first functional- lyzing next-generation DNA sequencing data. Genome Res. 20:
ly-annotated de novo transcriptome assembly for North 1297–1303.
American flying squirrels (genus Glaucomys). Data Brief. 37: Mead D, Fingland K, Cripps R, Portela Miguez R, Smith M, et al. 2020.
107267 10.1016/j.dib.2021.107267PMC: 34381854 The genome sequence of the eastern grey squirrel. Wellcome
Bushnell B, Rood J, Singer E. 2017. BBMerge—accurate paired shot- Open Res. 5:27. doi:10.12688/wellcomeopenres.15721.1.
gun read merging via overlap. PLoS One. 12:e0185056. Morin PA, Archer FI, Avila CD, Balacco JR, Bukhman YV, et al. 2021.
Cassola F. 2016a. Glaucomys volans (errata version published Reference genome and demographic history of the most endan-
in 2017). The IUCN Red List of Threatened Species. gered marine mammal, the vaquita. Mol Ecol Resour. 21:1008–1020.J. F. Wolf et al. | 7
Moritz C, Patton JL, Conroy CJ, Parra JL, White GC, et al. 2008. Impact Scordato ESC, Wilkins MR, Semenov G, Rubtsov AS, Kane NC, et al.
of a century of climate change on small-mammal communities 2017. Genomic variation across two barn swallow hybrid zones
in Yosemite National Park, USA. Science. 322:261–264. reveals traits associated with divergence in sympatry and allopa-
Muhlfeld CC, Kovach RP, Jones LA, Al-Chokhachy R, Boyer MC, et al. try. Mol Ecol. 26:5676–5691.
2014. Invasive hybridization in a threatened species is acceler- Scriber JM. 2014. Climate-driven reshuffling of species and genes: po-
ated by climate change. Nat Clim Change. 4:620–624. tential conservation roles for species translocations and recombi-
Nadachowska-Brzyska K, Burri R, Smeds L, Ellegren H. 2016. PSMC nant hybrid genotypes. Insects. 5:1–61.
analysis of effective population sizes in molecular ecology and its Smit A, Hubley R, Green P. 2013. RepeatMasker Open-4.1.0. http://
application to black-and-white Ficedula flycatchers. Mol Ecol. 25: www.repeatmasker.org (Accessed: 2021 October 3).
1058–1072. Taylor SA, Larson EL. 2019. Insights from genomes into the evolu-
Nolte AW, Gompert Z, Buerkle CA. 2009. Variable patterns of tionary importance and prevalence of hybridization in nature.
introgression in two sculpin hybrid zones suggest that geno- Nat Ecol Evol. 3:170–177.
mic isolation differs among populations. Mol Ecol. 18: Teeter KC, Payseur BA, Harris LW, Bakewell MA, Thibodeau LM, et al.
Downloaded from https://academic.oup.com/g3journal/article/12/1/jkab373/6426101 by guest on 22 January 2022
2615–2627. 2008. Genome-wide patterns of gene flow across a house mouse
Owens GL, Samuk K. 2020. Adaptive introgression during environ- hybrid zone. Genome Res. 18:67–76.
mental change can weaken reproductive isolation. Nat Clim Waterhouse RM, Seppey M, Simao FA, Manni M, Ioannidis P, et al.
Change. 10:58–62. 2018. BUSCO applications from quality assessments to gene pre-
Payseur B, Rieseberg L. 2016. A genomic perspective on hybridization diction and phylogenomics. Mol Biol Evol. 35:543–548.
and speciation Bret. Mol Ecol. 25:2337–2360. Weisenfeld NI, Kumar V, Shah P, Church DM, Jaffe DB. 2018. Direct
Rhymer JM, Simberloff D. 1996. Extinction by hybridization and in- determination of diploid genome sequences. Genome Res. 28:
trogression. Annu Rev Ecol Syst. 27:83–109. 606.1–767.
Rius M, Darling JA. 2014. How important is intraspecific genetic ad- Wood DE, Lu J, Langmead B. 2019. Improved metagenomic analysis
mixture to the success of colonising populations? Trends Ecol with Kraken 2. Genome Biol. 20:257 10.1186/s13059-019-
Evol. 29:233–242. 1891-0PMC: 31779668
Rogic A, Dubois G, Tessier N, Paré P, Canac-Marquis P, et al. 2016. Wood CM, Witham JW, Hunter ML. 2016. Climate-driven range shifts
Applying genetic methods to identify northern and southern fly- are stochastic processes at a local level: two flying squirrel spe-
ing squirrels and determine conservation needs. Conservation cies in Maine. Ecosphere. 7:1–9.
Genet Resour. 8:471–480.
Communicating editor: A. SethuramanYou can also read